The Inverse Forecast Effect
David D Clarke and Holly Blake
Department of Psychology University of Nottingham
University Park Nottingham
NG7 2RD
Telephone (Direct Line): (0115) 951 5284 Fax: (0115) 951 5324
E-Mail (JANET): [email protected]
Keywords Prediction Forecast Sequence Judgement Hindsight Scripts
Abstract
Sequence analysis is a technique for finding typical chains of events in a given type of situation, such as the build-up to a conflict. It has a number of advantages over the traditional experimental methods of psychology. It requires no manipulation of possible causes for instance. This makes it suitable for ‘historical’ materials where the events in question have already happened. It can also deal with complex chains of behaviour, where the cause (or sufficient condition) for an event is a particular combination of earlier events, stretching over time.
The usual techniques for doing this work by describing behaviour in terms of its transitional probability structure. They are well-established (Bakeman & Gottman, 1986; Gottman & Roy, 1990), and have been applied to a number of problems including group decision making (Fisher, 1970), marital interaction (Gottman et al., 1977), classroom behaviour (Gunter et al., 1993) and conversation (Thomas, Roger & Bull, 1983).
However there is a temptation to view the findings of a sequence analysis as more symmetrical than they really are. In the simplest case, a study may show that ‘A leads to B’, where A and B are two kinds of event or behaviour. But this is to confuse two quite different claims. On the one hand it may be that most A’s are followed by a B. That is A’s have B’s as their consequence. Or it may be that most B’s are preceded by A’s, perhaps because B’s have A’s as their cause. These two matters are quite separate. B may be a common consequence of A, without A being a common cause of B. A shot in the head commonly leads to death, but death is not usually caused by a shot in the head.
This is rather like the distinction between necessary and sufficient conditions. If A is sufficient for B, then when A occurs one can be sure that B will follow. Conversely, if A is necessary for B, then when B occurs one can be sure that A came beforehand. But this is rather more certain and clear cut than the cases we shall deal with here. They are about differences of degree in the probability that a particular later event follows an earlier one, or an earlier one precedes a later one.
For each sequence of events then, there is a ‘forward linkage’ as it might be called, describing what follows each type of event, and a ‘backward linkage’, describing what precedes each type of event. These could be thought of as chains of relative sufficiency and necessity. The point is that they are quite separate. Neither one determines or implies the other.
direction. Given an event they might be able to predict what will happen next, or else to work out what had happened just before. The one kind of understanding does not have to accompany the other.
In practical terms, a problem, like a road accident say, might be foreseeable, or it might be comprehensible after it happened (or both, or neither). In fact it was a study of road accidents that first brought this distinction to our attention (Clarke, Forsyth & Wright, 1995). In that study, several hundred police road accident case files were
analysed in detail. They seemed relatively straightforward to understand after the event, but presumably they had not been anything like as obvious beforehand, to the people involved. Maybe this is a feature of accident sequences, and part of what makes them dangerous. Maybe, it is a feature of action sequences more generally, and of the way people form and use knowledge about patterns over time. The following studies set out to investigate people’s understanding of the backward and forward linkage of events in a more systematic and general way.
It could be harder to reason backwards, or forwards, through a chain of events because the world itself is asymmetrical. Each event that occurs could have more possible consequences than possible causes, or vice versa. The train of events could be diverging, or converging, as time goes by. What is more, this may differ from one kind of action or event sequence to another. ‘Pure divergence’ would make it easy to infer past events from a knowledge of the present, but not future events. ‘Pure convergence’, on the other hand, would make the future relatively predictable, without making the past any easier to reconstruct.
______________ Figure 1 about here ______________
Asymmetries could also arise from the way people try to work out the future from the past, or the past from the future. It could be that one task is more familiar and more practised than the other, for instance.
To study these issues, we invented an experiment in which participants were given written descriptions of sequences of events, broken down into separate units. In one experimental condition, the ‘forward condition’, they were shown the first event in a sequence, and given five choices as to what happened next. One of the five was the real next event. When they had chosen, they were told the right answer, so their later choices would be based on true information, not an escalating series of mistakes. Then they went on to decide which of five possibilities followed that second event, and so on.
what had occurred immediately beforehand. They were given feedback, and they continued in a similar way until the start of the sequence was reached.
In preparing the materials for this kind of study, it is important that the alternatives to each real event are created in an unbiased way. For instance, the
backward condition is made too easy if the alternatives for each event are all thought up while reading the true sequence forward. Because then, each alternative tends to follow well from the event before, without necessarily leading on smoothly to the event after. As a result of this, experimental participants in the forward condition will have a harder time, with several plausible alternatives to choose from at each stage, only one of which is correct. Participants in the backwards condition though, will find the task much easier, because only the true event at each stage will seem to fit its context. The two studies which follow avoid this bias in different ways.
The inverse forecast effect is not just a matter of ‘hindsight’ in the usual sense. Nor is the difference between forward and backward conditions as trivial as it might seem at first. We are not comparing what it is like to think about the future, knowing the past, with what it is like to think about the past, knowing the past. These are the only two possibilities we normally have in everyday life. The past is always available to us, and the future is always a mystery. In the studies though, the contrast is between what it is like to think the future, knowing the past, and what it is like to think about the past, knowing only the ‘future’.
The ‘hindsight effect’ as described by other researchers is different from the inverse forecast effect. It is “the tendency to over-estimate the degree to which one would have been able to predict the outcome of an event or the answer to a question after one has received feedback about one’s prediction or after the event has occurred” (Fischoff, 1975). It is a robust phenomenon, affecting many different areas of
experience (Fischoff & Beyth, 1975; Campbell & Tesser 1983; Arkes, Wortmann, Saville & Harkness, 1981). For example, Lofland (1969) and Shur (1971) found people tend to reconstruct the biographies of deviants in ways that make their current situation seem inevitable given their life histories. Fischoff (1975) gave the name ‘creeping
Experiment One
Introduction
Method
Participants
One hundred and twenty eight students were recruited from the University of Nottingham. There were 64 males and 64 females. Their ages ranged from 17-28, with a mean of 20.5 years and standard deviation of 1.7.
Materials
Each participant was given written instructions for either the ‘forward’ or ‘backward’ condition (as described below); a description of the incident they were to consider; and a rating sheet for their responses.
Participants each saw one of four violent incidents. These were drawn from the database of the ‘Keeping Pubs Peaceful’ research project, being carried out in the same department. Incidents were chosen which contained several distinct events in a clearly defined sequence, and were typical of the pool of over 2,000 cases on record.
The incidents were each presented as four, five or six discrete events, printed on separate pages. After each event, on the same page, was a choice of five alternative events which might have happened just after that (for participants in the forward condition), or just before (for participants in the backward condition). Only one of the alternatives was the ‘true’ event which had actually occurred. The ordering of items in each group of five alternatives was randomised. No alternatives were given for the first event in the sequence for participants working forwards, or for the last event for participants working backwards.
The false alternatives to each event had been created in the following way. This was to prevent any bias arising through experimenters thinking up items which favoured the forward or the backward condition. Twenty student volunteers, who did not know the nature of the experiment, created a pool of possible next events, and possible previous events, for every real event in the study. Each alternative was different from the real event in kind, not just in degree. Then the researchers assembled the groups of five items that made up each step in the experimental procedure.
already, which would also seem realistic. There would also be two further alternatives which would not necessarily fit with what they had seen already, and may not seem realistic. All this will become clearer in the example below.
Design
A 4 x 2 between-participants design was used with independent variables of incident (or ‘case’ – A, B, C or D) and direction (backwards or forwards). The dependent variable was an accuracy score showing how well participants identified the true event in each group of alternatives.
Procedure
Participants in the forward condition worked through their case from beginning to end, trying to find the true next event in each group of five alternatives. In effect they were making predictions, from a list of possibilities, of what happened next at each stage. They rated every alternative on a seven point scale where 1 meant ‘extremely unlikely to occur next’, and 7 meant ‘extremely likely to occur next’.
Participants in the backward condition worked from the end to the beginning, trying to find the real previous event in each group of five alternatives. In effect they were making inferences, ‘inverse forecasts’ as we call them, from a list of possibilities, of what had just happened at each stage.
The forward and backward conditions were defined for participants by slightly different versions of the instructions. In both conditions feedback on the correct choice was given before participants moved on to the next group of five alternatives.
It may help to work through an example using the case in Table One. To save space this is not set out in the page-by-page format the participants saw.
______________ Table 1 about here ______________
The real incident, as it happened in a real pub, consisted of the events in bold type, 1a, 2c, 3e, and so on. When read through on their own, in the correct order, they give the original course of events as it occurred. They were the starting point for making the stimulus materials. The other events, such as 1b to 1e, were the invented
alternatives.
(The numbering of the alternatives and the bold type are only used here to make the example clearer. They were not part of the experimental materials. Alternatives 1b - 1e were not used by participants in the forward condition. They only formed part of the stimulus material for the backward condition.)
A participant in the backward condition, by contrast, would first be given event 6c, the real last event, and asked to rate events 5a - 5e for their likelihood of coming just beforehand. Then they would turn a page in the experimental booklet, discover that 5b was the real penultimate event, and go on to rate events 4a - 4e for their likelihood of coming just before that, and so on.
After the task was complete, the likelihood ratings for correct and incorrect alternatives were weighted and combined to form a single accuracy score. The
participant’s rating for the correct item was multiplied by four, and the rating of each incorrect item by minus one. These values were then summed. So a participant who rated the correct item as five, and the incorrect ones as four, three, two, and one, would get an accuracy score of ten. If they rated all the items the same they would score zero. If they rated the wrong items lower on average than the right one they would get a positive score. If they rated the wrong items higher on average than the right one they would get a negative score.
This might seem more complicated than just using the ratings for the correct items to form the dependent variable. However, that could be misleading. A participant who gave all the alternatives a high rating would do well on the task. Someone giving all the alternatives a low rating would do badly. Neither of them would need to see any difference in plausibility between the true event and the incorrect alternatives.
Results
The data were checked for skew and kurtosis and found to be within normal limits. Variance was homogeneous. A 4 x 2 ANOVA was conducted on the accuracy scores, for the independent variables of case (A, B, C, or D) and direction (forward or backward). The means are shown in Table Two.
_____________ Table 2 about here
_____________
Accuracy was significantly higher in the backward condition (F=112.095,
Experiment Two
Introduction
The ‘inverse forecast effect’ has so far been found in three areas: road accidents (Stokes, unpublished), construction site accidents (Thomas, unpublished), and violent incidents in public houses (Experiment One, above). These all involve relatively short-term sequences of actions and events. The next question was whether it occurs in long-term behaviour patterns as well. The best place to check this, or at any rate the longest term, was the whole life course of individuals, using autobiographical materials.
The course taken by human lives has been studied from various points of view. It has been seen as a sequence of person-situation interactions (Baltes & Schaie, 1973); a sequence of transactions (Lowenthal, Thumher & Chiriboga, 1978); and a sequence of episodes (Murray, 1951). Individuals seem to hold implicit causal theories of events in a life course, which can help with prediction and explanation. Life experiences can also be divided into a sequence of common stages (Runyan, 1980), which are useful when making predictions.
The structure of autobiographical accounts was studied by Clarke (1995). In that experiment participants were asked to reconstruct brief autobiographies of other people from pieces given in the wrong order. The fact that this is possible suggests people have some kind of template, which Clarke called a ‘life-script’ (cf Abelson, 1976).
Reconstruction was generally more accurate for ‘high-level’ accounts or complete life stories, than for ‘low-level’ accounts which just covered two or three years of the person’s life.
Method
Participants
Eighty more students were recruited from the University of Nottingham. There were 40 males and 40 females. They were aged 18-24, with a mean of 20.5 years and a standard deviation of 1.8. Five participants were allocated at random to each cell of the 4 (cases) x 2 (levels) x 2 (directions) design. Gender was fully crossed with case and direction.
Materials
The materials were short autobiographical accounts taken from an earlier
experiment. In that study, each participant had written two accounts. One covered their whole life story up to the present (the ‘high-level’ version). The other covered a shorter period of 2-5 years about a third of their life ago (the ‘low-level’ version). Each account consisted of a sequence of separate events written on separate cards. The second, low-level account, was written without reference to the first. The accounts of two males and two females were drawn at random for use here, from the four males and four females who participated in the original study.
Each account was about 25 events long. The real beginnings and endings of the accounts were not used as they may have contained ‘scene-setting’ and ‘closing’ devices which would create direction biases. So only seven events from each account were used, starting at a different point between the 5th and 15th event for each account. Like all autobiographies though, these accounts were still bound to be asymmetrical in some ways, as authors can include the beginnings of their own life stories but not the endings.
The events making up each seven-item test sequence were presented on separate pages, together with a choice of next (or previous) events for participants to choose from. The four alternatives to each real event were items chosen at random from the unused parts of the same autobiography. This is another way of avoiding biases which would make the task easier for participants in either the forward or the backward condition. The position of the real event within the groups of five alternatives was varied across actions and cases to avoid order and practice effects. Each participant was also given written instructions for either the ‘forward’ or ‘backward’ condition, and a rating sheet for their judgements of likelihood for each alternative.
_____________ Table 3 about here
_____________
Unlike the materials in Experiment One, the events are quite detailed. Also, in Experiment Two, the alternatives may not all seem equally plausible, as they have been picked at random from other parts of the same person’s account. They function as ‘background noise’, against which the true event may sometimes stand out quite clearly. But there is still no reason for this to be a biasing factor, making the backward condition any easier than the forward one.
Design
A 4 x 2 x 2 between-participants design was used, with independent variables of case (1, 2, 3 or 4), level (high- or low-level accounts), and direction (backwards or forwards). The dependent variable was an accuracy score showing how well participants identified the true event in each group of alternatives.
Procedure
As in Experiment One, each participant worked forwards or backwards through a single sequence. At each stage they rated all the five alternatives for the likelihood of its being the next event (or the previous event, if they were in the backward condition).
In the example above, some participants, in the forward low-level condition, would work through this account until they came to alternatives 3a to 3e, and rate them for likelihood. Then they would turn a page in their experimental booklet, discover that 3c was the true event, and go on to rate events 4a - 4e for their likelihood of coming next. They would then continue in a similar way to the end of the sequence.
Other participants in the backward, low-level condition, would be working through the account in the opposite direction until they came to alternatives 4a to 4e, and rated them for likelihood. Then they would turn a page in their experimental booklet, discover that 4b was the true event, and go on to rate events 3a - 3e for their likelihood of coming just before that. They would then continue in a similar way until they reached the earliest event in the sequence.
Results
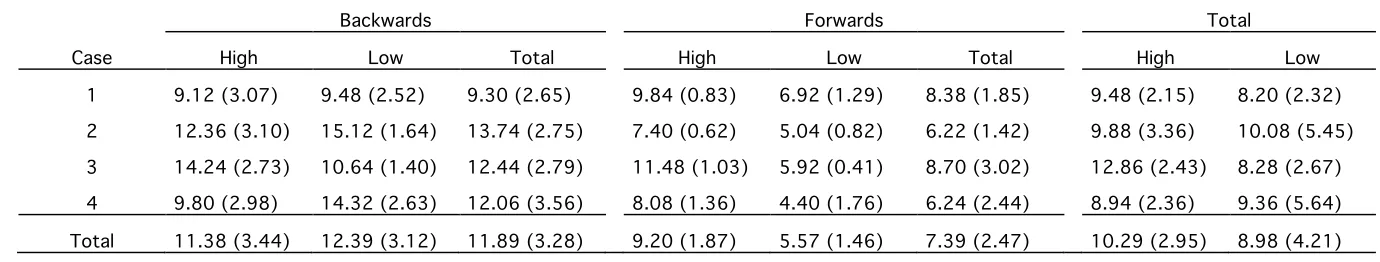
The data were checked for skew and kurtosis and found to be within normal limits. Variance was homogeneous. A 4 x 2 x 2 ANOVA was performed on the accuracy scores, with independent variables of case (1, 2, 3, or 4), level (high or low) and direction (backwards or forwards). The means are shown in Table Four.
_____________ Table 4 about here
_____________
Again, accuracy was significantly higher in the backward condition (F=103.158, df=1,64, ms=3.926, p<0.001). There was also a main effect of case (F=3.159, df=3,64, ms=3.926, p<0.05), with case 3 producing the highest scores, followed by case 2, then 4, then case 1.
Case interacted with direction (F=10.298, df=3.64, ms=3.926, p<0.001) so the difference in accuracy between backwards and forwards conditions was greater for some cases than others. Tukey’s HSD showed no effect of direction for case 1, but
participants were significantly more accurate in the backwards condition for case 2 (observed difference = 7.52), case 3 (observed difference = 3.74) and case 4 (observed difference = 5.82) with HSD=2.782, df=3,64, p<0.05.
There was a main effect for level (F=8.742, df=1,64, ms=3.926, p<0.005) with the high-level accounts producing more accurate performance.
There was an interaction between case and level (F=6.778, df=3.64, ms=3.926, p<0.001) suggesting that the accuracy difference between high-level and low-level accounts was greater for some cases than others. However, Tukey’s HSD only showed a significant difference for case 3 (observed difference = 4.58, HSD=2.782, df=3,64, p<0.05) with the high-level account producing more accurate performance.
Direction also interacted with level (F=27.419, df=1,64, ms=3.926, P<0.001), with the backwards condition favouring the low-level accounts more than the high-level accounts. This may be because the high-level sequences are more strongly scripted and more predictable overall (Clarke, 1995). Tukey’s HSD showed that the forwards low condition was significantly more accurate than forwards high (observed difference = 3.63). Backwards low was significantly more accurate than forwards low (observed difference = 6.82). And backwards high was significantly more accurate than forwards high (observed difference = 2.18). HSD=1.657, df=1,64, p<0.05, in all these cases. The difference between backwards low and backwards high was not significant.
Discussion
So far the inverse forecast effect has turned up everywhere we have looked. Why does it occur? There are several possibilities.
Is it an artefact of the experiment?
We do not think so. The key lies in the way the four alternatives for each true event are created. It is crucial to make sure that they do not fit better with the event before than the event after. If they do, then it become too easy to pick the right event out from a group of rather implausible alternatives when working backwards. But it remains hard to pick the right event from a group of plausible alternatives when working forwards. Various procedures were used to prevent this happening.
In Experiment One, all the alternatives were created by a separate group of participants who were blind to the true nature of the experiment. Each set of five alternative events the main participants had to choose from contained the same
ingredients. There was always one true event. There were two that had been created to fit well with the event before it. And there were two that had been created to fit well with the event that followed it. The alternatives that were actually used in the study were drawn at random from a pool of possibilities. None of the participants involved in this part of the experiment reported any greater difficulty in creating either one kind of alternative or the other. Neither type of alternative event stands out as being more unnatural, or more detailed.
In Experiment Two we went even further and eliminated the need for artificially created alternatives altogether. Now the only events to be used were drawn from the long stretches of real autobiographical material that was our starting point. A sequence of seven consecutive real events made up the spine of each case. Each event was pitted against four alternatives drawn from other sections of the same autobiography. This meant that no-one had to try to match the effort that went into creating different kinds of events, or to match their likelihood of occurrence. So no possible bias could arise from a failure to do so. This procedure does mean, of course, that events which seem not to fit the context too well are sometimes used as alternatives. This may raise performance levels overall. But it does not favour the backward condition in particular, and cannot account for the experimental result.
Is the world itself structured in this way?
occurrences. This representation emphasises the complexity of an unknown future. The game tree for chess, for example, has a vast number of branches and is at first mostly divergent. Each situation has more possible futures than it had pasts. In principle all possible games of chess, and a lot of the information a player would need to pick out winning strategies, can be represented in a single tree. In practice though, the resulting structure is astronomically big and complicated, so it is not a feasible tool to use.
This is also to overlook the convergence that can occur. Any situation in the mid- or end-game of chess can be arrived at by a number of routes. An inverse game tree could be drawn up, looking like the convergent tree in figure one, but this is seldom done. It would be just as valid as the more usual kind of game tree, but which would be the more complicated? In everyday life, would it turn out that each situation has more possible futures than it had possible pasts, or the reverse? If it were the former, we should have all the explanation we needed for the inverse forecast effect.
Aristotle thought of the world as a one-way causal hierarchy, either top-to-bottom or left-to-right. Control flows from the left to the right, or down the hierarchy, but not up. “... the upper causes rain down, so to speak, constant action and order [ ... ] without being affected by anything below” (Santillana, 1961). This linear mechanism is quite different from the cycles and exchanges that are found in the natural systems view (Laszlo, 1972).
Lay people tend to share this linear ‘view of causation, according to White’s work on common-sense theories of the natural world. They see the universe “like a large and complex machine which operates smoothly and never runs down, but which is endowed with purposiveness, direction and natural justice” (White, 1992).
Our experience of time is marked by a definite difference between past and future. But is this a property of time itself, or something in the eye of the beholder? In a hypothetical world where time ‘runs backwards’, “death comes before birth, the blow would follow the wound, and all must seem irrational” (Bradley, 1902). Yet in 1964, Smart claimed that it is misleading to conceptualise time ‘flowing’ in a particular direction. He proposed that “the temporal asymmetry is not due to the properties of time itself (which are purely formal) but is due to an asymmetry in the context of the world”. Even if such a back-to-front world were possible, it would only be the events which would be reversed. Our sense of before and after would remain intact. “... whatever the laws of nature, the direction of time in our personal experience is the direction of ever increasing knowledge of events” (Whitrow, 1980).
foresee. But the converse is not true. The heap of rubble will not show future generations what kind of building it came from. So when increasing entropy is the guiding principle, the opposite of an inverse forecast effect should be expected.
Is the effect a feature of the participants?
The inverse forecast effect could come about because people are better for some reason at inferring pasts from futures, than they are at inferring futures from pasts. They may simply have had more practice at contemplating the causes of events, and how situations come about, than at supposing what may happen next. They may not usually have the time or inclination to weigh up the alternatives and outcomes of events like an argument in a pub, or a lane change while driving their car. But after the event they may be more used to tracing its history, especially if it was a problem, to see where things went wrong.
People sometimes use whatever information is available to predict and explain events (McGuire, 1966), or they may rely on heuristics (Tversky & Kahneman, 1974; Ajzen, 1977), or on scripts (Abelson, 1976). Similarly with longer-term patterns of behaviour, they may refer to ‘culturally specified norms’. These are implicit theories about the order of life events in other people’s experiences (Conway & Bekerian, 1977). It could be that these various forms of social representation are themselves structured or accessed in ways that make it easier to link each event with its past than with its future.
Is language the key?
All the materials in which the inverse forecast effect has been shown so far have been based on narrative descriptions of trains of events. Perhaps there is something about the way that narrative is constructed that links each piece of a story more strongly to its past than to its future. We tried to remove the most obvious cues, such as anaphor, from the experimental materials, but there may be other narrative devices which help participants more when working backwards.
Embryologists use a similar property in the sequences they study. Sectioned embryos from different stages of development are often examined ‘backwards’, from the oldest to the youngest. Well-defined structures in the later embryos can easily be traced back to the shapeless balls of cells from which they grew. Working forward though, it is much harder to take the unformed early structures and to recognise what they will become.
Future possibilities.
Further experiments need to be done. Larger and smaller language fragments should be examined. On the larger scale, stories or factual reports could be divided in half, and participants asked to predict the second half given the first, and vice versa. Alternatively, on a smaller linguistic scale, one could sample individual sentences and have participants predict the end from the beginning, or the beginning from the end. We also need to discover the limits of this effect, if we are to understand its origins. In what kinds of sequences, if any, does it not occur? If the inverse forecast effect arises from the language used in these tasks, it should disappear with other kinds of data. If it is not a feature of the language, but is something to do with the events themselves, then the effect should remain. A possible test would be to re-analyse some transition matrices based directly on observational data. Alternatively video clips, or sequences of still photos or line drawings could be used as stimuli. This would avoid the problems which arise specifically with materials based on narrative. ‘Pseudotexts’ could also be used in experiments like the ones reported here. These would be artificial sequences of letters or digits produced with relatively more divergent or more convergent structures.
A better understanding of the inverse forecast effect should give us insight into behaviour sequences in general, and the processes which connect the future with the past. It is just possible that we shall learn things which are practically useful too, which increase our powers of foresight, and suggest new ways to avoid or to manage
problems.
Acknowledgements
References
Abelson, R. P. (1976) Script processing in attitude formation and decision making. In J. S. Carroll & J. W. Payne (Eds.) Cognition and Social Behavior (pp. 33-45). New York: Wiley.
Ajzen, I. (1977) Intuitive theories of events and the effects of base rate information on prediction. Journal of Personality and Social Psychology, 35, 303-314.
Arkes, H. R., Saville, P. D., Wortmann, R. L., & Harkness, A. R. (1981) Hindsight Bias among physicians weighing the likelihood of diagnosis. Journal of Applied Psychology, 66(2), 252-254.
Bakeman, R. Gottman J R. (1986) Observing interaction: An introduction to sequence analysis. Cambridge: C.U.P.
Baltes, P. B. & Schaie, K. W. (1973) Life-span developmental psychology: Personality and social interaction. New York: Academic Press.
Bradley, F. H. (1902) Appearance and Reality. London: Swan Sonnenschein.
Campbell, J. D. & Tesser, A. (1983) Motivational interpretations of Hindsight Bias - An individual differences analysis. Journal of Personality. 51(4), 605-620.
Clarke, D. D. (1995) Life scripts: Implicit representations of life-course patterns. Journal of Social Behavior and Personality, 10(4), 871-884.
Clarke, D. D. Forsyth, R. S. Wright, R. L. (1995) The analysis of pre-accident sequences. Contractor Report No. CR 305. Crowthorne, Berkshire: Dept of Transport / Transport Research Laboratory.
Conway, M. A, Bekerian, D A. (1987) Organisation in autobiographical memory Memory and Cognition, 15 (2), 119-139.
Fischoff, B. (1975) Hindsight ! Foresight: The effect of outcome knowledge on judgement under uncertainty. Journal of Experimental Psychology: Human Perception and Performance, 1(3), 228-299.
Fischoff, B. & Beyth, R. (1975) “I knew it would happen” - Remembered probabilities of once future things. Organisational Behaviour and Human Performance, 13, 1-16. Fisher, B. A. (1970) The process of decision modification in small decision groups.
Journal of Communication, 20(1), 51-64.
Gottman, J. M., Markman, H., & Notarius, C. (1977) The topography of marital conflict: A sequential analysis of verbal and non-verbal behavior. Journal of Marriage and the Family, 39, 461 - 477.
Gottman, J. M. & Roy, A. K. (1990) Sequential analysis: A guide for behavioral researchers. Cambridge: Cambridge University Press.
Hearnden, K. (1988) Violence at Work, Industrial Safety Data File. London: United Trade Press.
Laszlo, E. (1972) The systems view of the world. Oxford: Blackwell. Lofland, R. (1969) Deviance & Identity. Englewood Cliffs, NJ: Prentice-Hall.
Lowenthal, M., Thunher, M. & Chiriboga, D. (1978) Four stages of life. San Francisco: Josey-Bass.
McGuire, W. J. (1966) Attitudes and opinions. Annual Review of Psychology, 17, 475-514.
Murray, H. A. (1951) Toward a classification of interaction. In T. Parsons & E. A. Shils (Eds.) Toward a general theory of action (pp. 434-464). Cambridge, Mass: Harvard University Press.
Painter, K. (1987) ‘It’s part of the job’: Violence at work. Employee Relations, 9(5), 1-4. Runyan, W M. (1980) A stage-state analysis of the life course. Journal of Personality and
Social Psychology, 38(6), 951-962.
Santilla G de (1961) The origins of scientific thought: From Anaximander to Proclus - 600 BC to 300 AD. London: Weidenfeld & Nicholson
Schank, R. C. Abelson, R. P. (1977) Scripts, plans, goals and understanding. Hillsdale, New Jersey: Erlbaum.
Shur, E. M. (1971) Labelling deviant behavior; Its sociological implications. London: Harper & Rowe.
Smart, J. J. C. (1964) Problems of space and time. Macmillan: London.
Stokes, S. (1990) Drivers’ foresight and hindsight for events in road accidents. Unpublished student project, University of Nottingham Department of Psychology.
Thomas, W. (1996) An investigation comparing people’s ability to infer earlier events given a knowledge of later ones, with their ability to infer later events from earlier ones. Unpublished student project, University of Nottingham Department of Psychology.
Thomas, A. P., Roger, D. & Bull, P. (1983) A sequential analysis of informal dyadic conversation using Markov chains. British Journal of Social Psychology, 22, 177-188.
Tversky, A. & Kahneman, D. (1974) Judgement under uncertainty: Heuristics and biases. Science, 185, 1124-1131.
Walster, E. (1967) ‘Second Guessing’ important events. Human Relations, 20, 239-250. White, P. A. (1992) The anthropomorphic machine: Causal order in nature and the world
of common sense. British Journal of Psychology, 83, 61-69.
Figure 1
PURE DIVERGENCE PURE CONVERGENCE
Table 1
1a Argument between two customers playing pool 1b Two barred customers enter pub
1c Manager refuses to serve drink to two drunk customers 1d Manager slow to serve two drunk customers
1e Argument between staff and customers
2a Customer 1 attacks customer 2 2b Intervention by third customer
2c Customers engage in rowdy behaviour 2d Customer attack on property
2e Customer 1 threatens customer 2
3a Manager forcefully attempts to eject customers 3b Intervention by other customers
3c Customer 1 attacks customer 2 3d Intervention by other staff
3e Manager requests customers to leave
4a Customers threaten staff
4b Customers become verbally abusive 4c Intervention by other customers 4d Customers attack property 4e Customer attack on manager
5a Police are called
5b Manager forcefully attempts to eject customers 5c Customer threatens manager
5d Manager requests customer to leave 5e Intervention by other staff
6a Customers start fighting 6b Customers threaten manager 6c Customers attack manager 6d Customers attack property
Table 2
Case Backwards Forwards Total
Table 3
3a I began a new romance in November and in December we and another couple flew to the British Virgin Islands where the four of us sailed in leisure for ten days on a fully equipped 33 foot sailboat.
3b I submitted formal proposals to several potential sponsors and received a letter from the Bank of America of San Francisco stating that they might be interested, but they would like me to acquire more ocean sailing experience. 3c I had been winning races single handedly on my 13
foot boat, so I progressed to a 16 foot catamaran and did well with that too.
3d My business had its ups and downs, and when it was down I turned to waitressing, a short stint in a job with an
employment agency, a job teaching bakery employees how to decorate cakes etc...
3e I bought a 13 foot catamaran and spent nearly every day of the spring, summer and autumn sailing it and doing my illustrating at night.
4a I never in the seven months that I spent living alone in the caravan encountered another woman doing the same , alone.
4b Friends who were heavily involved with sailing began to encourage me to take advantage of my financial independence and single status by aspiring to do something spectacular with my sailing skills.
4c It seemed quite an idyllic life and my social circle expanded greatly within the yacht club, of which I had become the first woman elected to the board of directors.
4d I bought a book entitled “The adventurers guide” and planned a journey to out of the way places and unlikely destinations, focusing on the Near East and Middle East. 4e My search, and the entire project came to an end when a
newspaper reported that a Polish woman had just
Legends for figures and tables
Figure 1 Schematic representation of purely divergent and purely convergent chains of events.
Table 1 One of the cases used in Experiment One. The true sequence is picked out in bold.
Table 2 Accuracy as a function of direction and case in Experiment One. Standard deviations are in parentheses.
Table 3 An extract from one of the low-level cases used in Experiment Two, showing two consecutive real events in bold, and their incorrect alternatives.
Backwards Forwards Total
Case High Low Total High Low Total High Low
1 9.12 (3.07) 9.48 (2.52) 9.30 (2.65) 9.84 (0.83) 6.92 (1.29) 8.38 (1.85) 9.48 (2.15) 8.20 (2.32) 2 12.36 (3.10) 15.12 (1.64) 13.74 (2.75) 7.40 (0.62) 5.04 (0.82) 6.22 (1.42) 9.88 (3.36) 10.08 (5.45) 3 14.24 (2.73) 10.64 (1.40) 12.44 (2.79) 11.48 (1.03) 5.92 (0.41) 8.70 (3.02) 12.86 (2.43) 8.28 (2.67) 4 9.80 (2.98) 14.32 (2.63) 12.06 (3.56) 8.08 (1.36) 4.40 (1.76) 6.24 (2.44) 8.94 (2.36) 9.36 (5.64)
[image:26.842.77.767.181.312.2]