ORIGINAL RESEARCH
Domain transformation approach to deterministic
optimization of examination timetables
Siti Khatijah Nor Abdul Rahim1,2, Andrzej Bargiela3,4, Rong Qu3
1School of Computer Science, University of Nottingham (Malaysia Campus), Selangor, Malaysia
2Faculty of Computer and Mathematical Sciences, Universiti Teknologi MARA (Perak), Seri Iskandar, Perak, Malaysia 3School of Computer Science, University of Nottingham, Nottingham, UK
4Institute of Informatics, Krakow University of Technology, Krakow, Poland
Correspondence: Siti Khatijah Nor Abdul Rahim. Address: School of Computer Science, University of Nottingham (Malaysia Campus), Jalan Broga, 43500, Semenyih, Selangor, Malaysia. Telephone: 60-389-248-000. Email: [email protected].
Received: August 30, 2012 Accepted: October 30, 2012 Online Published:
DOI: URL:
Abstract
In this paper we introduce a new optimization method for the examinations scheduling problem. Rather than attempting direct optimization of assignments of exams to specific time-slots, we perform permutations of slots and reassignments of exams upon the feasible (but not optimal) schedules obtained by the standard graph colouring method with Largest Degree ordering. The proposed optimization methods have been evaluated on the University of Toronto, University of Nottingham and International Timetabling Competition (ITC2007) datasets. It is shown that the proposed method delivers competitive results compared to other constructive methods in the timetabling literature on both the Nottingham and Toronto datasets, and it maintains the same optimization pattern of the solution improvement on the ITC2007 dataset. A deterministic pattern obtained for all benchmark datasets makes the proposed method more understandable to the users.
Key words
Examination Timetabling, Optimization, Slots permutations, Reassigning exams
1 Introduction
Timetabling problems exist in numerous areas including educational timetabling, nurse rostering, transportation timetabling, sports timetabling and so on. Of all the timetabling problems, it was reported that the educational timetabling is one of the most widely studied problems [19]. Examples of educational timetabling include school timetabling, university course timetabling and university examination timetabling. In this study, we focus on the examination timetabling problem.
Two types of constraints defined in the timetabling literatures are:
Hard Constraints
These are the constraints that must be fulfilled at all times. The primary hard constraint is that two exams with a common student cannot be scheduled in the same slot. Another hard constraint that needs to be conformed is the room capacity; i.e. there must be enough space in a room to accommodate all students taking a given exam. A timetable which satisfies all hard constraints is called a feasible timetable.
Soft Constraints
Soft Constraints are not absolutely crucial but satisfaction of these constraints is beneficial to students and/or the institution. An example of a soft constraint is a requirement to space out exams taken by individual students as widely as possible across the examination session so that they have adequate revision time between their exams. Normally one cannot satisfy all soft constraints thus there is a need for a performance function measuring the degree of fulfillment of these constraints.
Feasible timetable can have exam orderings which do not satisfy many of the soft constraints. Consequently, a separate optimization process needs to be deployed to obtain better quality schedules. In general, optimization can be seen as a process that maximizes the benefits while minimizing the investment in resources that facilitate these benefits [24]. Optimization can be applied to many areas and disciplines. In the area of the examination scheduling, optimization methods include Constraint Logic Programming [15] and Ant Colony [14], etc., in addition to metaheuristics in recent years
[19]
.
1.1 Overview of the proposed optimization method
This study has adopted an approach to the design of the exam schedule optimization that focuses on promoting understandability of the optimization process. To this end, we have avoided random exploration of the solution space such as that widely proposed in the literature, and have adhered to the deterministic evaluation of the search direction during the optimization process. In this study we used benchmark datasets (University of Toronto, University of Nottingham and International Timetabling Competition (ITC2007)). A key step in the proposed exam scheduling method was the pre-processing of constraints prior to the generation of a feasible timetable. This is done through the abstraction of essential features of the exam scheduling problem from the original student-exam data.
This data abstraction process constitutes a significant methodological contribution of this study, as it enables subsequent optimization of the examination schedule without the need to refer to the voluminous student-exam data in the course of the optimization. The approach was inspired by the insights from our previous studies on industrial process optimization
[1], [4], [17] and has been formalized as a Granular Computing methodology [5-7, 16]. We propose that the transformation of the
problem domain is an effective methodological approach to dealing with complex examination timetabling problems. By performing an appropriate pre-processing of the original student-exam data into an exam conflict matrix and a spread matrix we have mapped the original problem expressed in the multi-dimensional space of exams and students into a space with a reduced dimensionality of exams and exam-slots. We will refer to this approach to solving the timetabling problem as the domain transformation approach.
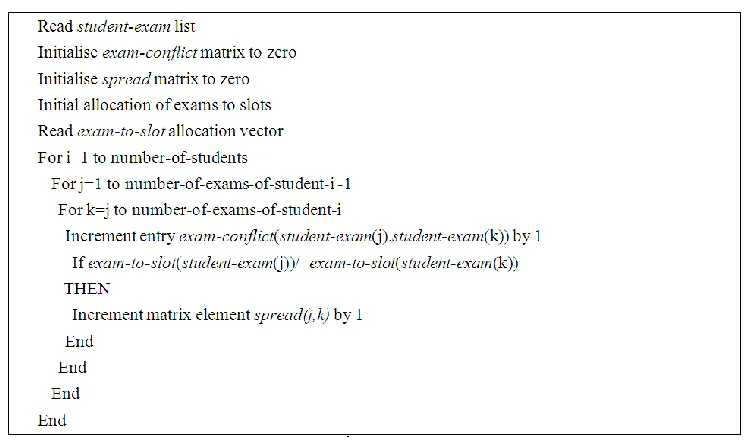
The exam conflict matrix is generated by incrementing the value at position (i,j) by 1 for each student taking exams i and j
when the student-exam list is traversed. Using this information (exam conflict matrix), together with an initial grouping of exams information through the early pre-processing stage, the spread matrix is then generated. This is done by incrementing the value at position (p,q) by 1 if exam p and exam q are not grouped together in the early allocation process (means they are clashing).
[image:3.612.125.497.217.438.2]The pre-processing of the original student-exam data into the exam conflict matrix and the spread matrix pays dividends in terms of minimizing the subsequent cross checking and cross referencing in the original data in the optimization process, thus speeds up the scheduling task. The essence of pre-processing is summarised by the pseudocode in Figure 1, and is elaborated in greater detail in [20].
Figure 1. The pseudocode of the pre-processing
The proposed method proceeds in the following stages:
1) Problem domain transformation from student-exam to exam conflict and spread matrix data space (Figure 1)
2) Generation of a feasible solution (Figure 2)
3) Minimization of the overall slots conflicts (Figure 3)
4) Minimization of the schedule cost by slot swapping (Figure 5)
5) Minimization of the schedule cost by exam reallocation (Figure 7)
6) Repetition of stages 4 and 5 until there is no improvement in the schedule cost.
During the problem domain transformation (as in stage 1 above), initial allocation of exams to slots was done, i.e. grouping exams that are not conflicting in a group. This is based on the principle of an early allocation of exams with the highest number of conflicts to the available time slots. During this process, the number of conflicts of exams, which have not been scheduled yet, is recalculated to reflect the latest updated status of exams. Any unused slots are removed and provide a buffer-space for subsequent optimization. The output is an allocation flag, exam-to-slot vector which contains the slot number for all exams. At this point, the number of slots could be determined by the maximum value in the allocation flag.
Generation of a feasible solution is done by allocating a group of exams to timetable slots which are verified by calling a verification procedure. The process continues by calling the splitandmerge procedure to reallocate exams. By splitting a slot p and reassigning constituent exams, the total number of slots may be reduced if every exam in slot p can be allocated to some other slot, i.e. not in conflict with exams in other slots. We then perform backtracking to further reduce the number of slots if any reduction is possible. The process is illustrated by the pseudocode in Figure 2.
[image:4.612.195.405.511.634.2]In this work, we develop optimization methods (see Section 2) to improve the initial feasible scheduled generated by the allocation method in Figure 2.
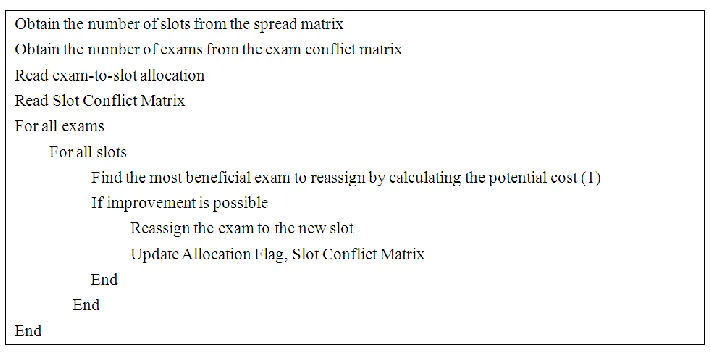
Figure 3. The pseudocode for minimizing total slots conflicts
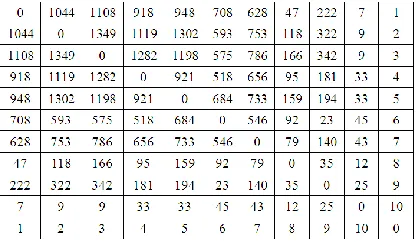
Figure 4. An example of a spread matrix For each exam i in the problem
Obtain the slot number (where it is allocated) from the allocation flag
Find the sum of the total slots conflicts, and set it as the lowest total slots conflicts For each slot (except the slot for exam i)
Calculate the new total slots conflicts by reassigning exam i into a new slot If the new total slots conflicts is lower than the lowest total slots conflicts
Set the new total slots conflicts as the lowest total slots conflicts End
Reassign exam i to the slot that produced the lowest total slots conflicts End
Figure 5. The pseudocode for the block and slot permutations
Figure 6. Illustrations of spread matrix after permutations of slots are done
Figure 7. The pseudocode for the reassignments of exams
2 Optimization Methods
[image:5.612.133.488.404.580.2]The standard objective of exam scheduling is to minimize the cumulative inconvenience implied by the proximity of consecutive exams taken by individual students. This is measured by the cost function originally proposed in [12] as follows:
1
1 1
| pi pj |
1
Ni N
i j
ij
w
s
T
(1)where N is the number of exams, sij is the number of students enrolled in both exams i and j, pj is the time slot where exam j is scheduled, pi is the time slot where exam i is scheduled and T is the total number of students. Based on this cost
function, a student taking two exams that are | pj - pi | slots apart, where | pj - pi | ={1, 2, 3, 4, 5}, leads to a cost of 16, 8, 4,
2, and 1, respectively.
The lower the cost obtained, the higher is the quality of the schedule, since the gap between two consecutive exams allows students to have extra revision time.
2.1 Minimization of total slots conflicts
The notion of a slot conflict is a generalization of the notion of exam conflict. We consider two exams i and j as being “in conflict” if there is a student that takes both exams. In a feasible schedule such exams are allocated to different exam slots. It is worth noting here that the conflict between exams is a binary property that does not increase in value if there are several students taking these two exams. Consequently, once we establish which exams are in conflict we do not need to be distracted, in the exam scheduling process, by the detailed student-exam data. This domain-transformation approach, motivated by the granular information processing paradigm [6], provides a key advantage of the proposed exam scheduling. Taking an even a broader view on the exam conflict, a novel contribution of this study is the consideration of the exam-slot conflict. Since every exam that is in conflict with the exam i is allocated to some slot in the initial feasible solution, we can count the slots that contain conflicting exams. The exam-slot conflict is a binary property that does not increase in value if exam i has several conflicting exams in one slot. Consequently, if all the exams conflicting with exam i are allocated to the same slot, the exam-slot conflict for exam i will be the lowest (equal to 1). On the other hand, if the conflicting exams are allocated to different slots, the exam-slot conflict for exam i will be correspondingly higher (equal to the number of slots containing conflicting exams).
In order to guide our exam schedule optimization process, we use the total count of exam-slot conflicts as a measure of the ability to re-schedule exams between the slots. If the total count is high, it means that, on average, exams are in conflict with many slots and consequently there are few slots available for rescheduling. Conversely, if the total count is low, on average, there are more slots that can be used for re-scheduling of exams. To the best of our knowledge, the potential for rescheduling of exams has not been quantified in the literature so far despite it being a key factor enabling the improvement of the initial feasible schedule.
Recognizing the rationale for the maximization of the ability to reschedule individual exams between different slots, we start our optimization process by minimizing the total exam-slot conflict.
By minimizing the total slots conflicts it is usually possible to reduce the cost of the exam schedule, as illustrated in Figure 9. However, we consider this stage primarily as the enhancement of the potential for the subsequent minimization of the cost of the schedule.
Nevertheless it is worth observing that although the cost formula (1) counts the spread of exams from the viewpoint of individual students, it is an integrative measure that is concerned with the average inter-exam spread. By reducing the total exam-slot conflict we achieve a greater packing of conflicting exams and, by implication, an increased possibility of separating the slots that have the largest number of conflicting exams.
2.2 Minimization of cost by permutations of exams slots
The second stage of the optimization is explicitly focused on the minimization of the cost function (1). The preparatory work of preparing the exam spread data structure, coupled with the maximization of the possibility of re-positioning (re-labeling) exam slots, brings dividends in terms of having a much smaller slot-optimization problem to consider while capturing the essence of the overall exam scheduling problem. Since the number of available exam slots is typically quite small, the optimization of the position of individual slots can be accomplished by the permutation of rows/columns of the spread matrix and the evaluation of the resulting cost (1).
Figure 4 presents an example of a spread matrix. The cost function (1) assigns a weight “16” to exams that are 1 slot apart (entries in the spread matrix (1,2), (2,3), (3,4), etc.) and assigns a weight “8” to the exam of 2 slots apart (entries in the spread matrix (1,3), (2,4), (3,5), etc.), and so on. To put it in a slightly more formal way, the weight “16” in the cost function is associated with the “first minor diagonal” entries of the spread matrix; weight “8” is associated with the “second minor diagonal” entries, etc. Assuming that the total number of students is 2749, the cost function (1) evaluates to:
[[(1044 + 1349 + 1282 + 921 + 684 + 546 + 79 + 35 + 25) * 16] +
[(1108 + 1119 + 1198 + 518 + 733 + 92 + 140 + 12)* 8] +
[(918 + 1302 + 575 + 656 + 159 + 23 + 43) * 4] +
[(948 + 593 + 786 + 95 + 194 + 45) * 2] +
[(708 + 753 + 166 + 181 + 33) * 1] ] / 2749
= 56.99
The potential for the reduction of this cost lies in the possibility of re-ordering the slots so as to replace the big numbers in first minor diagonal with the smaller entries that on subsequent minor diagonals.
The reordering of slots has been implemented as a simple greedy optimization process that involved swapping of the position of individual slots and also swapping of the position of groups of adjacent slots. If a swap operation improved the cost function (1) the swap was accepted and the exam slots were rearranged accordingly. Recognizing however that the greedy optimization may lead to local optima we have adopted a simple measure of restarting the optimization from several initial orderings of exam slots and picking the best solution from a pre-defined number of runs.
It is worth pointing out that while the optimization by permutation of slots does benefit from the prior minimization of the exam-slot conflict it does not affect the total count of the exam-slot conflict because the allocation of individual exams to slots does not change.
[[(575 + 23 + 194 + 33 + 33 + 95 + 47 + 628 + 753 ) * 16] +
[(342 + 684 + 25 + 921 + 12 + 918 + 79 + 1044)* 8] +
[(1198 + 45 + 181 + 159 + 7 + 656 + 118) * 4] +
[(9 + 518 + 35 + 948 + 43 + 1119) * 2] +
[(1282 + 92 + 222 + 733 + 9) * 1] ] / 2749
= 31.81
2.3 Minimization of cost by reassignments of exams between slots
In the third stage of the optimization, exams that make large contribution to the first minor diagonal entries of the reordered spread matrix are reassigned to slots represented by higher minor diagonals (preferably of order 6 or higher). Shifting an exam from one slot to another has a chain effect. Changes not only happen at the spread matrix level but also happen in the slot conflict matrix. Alteration of exam slots to reduce the cost function value could further reduce the overall conflict count or increase the value for the current solution. This is because the insertion of an exam to a slot can only happen if the slot contains exclusively exams that do not conflict with it. This action forces us to reevaluate the slot conflict count, which changes based on the slot location of all exams that is within the same chain as the shifted exam. The bigger the chain of the exam the bigger effect it will have to the conflict count. There are two methods of reassignment, single reassignments and group reassignments.
The single reassignments optimization move throughout the search space to identify an exam that has the biggest reduction to the cost function (1) if it were to be moved to other slots. The algorithm looks for a conflict-free slot which leads to the biggest cost reduction for all exams. The process of identifying the possible slots and calculating the cost function contribution is made simple by a data structure that combines the slot location and the penalty values generated by each exam for a slot.
The group reassignments optimization moves throughout the search space to identify an exam which could lead to the biggest reduction to the cost function. The optimization process evaluates the reduction from moving an exam to all other slots, and the best combination or total reduction configuration will be selected as the move that will be executed.
During the process of optimization the generated possible moves are evaluated against a history of moves two steps behind. The purpose of this is to eliminate possible cyclic moves in the optimization process. The group reassignments move exams to another slot if a reduction can be obtained. This may push other exam(s) out of the selected slot to alternative slots. There is a possibility that these exams switch slots and keeps on giving an improvement to the Carter cost thus keeping the optimization process ongoing. This will not stop if these two exams keep on exchanging slots. This kind of moves must be identified to eliminate infinite swapping. The process continues until there is no more improvements available and the number of iterations is more than half of the number of exams.
Both the single and group reassignments start by evaluating each exam one at a time and look for possible slot locations that could accept the exam without any clashes. The main difference is that the evaluation criteria to shift and the number of exams for every shift. The single reassignment will end up with solutions within the local optima due to the minor changes made to the initial placement of exams.
The pseudocode for the reassignment process is outlined in Figure 7.
3 Experiments, Results and Discussions
The study was performed on all 13 datasets in the Toronto benchmark repository [ftp://ftp.mie.utoronto.ca/pub/ carter/testprob] and also on the Nottingham dataset [http://www.cs.nott.ac.uk/~rxq/files/Nott.zip] that, for the sake of comparability with other studies, is considered here as an uncapacitated scheduling problem, where the total room capacity in each slot is not considered.
According to [19], to indicate the density of the conflicting exams in each of the instances, a Conflict Matrix C is defined where each element cij = 1 if exam i conflicts with exam j (have common students), or cij = 0 otherwise. The Conflict
Density represents the ratio between the number of elements of value “1” to the total number of elements in the conflict matrix.
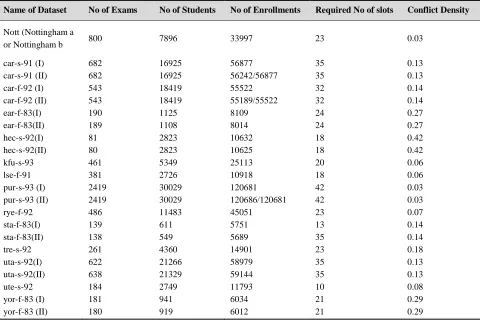
[image:9.612.73.553.318.639.2]The characteristics of all the datasets are listed in Table 1. For the Toronto dataset, according to [19], 8 out of 13 problem instances exist in 2 versions. We will use version I of the datasets which are widely tested by other researchers.
Table 1. Benchmark Datasets Used in the Timetabling Research
Name of Dataset No of Exams No of Students No of Enrollments Required No of slots Conflict Density
Nott (Nottingham a
or Nottingham b 800 7896 33997 23 0.03
car-s-91 (I) 682 16925 56877 35 0.13
car-s-91 (II) 682 16925 56242/56877 35 0.13
car-f-92 (I) 543 18419 55522 32 0.14
car-f-92 (II) 543 18419 55189/55522 32 0.14
ear-f-83(I) 190 1125 8109 24 0.27
ear-f-83(II) 189 1108 8014 24 0.27
hec-s-92(I) 81 2823 10632 18 0.42
hec-s-92(II) 80 2823 10625 18 0.42
kfu-s-93 461 5349 25113 20 0.06
lse-f-91 381 2726 10918 18 0.06
pur-s-93 (I) 2419 30029 120681 42 0.03
pur-s-93 (II) 2419 30029 120686/120681 42 0.03
rye-f-92 486 11483 45051 23 0.07
sta-f-83(I) 139 611 5751 13 0.14
sta-f-83(II) 138 549 5689 35 0.14
tre-s-92 261 4360 14901 23 0.18
uta-s-92(I) 622 21266 58979 35 0.13
uta-s-92(II) 638 21329 59144 35 0.13
ute-s-92 184 2749 11793 10 0.08
yor-f-83 (I) 181 941 6034 21 0.29
yor-f-83 (II) 180 919 6012 21 0.29
Accepting that the Permutations of Exams Slots based on the greedy optimization may lead to local optima, we have investigated the sensitivity of this optimization to the number of starting points so as to ensure sufficient exploration of the search space and promote the convergence to the global optimum. However, no claim is made about the exhaustive exploration of the search space and instead we offer the plots of the convergence trajectories in the “exam conflict – schedule cost” space as an indication of the robust performance of the proposed method.
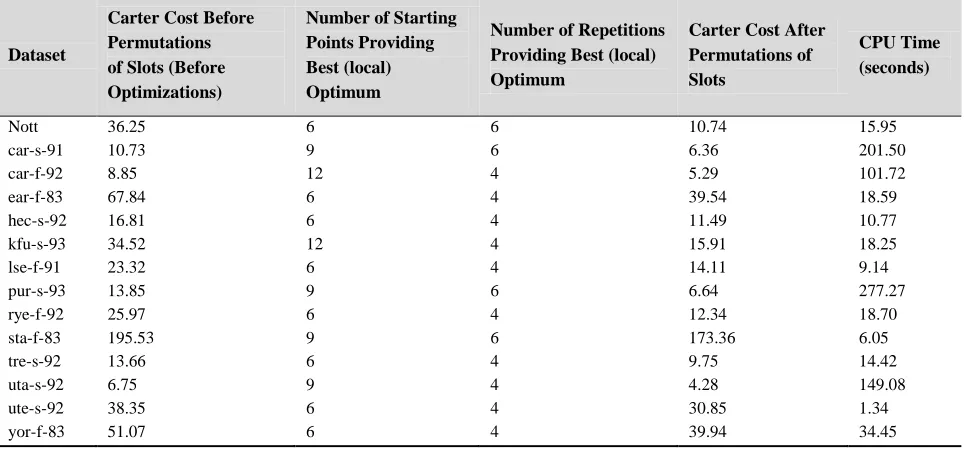
3.1 Different parameters for permutations of slots
[image:10.612.58.541.254.479.2]We have tested different combinations of parameters in order to find the ideal or sufficient combinations that would lead to local optima. We have used 6, 9 and 12 starting points; and performed experiments for 4, 8, 10 and 12 iterations. All combinations were tested and the results for all datasets are recorded in Table 2.
Table 2. Optimized number of starting points and repetitions of the permutations of exam slots for different benchmark problems
Dataset
Carter Cost Before Permutations of Slots (Before Optimizations)
Number of Starting Points Providing Best (local) Optimum
Number of Repetitions Providing Best (local) Optimum
Carter Cost After Permutations of Slots
CPU Time (seconds)
Nott 36.25 6 6 10.74 15.95 car-s-91 10.73 9 6 6.36 201.50 car-f-92 8.85 12 4 5.29 101.72 ear-f-83 67.84 6 4 39.54 18.59 hec-s-92 16.81 6 4 11.49 10.77 kfu-s-93 34.52 12 4 15.91 18.25 lse-f-91 23.32 6 4 14.11 9.14 pur-s-93 13.85 9 6 6.64 277.27 rye-f-92 25.97 6 4 12.34 18.70 sta-f-83 195.53 9 6 173.36 6.05 tre-s-92 13.66 6 4 9.75 14.42 uta-s-92 6.75 9 4 4.28 149.08 ute-s-92 38.35 6 4 30.85 1.34 yor-f-83 51.07 6 4 39.94 34.45
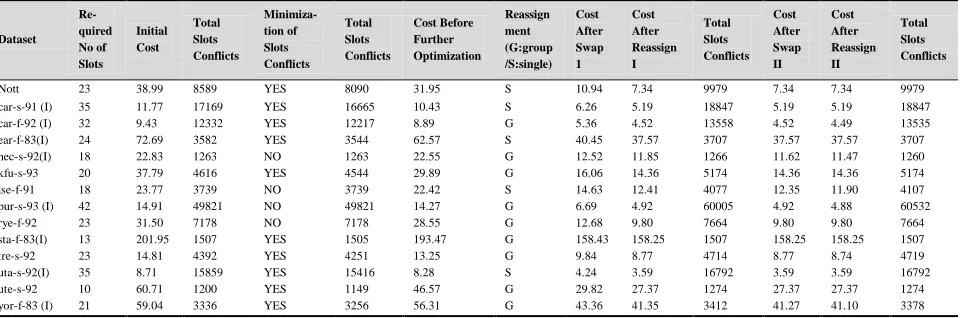
3.2 The final results and discussions
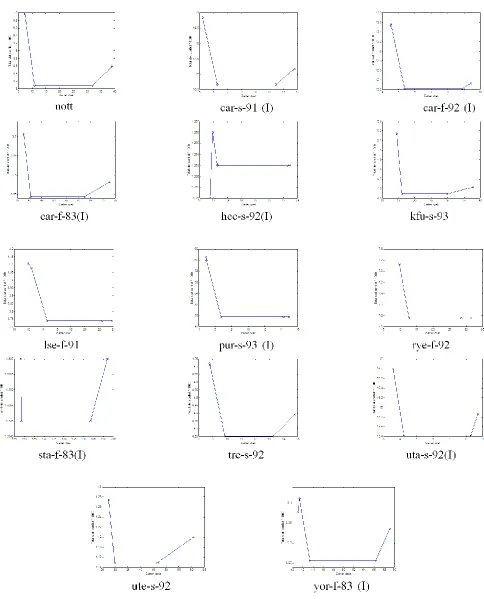
[image:11.612.72.552.157.316.2]The final results for all the datasets utilizing 24 number of starting points and 6 iterations are therefore presented in Table 3. Using the data gathered from the experiments on all the datasets, we have plotted graphs for the cost (1) versus the Total Slots Conflicts in Figure 8.
Table 3. Computational Results of the Proposed Approach Applied to the Toronto Dataset
Dataset Re- quired No of Slots Initial Cost Total Slots Conflicts Minimiza- tion of Slots Conflicts Total Slots Conflicts Cost Before Further Optimization Reassign ment (G:group /S:single) Cost After Swap 1 Cost After Reassign I Total Slots Conflicts Cost After Swap II Cost After Reassign II Total Slots Conflicts
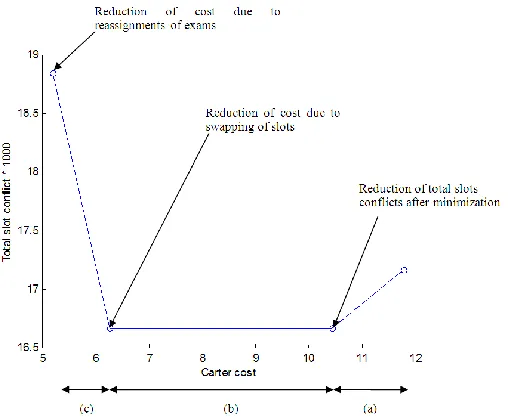
Figure 9. The Predicted Pattern of the Graph with the Proposed Approach
We can observe that the general pattern of the lines (graphs) consists of 3 stages, we name them as section (a), (b) and (c) from right to left, as illustrated in Figure 9. Decrease of the total slots conflicts in section (a) is typically (but not necessarily) coupled with the decrease of the exam schedule cost. In the second stage, in section (b), the exam schedule cost is reduced without any augmentation of the total slots conflicts. The third stage, represented in section (c) involves reassignment of exams that reduces the exam schedule cost but increase the total slots conflicts. Please note however that for some datasets (hec-s-92(I), lse-f-91, pur-s-93(I) and rye-f-92), only section (b) and (c) can be seen in the graph because they managed to record the best results even without running the minimization of the slots conflicts procedure.
In order to obtain better schedules with lower cost, we have performed the permutations of exam slots and the reassignment of exams between slots.
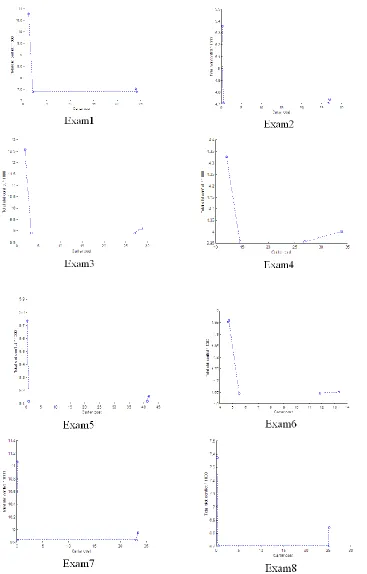
In order to test the flexibility and ensure that our approach can work well on other datasets, we have further tested the methods on the International Timetabling Competition 2007 (ITC2007) dataset that can be obtained from [http://www.cs. qub.ac.uk/itc2007/Login/SecretPage.php]. The ITC2007 dataset contains additional constraints including room capacities, period utilization, period related and room related in the objective function. Table 4 presents some important characteristics of the ITC2007 benchmark dataset. The results obtained for all exams in this dataset can be seen in Table 5. The cost (1) vs. the Total Slots Conflicts is plotted in Figure 10.
Table 4. The characteristics of the ITC2007 dataset
Name of Dataset No of Exams No of Students Required No of Slots Conflict Density
Exam1 607 7891 54 5.05
Exam2 870 12743 40 1.17
Exam3 934 16439 36 2.62
Exam4 273 5045 21 15.0
Exam5 1018 9253 42 0.87
Exam6 242 7909 16 6.16
Exam7 1096 14676 80 1.93
Exam8 598 7718 80 4.55
[image:13.612.73.558.581.695.2]10.94 has been obtained after the permutations of exams slots on the initial schedule. The cost was further improved to 7.34 after the reassignments of exams.
[image:14.612.56.543.234.348.2]For the ITC2007 dataset, results reported in Table 5 also show significant reductions of the exam schedule cost compared to the cost of the original feasible schedule. For example, the cost of the exam schedule evaluated for the benchmark problem Exam8 in the ITC2007 dataset was reduced from 25.15 to 0.32 by permutation of exam slots and was further improved to 0.14 by reassignments of exams. It is worth noting that for this benchmark problem a second round of slot swapping and exam reassignment resulted in further improvement of cost from 0.14 to 0.13. However, for most benchmark problems a single round of optimization was sufficient to achieve a competitive exam schedule that could not be improved in the second round.
Table 5. Computational Results of the proposed Approach Applied to the ITC2007 Dataset
Dataset Re- quired No of Slots Un- optimized Cost Total Slots Conflicts Minimiza- tion Of Slots Conflicts Total Slots Conflicts Cost Before Further Optimi- zation Re- assign- ment (G:group /S:single) Cost After Swap 1 Cost After Reassign I Total Slots Conflicts Cost After Swap II Cost After Reassign II Total Slots Conflicts
Exam1 54 23.90 7522 YES 7414 23.49 G 2.02 1.12 10787 1.12 1.12 10787 Exam2 40 26.92 4740 YES 4709 26.92 G 0.48 0.22 5359 0.22 0.22 5359 Exam3 36 28.53 9114 YES 8928 28.53 G 3.35 1.84 12584 1.84 1.84 12584 Exam4 21 33.84 4001 YES 3958 28.49 G 14.62 12.06 4326 12.06 12.06 4326 Exam5 42 41.79 5156 YES 5118 41.79 G 0.83 0.37 5736 0.37 0.37 5736 Exam6 16 13.32 1652 YES 1647 13.32 G 5.50 4.70 1960 4.69 4.61 1954 Exam7 80 23.38 9949 YES 9839 23.55 G 0.16 0.07 11066 0.07 0.07 11066 Exam8 80 25.15 6843 YES 6706 25.15 G 0.32 0.14 7374 0.13 0.13 7374
An important feature of the proposed optimization is its deterministic pattern that is preserved for all the datasets. The minimization of the total slots conflicts has proven to be a useful preparatory step for the subsequent minimization of the cost of the exam schedule. By minimizing the slots conflicts we have achieved the greatest “packing” of conflicting exams and, by doing so, have enhanced the possibility of reduction of the schedule cost in subsequent steps. It is worth noting that this is beneficial even if, in some rare circumstances (see Exam7 in the ITC2007 dataset, Table 5; cost increase from 23.38 to 23.55) the reduction of the total slots conflicts comes at the expense of some increase of the schedule cost. This enhanced potential for subsequent reduction of the schedule cost is fully capitalized on in the subsequent step of permutation of exam slots; with the cost reduction to 0.07.
The permutation of exams slots is a very simple approach and yet it typically produces a very significant reduction of the cost (1) of the initial exam schedule. By splitting the exam scheduling problem into three sub-problems of minimization of slots conflicts, minimization of cost by slot swapping and minimization of cost by reassignments we have achieved a clear deterministic progression of the optimization process that lends itself to easy interpretation.
The reassignments of exams also never fail to reduce the cost (1). Looking into details, group reassignments outperformed single reassignments in most of the datasets. The effect of these reassignments can be seen from the third data point to the fourth data point in each line in the graphs given. There is a very clear pattern, whereby for each line, the graph is going up in a diagonal to the left. This means that the exam schedule generated at this stage has a lower cost but from an increase of the overall total slots conflicts.
Figure 10. Cost (1) vs. the Total Slots Conflicts for ITC2007 Dataset
positive correlation between the cost and the slots conflicts count (as is endorsed by the experiences of other researchers using max-degree pre-ordering of exams in their scheduling heuristics), it is clear that this correlation represents a potential for the reduction of cost by swapping of the slots. At the final stages of our optimization this potential is not relevant as the slots are deemed to have been optimally ordered already. In the rare circumstances where the reassignment of exams creates an opportunity for further cost reduction by swapping the exam slots, a second round of optimization delivers the expected improvement of the exam schedule.
Table 6. Results of Our Method in Comparison with Some Other Constructive Methods in Literature (highlighted columns are for the methods that delivered results for all instances in the Toronto dataset)
Dataset [12] [9] [18] [3] [21] [11] [22] [23] Ours
car-s-91 (I) 7.1 4.97 5.45 5.29 5.08 5.03 5.17 5.12 5.19 car-f-92 (I) 6.2 4.32 4.5 4.54 4.38 4.22 4.74 4.41 4.49 ear-f-83(I) 36.4 36.16 36.15 37.02 38.44 36.06 40.91 36.91 37.57 hec-s-92(I) 10.8 11.61 11.38 11.78 11.61 11.71 12.26 11.31 11.47 kfu-s-93 14 15.02 14.74 15.8 14.67 16.02 15.85 14.75 14.36 lse-f-91 10.5 10.96 10.85 12.09 11.69 11.15 12.58 11.41 11.9 pur-s-93
(I) 3.9 - - - 5.87 5.87 4.88
[image:16.612.58.541.192.386.2]rye-f-92 7.3 - - 10.38 9.49 9.42 10.11 9.61 9.8 sta-f-83(I) 161.5 161.9 157.21 160.4 157.72 158.86 158.12 157.52 158.25 tre-s-92 9.6 8.38 8.79 8.67 8.78 8.37 9.3 8.76 8.74 uta-s-92(I) 3.5 3.36 3.55 3.57 3.55 3.37 3.65 3.54 3.59 ute-s-92 25.8 27.41 26.68 28.07 26.63 27.99 27.71 26.25 27.37 yor-f-83 (I) 41.7 40.88 42.2 39.8 40.45 39.53 43.98 39.67 41.1
Table 7. Average Percentage Distance to the Optimal Cost
Dataset
[12] [22] [23] Our Proposed
Method
Best
Constructive Cost
Cost % Cost % Cost % Cost %
car-s-91 (I) 7.10 42.86 5.17 4.02 5.12 3.02 5.19 4.43 4.97 car-f-92 (I) 6.20 46.92 4.74 12.32 4.41 4.50 4.49 6.40 4.22 ear-f-83(I) 36.40 0.94 40.91 13.45 36.91 2.36 37.57 4.19 36.06 hec-s-92(I) 10.80 0.00 12.26 13.52 11.31 4.72 11.47 6.20 10.80 kfu-s-93 14.00 0.00 15.85 13.21 14.75 5.36 14.36 2.57 14.00 lse-f-91 10.50 0.00 12.58 19.81 11.41 8.67 11.90 13.33 10.50 pur-s-93 (I) 3.90 0.00 5.87 50.51 5.87 50.51 4.88 25.13 3.90 rye-f-92 7.30 0.00 10.11 38.49 9.61 31.64 9.80 34.25 7.30 sta-f-83(I) 161.50 2.73 158.12 0.58 157.52 0.20 158.25 0.66 157.21 tre-s-92 9.60 14.70 9.30 11.11 8.76 4.66 8.74 4.42 8.37 uta-s-92(I) 3.50 4.17 3.65 8.63 3.54 5.36 3.59 6.85 3.36 ute-s-92 25.80 0.00 27.71 7.40 26.25 1.74 27.37 6.09 25.80 yor-f-83 (I) 41.70 5.49 43.98 11.26 39.67 0.35 41.10 3.97 39.53 Average Percentage
Difference To Best Constructive cost (%)
mean = 9.06 std = 16.44
mean = 15.72 std = 13.84
mean = 9.47 std = 14.72
[image:16.612.58.545.420.681.2]problems and less well on others. This is a rather unwelcome characteristic from the user’s perspective, as there is no way of predicting the quality of the solution that will be obtained using a particular method on a new dataset. In this context a mean percentage discrepancy between the solution delivered by a given method and the best solution reported in the literature together with the standard deviation of such discrepancies, evaluated on a representative set of benchmark problems, provide a measure of reliability of the exam scheduling method. In particular, small value of the standard deviation indicates that the method is delivering consistently good results. Table 7 shows that our proposed method is very competitive with the mean percentage discrepancy of 9.11% between its solutions and the best known ones, and is by far the most consistently reliable, as indicated by the standard deviation 9.77 of these discrepancies.
One important point to note when comparing the performance of the various methods is that that several of the best results have been obtained by the methods that did not report any results for pur-f-93 and/or rye-f-92. This is significant because it highlights both the quality, consistency and the universal applicability of our method.
4 Conclusions and Future Work
The proposed optimization approach is very simple yet very competitive in generating reliably high quality exam schedules. We also believe that the domain transformation approach that facilitated transformation of a complex optimization problem into a sequence of more tractable optimizations has a potential for successful applications in a broader spectrum of problems. An important feature of our optimization method is that it preserves the feasibility of the initial solution throughout the whole of the optimization thus saving a considerable computational effort compared to other methods that require customized post-processing.
The proposed method is also very reliable and stable in producing schedules on larger problem instances, for instance pur-s-93 in the Toronto dataset and Exam7 in the ITC2007 dataset.
We expect that the proposed method can be adapted in a relatively straightforward manner to the capacitated scheduling problem by introducing appropriate granular data structures that will permit the requited domain transformation in the optimization process. Also, other constraints suggested at the 2nd International Timetabling Competition in 2007-08 should fit into the general framework of the proposed method.
References
[1] Argile A., Peytchev E., Bargiela A., Kosonen I., DIME: A Shared Memory Environment for Distributed Simulation, Monitoring and Control of Urban Traffic, Proceedings of European Simulation Symposium ESS'96, Geno. 1996; 152-156.
[2] Asmuni H., Burke, E. K., Garibaldi J. M., and McCollum B. Fuzzy Multiple Heuristic Orderings for Examination Timetabling. In E. K. Burke and M. Trick, editors, volume 3616 of Lecture Notes in Computer Science. Berlin, Springer. 2005; 334-353. [3] Asmuni H, Burke E. K., Garibaldi J. M., McCollum B. and Parkes A. J. An investigation of fuzzy multiple heuristic orderings in
the construction of university examination timetables. Comput. Oper. Res. 2009; 36: 981-1001. http://dx.doi.org/10.1016/j.cor.2007.12.007
[4] Bargiela A., An algorithm for observability determination in water-system state estimation, IEE Proceedings Part D, 132. 1985; 245-249.
[5] Bargiela A., Pedrycz W., Hirota K., Granular prototyping in fuzzy clustering, IEEE Transactions on Fuzzy Systems. 2004; 12(5): 697-709. http://dx.doi.org/10.1109/TFUZZ.2004.834808
[6] Bargiela, A., and Pedrycz, W. Granular Computing – An Introduction, Kluwer Academic Publishers. 2002. http://dx.doi.org/10.1007/978-1-4615-1033-8
[7] Bargiela, A. and Pedrycz, W. Toward a theory of Granular Computing for human-centred information processing, IEEE Trans. on Fuzzy Systems. 2008; 16(2): 320-330. http://dx.doi.org/10.1109/TFUZZ.2007.905912
[9] Burke E.K. and J. P. Newall. Solving examination timetabling problems through adaptation of heuristics orderings. Ann. Oper. Res. 2004; 129: 107-134. http://dx.doi.org/10.1023/B:ANOR.0000030684.30824.08
[10] Burke E.K., A. Meisels, S. Petrovic and R. Qu. A graph-based hyperheuristic for educational timetabling problem. European J. Oper. Res. 2007; 176: 177-192. 2007. http://dx.doi.org/10.1016/j.ejor.2005.08.012
[11] Burke E.K., Pham N, Qu R, Yellen J. Linear Combinations of Heuristics for Examination Timetabling. Annals of Operations Research. 2010. http://dx.doi.org/10.1007/s10479-011-0854-y
[12] Carter M., Laporte G. and Lee S. Examination Timetabling: Algorithmic Strategies and Applications. Journal of Operations Research Society. 1996; 47: 373-383.
[13] Carter M. and Laporte G. Recent developments in practical examination timetabling. Lecture Notes in Comput. Sci. 1995; 1153:1-21.
[14] Dowsland K.A. and Thompson J. Ant colony optimization for the examination scheduling problem. Journal of Operational Research Society. 2005; 56: 426-438. http://dx.doi.org/10.1057/palgrave.jors.2601830
[15] Gueret C., Jussien N., Boizumault P., Prins C. Building University Timetables Using Constraint Logic Programming. First International Conference on the Practice and Theory of Automated Timetabling, PATAT. 1995; 95: 393-408, Edinburgh. 1995.
[16] Pedrycz W, Smith M.H., Bargiela A, Granular signature of data, Proc. 19th Int. (IEEE) Conf. NAFIPS'2000, Atlanta. July 2000; 69-73. http://dx.doi.org/10.1109/NAFIPS.2000.877387
[17] Peytchev E., Bargiela A., Gessing R., A Predictive Macroscopic City Traffic Flows Simulation Model, Proceedings of European Simulation Symposium ESS'96, Genoa, ISBN 1-565555-099-4. October 1996; 2: 38-42.
[18] Qu R, Burke EK. Adaptive decomposition and construction for examination timetabling problems. In: In Multidisciplinary international scheduling: theory and applications (MISTA'07), Paris, France. 2007; 418-425.
[19] Qu. R, Burke E.K., B. McCollum, L.T.G. Merlot, and S. Y. Lee. A Survey of Search Methodologies and Automated System Development for Examination Timetabling. Journal of Scheduling. 2009; 12(1): 55-89.
http://dx.doi.org/10.1007/s10951-008-0077-5
[20] Rahim, S. K. N. A., Bargiela, A., & Qu, R. Granular Modelling Of Exam To Slot Allocation. ECMS 2009 Proceedings edited by J. Otamendi, A. Bargiela, J. L. Montes, L. M. Doncel Pedrera. European Council for Modeling and Simulation. 2009; 861-866. http://dx.doi.org/10.7148/2009-0861-0866
[21] Rahman S.A., Bargiela A, E. K. Burke, B. McCollum, and E. Ozcan. Construction of examination timetables based on ordering heuristics. In Proceedings of the 24th International Symposium on Computer and Information Sciences. 2009; 727-732. http://dx.doi.org/10.1109/ISCIS.2009.5291905
[22] Rahman S.A, S., Burke E.K., Bargiela A., McCollum B., Ozcan E. A Constructive approach to examination timetabling based on adaptive decomposition and ordering, Annals of Operation Research. to appear 2013. http://dx.doi.org/10.1007/s10479-011-0999-8
[23] Rahman S.A, Bargiela A., Burke E.K., Ozcan E., McCollum B. Linear combination of heuristic orderings in construction of examination timetable, European Journal of Operational Research, to appear 2013.
[24] Rao S. S. Engineering Optimization - Theory and Practice (3rd Edition) [Internet]. (pp: 5). John Wiley & Sons. Available from: http://knovel.com/web/portal/browse/display?_EXT_KNOVEL_DISPLAY_bookid=1100&VerticalID=0