IEEA 2012: 17-18 March 2012, Singapore
A simulation-based framework for a mapping tool that
assesses the energy performance of green roofs
Georgios Kokogiannakis
a*, Jo Darkwa
aaCentre for Sustainable Energy Technologies (CSET), The University of ottingham, 199 Taikang East Rd, ingbo, 315100 China
Abstract
This paper presents a framework for the development of a GIS open source mapping tool that aims to disseminate a database with results of detailed simulations in order to assess in a quick and easy way the energy performance of green roof designs across a range of Chinese climates. Detailed simulation results for heating and cooling loads are obtained from the EnergyPlus simulation tool. The study covers 12264 configurations by varying model parameters such as climate, glazing type, roof insulation, soil and plant characteristics, etc. It was found that green roofs can offer significant energy savings if they are applied on roofs without insulation but only limited energy savings where heavy insulation on the roof is also applied. Quick comparisons across a large range of roof characteristics could be easily made with the implementation of the GIS map tool and the design of green roof that fits the specific climate could be optimised without the knowledge of a detailed building energy simulation tool. The critical parameters that affect the green roof’s performance are also highlighted.
Keywords: green roofs; detailed modelling; mapping database
1.Introduction
The role of green roofs on limiting the Urban Heat Island effect has been discussed by several
researchers in the past, e.g. [1-2]. Green roofs have also been considered as a type of construction that
could act as a thermal buffer for buildings. Research in the past (e.g. [3-4]) has shown that green roofs
can reduce the heating and cooling loads of buildings but a consensus has not been reached on the
specific characteristics of green roofs (e.g. types of soil, plant, etc.) that best fit the specific building’s
climate. The issue becomes more important in China, where the climate and the construction standards
are significantly diverge across the country and large dense cities consume high amounts of energy and
are experiencing the Urban Heat Island in summer.
A way for communicating detailed green roof simulation results should be available to the
practitioners and policy makers in order to develop a consensus on the energy and comfort benefits
associated with the different types of green roofs across the various Chinese climates. The modelling of
green roofs for the build environment involves complex coupling of heat and moisture balances and it is
not a simple task for practitioners and policy makers. A current advanced implementation of a green roof
model is available in the EnergyPlus program ([5] and [6)) and this model is used as the base for the
detailed simulations of this study. This paper will describe the framework for the initial development of a
tool in which a large number of detailed green roof simulation results are embedded into a database and
are communicated interactively via open source web GIS maps. The purpose of the tool is to facilitate
practitioners and policy makers in deciding the optimum green roof configuration that offers the highest
reduction of heating and cooling loads for the specific climate and the specific construction type.
2.Methodology
2.1.The basic structure of the green roof GIS web tool
The simulation green roof results can be delivered via interactive maps by using the open source
MapServer platform [7], which is often used to publish spatial data and interactive mapping applications
on the web. MapServer requires a web server such as Apache to be installed. MapServer uses Mapscript
as an interface to allow access to MapServer’s functionality from a variety of scripting languages (e.g.
Python, Perl, Ruby, PHP etc.). PHP is used for this green roof tool in order to access the detailed
simulation data from a MySQL database. Vector and raster map layers for China and Chinese cities are
available free of charge from the web and they could be incorporated in the MapServer files of the tool.
However, work needs to be done in the development inside this framework of detailed map layers for
buildings down at neighbourhood level. In this paper, only a representative building is simulated. The
details of the green roof simulations will be given at the next section.
Policy makers, practitioners and building owners could be able to firstly access the map of China on
the web and then click on large cities. The map layer of the specific city is then activated and displayed on
which the users could focus on the available simulated buildings. In future developments of the tool the
user will be able to zoom at a specific existing building of the city and assess the effect that different
green roof configurations may have on the reduction of heating and cooling loads. This paper includes a
residential building type for which several cases of green roof installations have been assessed.
Once the building is selected, the SQL database with the simulation results from EnergyPlus could be
called and presented to the user who could make specific comparisons for the performance of the building
with the different types of green roofs. The results are presented to the users without having to know how
to use the simulation program or how to define queries for the sql database. Any whole building energy
simulation program could be incorporated in this structure for expanding the MySQL database.
EnergyPlus produces CSV files for each simulation of this study and post-processing with macros in
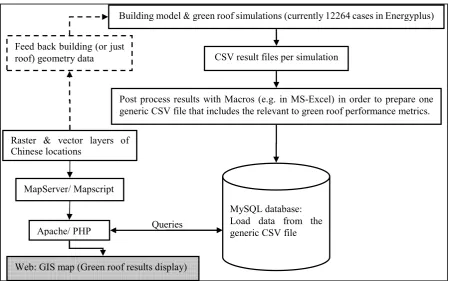
The steps involved in the development of the green roof GIS web map are summarised in Fig. 1. The
dotted line with the step of using vector and raster layer data to automatically feed back the geometrical
[image:3.595.78.528.96.377.2]data needed in the energy simulation program is the most challenging part of the implementation.
Fig. 1. Steps involved in the development of the green roof GIS map
2.2.Detailed simulations of green roofs
The green roof component in EnergyPlus is integrated with the rest of the building model and detailed
complex heat and moisture exchanges are considered in the soil and foliage layers. A description of the
mathematical model is given in the literature [5]. A typical building of a Chinese apartment was prepared
in the software. A total of 12264 building configurations were modelled in order to cover all the cases
described in Table 1 and develop the MySQL green roof application database. All cases were studied with
and without the green roof. A drainage layer of 100 mm was also included below the soil of the green
roof cases. The analysis was done at free float conditions, i.e. no heating or cooling system affected the
internal conditions. The following temperature results were extracted and placed in the database as
metrics for the reduction of heating and cooling loads:
• Peak indoor air temperature for the cooling cases and minimum indoor temperature for the heating
cases in order to assess the potential reduction on peak cooling and heating loads respectively.
Building model & green roof simulations (currently 12264 cases in Energyplus)
CSV result files per simulation
Post process results with Macros (e.g. in MS-Excel) in order to prepare one generic CSV file that includes the relevant to green roof performance metrics.
MySQL database: Load data from the generic CSV file Apache/ PHP
Raster & vector layers of Chinese locations
MapServer/ Mapscript
Web: GIS map (Green roof results display) Feed back building (or just
roof) geometry data
• Peak inside face roof surface temperature for the cooling cases and minimum inside face roof surface
temperature for the heating cases. This metric is useful for assessing the roof structure itself.
• Average indoor air temperature and average inside roof surface temperature for the 3 days of the
simulation period. Average temperatures could prove that a specific roof construction can be beneficial
during a period of time and not only during extreme peak periods.
• For the cooling cases the sum of difference between the indoor air temperature results and the design
temperature of 24oC (SUM(Tair - 24) ) while for the heating cases the sum of difference between the
design temperature of 20oC and the indoor air temperature results (SUM(20 – Tair) ). This will allow
[image:4.595.77.526.215.491.2]comparing the cases for the improvements they may offer across the whole simulation period.
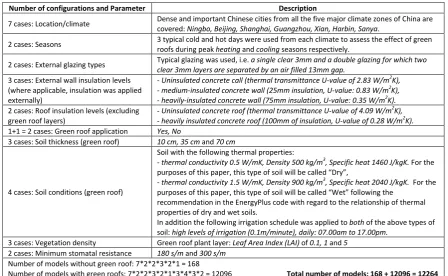
Table 1. Building parameters and green roof configurations that are included in the database
Number of configurations and Parameter Description
7 cases: Location/climate Dense and important Chinese cities from all the five major climate zones of China are covered: Ningbo, Beijing, Shanghai, Guangzhou, Xian, Harbin, Sanya.
2 cases: Seasons 3 typical cold and hot days were used from each climate to assess the effect of green roofs during peak heating and cooling seasons respectively.
2 cases: External glazing types Typical glazing was used, i.e. a single clear 3mm and a double glazing for which two clear 3mm layers are separated by an air filled 13mm gap.
3 cases: External wall insulation levels (where applicable, insulation was applied externally)
- Uninsulated concrete call (thermal transmittance U-value of 2.83 W/m2K), - medium-insulated concrete wall (25mm insulation, U-value: 0.83 W/m2K), - heavily-insulated concrete wall (75mm insulation, U-value: 0.35 W/m2K). 2 cases: Roof insulation levels (excluding
green roof layers)
- Uninsulated concrete roof (thermal transmittance U-value of 4.09 W/m2K), - heavily insulated concrete roof (100mm of insulation, U-value of 0.28 W/m2K). 1+1 = 2 cases: Green roof application Yes, No
3 cases: Soil thickness (green roof) 10 cm, 35 cm and 70 cm
4 cases: Soil conditions (green roof)
Soil with the following thermal properties:
- thermal conductivity 0.5 W/mK, Density 500 kg/m3, Specific heat 1460 J/kgK. For the purposes of this paper, this type of soil will be called “Dry”,
- thermal conductivity 1.5 W/mK, Density 900 kg/m3, Specific heat 2040 J/kgK. For the purposes of this paper, this type of soil will be called “Wet” following the
recommendation in the EnergyPlus code with regard to the relationship of thermal properties of dry and wet soils.
In addition the following irrigation schedule was applied to both of the above types of soil: high levels of irrigation (0.1m/minute), daily: 07.00am to 17.00pm.
3 cases: Vegetation density Green roof plant layer: Leaf Area Index (LAI) of 0.1, 1 and 5 2 cases: Minimum stomatal resistance 180 s/m and 300 s/m
Number of models without green roof: 7*2*2*3*2*1 = 168
3.Discussion of results
Large amount of results were extracted from the simulations and were placed in the database. Users
can access the results by selecting a Chinese location in the map and by easily applying queries for all the
parameters of Table 1. The following can be noticed from the overall range of results in the database:
• Green roofs could significantly reduce thermal loads for buildings that are not heavily insulated, e.g.
peak indoor air temperatures were reduced by about 7oC during the summer in Beijing’s climate.
• For heavily insulated buildings green roofs can offer small energy benefits. It should be noted here that
such heavily insulated buildings (see heavily insulated parameters in Table 1) are not currently
common practice in most places of China and therefore green roofs are still a possible option for future
building upgrades. Policy makers and building developers should consider the associated cost of
upgrading to that degree of insulation against the advantages and the cost of adding a green roof on top
of buildings. From the results obtained it can be seen that specific types of green roofs can have the
same effect or even better as an 100 mm roof insulation layer.
• Irrigation is not a critical parameter for green roofs’ energy performance. Only during the cooling
season irrigation could be slightly beneficial for the uninsulated green roofs that have a thin soil layer
and low vegetation density.
• Cooling loads were not affected by the two types of soils that were studied (in accordance with the
details of Table 1). However, for the uninsulated roof cases the soil that had thermal properties of a
typical “dry” soil resulted to minimum indoor air temperatures during the heating season that were by
about 1 to 1.5oC higher than the “wet” soil cases.
• The thickness of the soil is only an important parameter for the uninsulated roof cases. In such cases,
soils of greater depths (i.e. 70cm) improved indoor air temperatures by about 1oC when comparing
with the same building configurations that use thin soil layers (i.e. 10cm).
• The density of the vegetation can determine the potential reductions of cooling loads for uninsulated
roof cases. Peak indoor air temperatures can be reduced by about 0.5 to 1.0oC during the cooling
season if high LAI plants are used (LAI = 5) instead of the plants with a LAI of e.g. 0.1. The LAI is
not an important factor during the heating season.
• The resistance of the plants to moisture transport and therefore the evapotranspiration rate is dependent
in EnergyPlus by the value of the minimum stomatal resistance and the two options (see Table 1) that
were simulated did not affect the resulted heating and cooling loads.
The users of the proposed for development GIS web map could easily notice all of the above points by
browsing the map and selecting the green roof parameters of their choice. There is no requirement to run
4.Conclusions
A GIS web map tool is proposed to interactively disseminate detailed simulation results for the
performance of green roofs across a range of Chinese climates. The tool aims to provide practitioners and
policy makers with a quick way of determining the potential savings on heating and cooling loads in
buildings that incorporate different types of green roofs. This paper described the framework for such a
tool. Simulations were run and a results database was developed from which it was found that green roofs
can offer maximum energy savings in China if the roof of the building is uninsulated and they could be a
good alternative option to classic thick roof insulation layers. Future work will aim to include additional
existing buildings in the map by translating vector layer data of existing roofs into building simulation
models and to automate the energy simulation process of such buildings.
Acknowledgements
The authors would like to thank Ningbo Science & Technology Bureau for funding the research of this
study as part of a Soft Science project (Grant No. 2011A1051).
References
[1] Alexandri E, Jones P, Temperature decreases in an urban canyon due to green walls and green roofs in diverse climates, Building and Environment, vol 43, pp. 480-493, 2008.
[2] Susca T, Gaffin SR, Dell’Osso GR, Positive effects of vegetation: Urban heat island and green roofs, Environmental Pollution, vol 159, pp. 2119-2126, 2011.
[3] Del Barrio EP, Analysis of the green roofs cooling potential in buildings, Energy and Buildings, vol 27, pp. 179-193, 1998. [4] Niachou A, Papakonstantinou K, Santamouris M, Tsangrassoulis A, Mihalakakou G, Analysis of the green roof thermal properties and investigation of its energy performance, Energy and Buildings, vol 33, pp. 719-729, 2001.