RESEARCH PAPER
Effect of a toggle switch
mutation in TM6 of the
human adenosine A3
receptor on Gi
protein-dependent
signalling and
Gi-independent receptor
internalization
Leigh A Stoddart
1, Barrie Kellam
2, Stephen J Briddon
1and
Stephen J Hill
11Institute of Cell Signalling, School of Life Sciences,The University of Nottingham,Nottingham,
UK, and2School of Pharmacy, Centre for Biomolecular Sciences,University of Nottingham,
Nottingham, UK
Correspondence
Stephen J Hill, School of Life Sciences, University of Nottingham, Medical School, Nottingham NG7 2UH, UK. E-mail:
---Received
14 November 2013 Revised
7 April 2014 Accepted 14 April 2014
BACKGROUND AND PURPOSE
The highly conserved tryptophan (W6.48) in transmembrane domain 6 of GPCRs has been shown to play a central role in forming an active conformation in response to agonist binding. We set out to characterize the effect of this mutation on the efficacy of two agonists at multiple signalling pathways downstream of the adenosine A3receptor.
EXPERIMENTAL APPROACH
Residue W6.48 in the human adenosine A3receptor fused to yellow fluorescent protein was mutated to phenylalanine and expressed in CHO-K1 cells containing a cAMP response element reporter gene. The effects on agonist-mediated receptor internalization were monitored by automated confocal microscopy and image analysis. Further experiments were carried out to investigate agonist-mediated ERK1/2 phosphorylation, inhibition of [3H]-cAMP accumulation andβ-arrestin2 binding.
KEY RESULTS
NECA was able to stimulate agonist-mediated internalization of the W6.48F mutant receptor, while the agonist HEMADO was inactive. Investigation of other downstream signalling pathways indicated that G-protein coupling was impaired for both agonists tested. Mutation of W6.48F therefore resulted in differential effects on agonist efficacy, and introduced signalling pathway bias for HEMADO at the adenosine A3receptor.
CONCLUSIONS AND IMPLICATIONS
Investigation of the pharmacology of the W6.48F mutant of the adenosine A3receptor confirms that this region is important in forming the active conformation of the receptor for stimulating a number of different signalling pathways and that mutations in this residue can lead to changes in agonist efficacy and signalling bias.
British Journal of Pharmacology (2014)1713827–3844 3827 © 2014 The Authors. British Journal of Pharmacology published by John Wiley &
Abbreviations
BiFC, bimolecular fluorescence complementation; CRE-SPAP, cAMP response element-secreted placental alkaline phosphatase; HBSS, HEPES-buffered saline solution; PTx, pertussis toxin; TM, transmembrane; YFP, yellow fluorescent protein
Introduction
GPCR are composed of seven transmembrane (TM) spanning
α-helices and are responsible for translating signals from the extracellular milieu to intracellular responses. It is becoming increasingly clear that not all agonists acting at a given GPCR activate the same intracellular signals; different agonists appear able to bias signalling in favour of a particular down-stream pathway, including those that do not involve hetero-trimeric G-proteins (Azzi et al., 2003; Baker et al., 2003; Whalenet al., 2011). For example, compounds acting at the
β2-adrenoceptor (Bakeret al., 2003; Wisleret al., 2007),
para-thyroid hormone receptor (Gesty-Palmeret al., 2006) or the angiotensin 1A receptor (Weiet al., 2003) have been identi-fied that preferentially activate non-G-protein signalling through theβ-arrestin pathway. Individual residues that may be important in such biased signalling are beginning to be identified. For instance, for the angiotensin II receptor, muta-tion of residues within the DRY motif at the bottom of TM helix 3 can result in the receptor no longer being able to activate G-protein signalling, but which is still internalized effectively in an agonist-dependent manner (Gaboriket al., 2003; Weiet al., 2003).
Within the transmembrane helices there are a number of residues that are highly conserved throughout the GPCR superfamily. One important residue in TM6 is a tryptophan (W6.48, according to the numbering of Ballesteros and Wein-stein) that is located within a conserved CWxP motif, where the presence of the proline residue introduces a kink into the TM helix. Analysis of the purified thermostabilized turkey
β1-adrenoceptor has indicated that a bent conformation of
TM6 is required for the formation of the inactivating ‘ionic lock’ (Moukhametzianovet al., 2011). Movement around this kink is believed to be the basis for forming an active confor-mation of the GPCR that can stimulate intracellular signalling pathways. W6.48 has been proposed to have an important role as part of a rotomer toggle switch formed in association with F6.52, the rearrangement of which has been related to the movement of TM6 upon receptor activation (Shiet al., 2002; Schwartz et al., 2006; Nygaard et al., 2009; Tate and Schertler, 2009) and the formation of aromatic interactions with F5.47 following receptor activation (Nygaard et al., 2009). Residue W6.48 has been mutated in a diverse range of GPCRs, including theβ2-adrenoceptor (Shiet al., 2002; Holst
et al., 2003), the muscarinic M3receptor (Wess et al., 1993),
the bradykinin B2 receptor (Marie et al., 2001), bovine
rho-dopsin (Ridgeet al., 1992), the 5-HT4receptor (Pellissieret al.,
2009) and the ghrelin receptor (Holst et al., 2010) and, although the resulting mutants have a variety of phenotypes, it is clear that this residue is important for the formation of an agonist-induced active receptor conformation.
Activation of many GPCRs can lead toβ-arrestin binding and sequestration of the receptor from the cell surface. The
longstanding view that internalization of a GPCR leads to termination of receptor-mediated signalling has recently been challenged with reports demonstrating that, in addition to the role of β-arrestin in scaffolding activation of ERK (Lefkowitz and Shenoy, 2005), some receptors can still signal to the cAMP pathway even after receptor internalization (Mullershausenet al., 2009; Boutinet al., 2012; Werthmann
et al., 2012). In contrast to its role in G-protein-mediated signalling, the role of the TM6 toggle switch on agonist-mediated receptor internalization has not been widely explored.
The adenosine A3 receptor belongs to a family of four
GPCRs (A1, A2A, A2B and A3) (for receptor nomenclature see
Alexanderet al., 2013; Fredholmet al., 2011) that all respond to adenosine and may have pathophysiological roles in con-ditions, such as cancer, ischaemia, cardiovascular disease and inflammation, making them attractive drug targets. The A3
receptor couples predominantly to Gi/o family G-proteins, causing an inhibition of adenylyl cyclase and a subsequent reduction in intracellular cAMP levels. Previous studies of this receptor have shown that mutation of W6.48 (W243 in the A3
receptor) results in a receptor that is unable to couple to G-proteins in the presence of agonists (Gaoet al., 2002). In the present study, we have investigated whether disruption of the rotomer toggle switch by mutation of this residue to phenylalanine (W243F) affects the receptor’s ability to inter-nalize after agonist challenge. Here, we demonstrate that there are marked differences in the effect of this mutation on the ability of the agonists NECA and HEMADO to signal to second-messenger pathways and internalize the A3receptor.
Methods
Generation of constructs used
cDNA encoding the full length human A3receptor (Alexander
et al., 2013) was fused in-frame with yellow fluorescent protein (YFP) that did not contain a methionine start signal and subcloned into pcDNA3.1. The W243F mutation was introduced into the A3receptor gene using the QuikChange
site-directed mutagenesis kit (Agilent Technologies, Cheshire, UK) and was confirmed by DNA sequencing. Full length A3
W243F-YFP was excised and subcloned into a native pcDNA3.1 vector. To generate A3-vYc and A3W243F-vYc
con-structs, YFP was excised from the required A3receptor
con-taining constructs and replaced with cDNA encoding the C-terminal residues 155-238 of the venus variant of YFP (vYc) (Kilpatricket al., 2010). To generate N-terminal SNAP-tagged A3 and A3W243F, the methionine start signal was removed
from cDNA encoding the full length A3and subcloned into a
vector (pSEMS) containing a 5HT3-receptor-derived signal
Cell culture, generation of stable cell lines
and transient transfections
CHO-K1 cells stably expressing a cAMP response element-secreted placental alkaline phosphatase (CRE-SPAP) reporter gene (CHO CRE-SPAP) under hygromycin selectivity and CHO-K1 cells stably expressing β-arrestin2-vYnL (CHO
β-arrestin2-vYnL, a gift from Dr. N. Holliday, University of Nottingham, Nottingham, UK) were maintained in DMEM/ F12 medium containing 10% FCS and 2 mM L-glutamine at 37°C in a humidified atmosphere of air/CO2(19:1). To
gen-erate CHO CRE-SPAP cell lines that stably expressed A3-YFP
or A3 W243F-YFP and CHO β-arrestin2-vYnL cells lines
co-expressing A3-vYc or A3 W243F-vYnL, the appropriate
parental cell lines were transfected with the required DNA using Lipofectamine according to the manufacturer’s instruc-tions. Transfected cells were subjected to selective pressure for 2–3 weeks through the addition of 1 mg·mL−1 G418 to the
normal growth medium. After 2–3 weeks, the cells were dilution-cloned to obtain cell lines originating from a single cell. Cell lines were initially screened for YFP or bimolecular fluorescence complementation (BiFC) fluorescence and CRE-SPAP cells lines were subsequently tested in the CRE-CRE-SPAP gene transcription assay. SNAP-tagged A3and A3W243F DNA
was transiently transfected into CHO CRE-SPAP using Fugene HD according to the manufacturer’s instructions using a 3:1 Fugene : DNA ratio. Cells were transfected 24 h before use for imaging experiments.
Confocal imaging
Live-cell BiFC imaging was performed on A3-vYc/β
-arrestin2-vYnL and A3 W243F-vYc/β-arrestin2-vYnL cells grown in
Nunc Labtek 8-well plates, and images obtained using a Zeiss 710 confocal microscope (Carl Zeiss GmbH, Jena, Germany) fitted with a 63×plan-Apochromat NA1.4 Ph3 oil-immersion objective. Live-cell imaging analysis was performed on A3-YFP
or A3 W243F-YFP CRE-SPAP cells and transiently expressed
SNAP-A3 or SNAP-A3 W243F grown in Nunc Labtek 8-well
plates, and images obtained using a Zeiss LSM5 Exciter con-focal microscope (Carl Zeiss GmbH) fitted with a 63× plan-Apochromat NA1.4 DIC oil-immersion objective. For both YFP, BiFC and BG-AF488 label, a 488 nm argon laser was used to excite the fluorophore and emission was detected using a BP505-530 filter. Cells expressing the SNAP-tagged receptors were labelled with 1μM SNAP-surface BG-AF488 (New England Biolabs) in DMEM/F12 medium for 30 min at 37°C/5% CO2. Before all imaging experiments, normal
growth medium or medium containing BG-AF488 was removed and cells were washed twice in HEPES-buffered saline solution (HBSS; 25 mM HEPES, 10 mM glucose, 146 mM NaCl, 5 mM KCl, 1 mM MgSO4, 2 mM sodium
pyru-vate, 1.3 mM CaCl2) and fresh HBSS was added for analysis.
To induce BiFC or internalization of receptors, cells were incubated for 60 min (YFP-tagged receptors) or 45 min (SNAP-tagged receptors) at 37°C with 10μM NECA or HEMADO before imaging. Images of A3-YFP and A3
W243F-YFP cells were taken with same pinhole diameter, laser power, gain and offset to allow comparison of YFP fluorescence. To obtain fluorescence intensity values, a region of interest was drawn around the plasma membrane of 10 cells per image in Zeiss AIM 4.2 software (Carl Zeiss GmbH).
Automated imaging of
receptor internalization
CHO β-arrestin2-vYnL cells expressing either A3-vYc or A3
W243F-vYc or CRE-SPAP cells stably expressing either A3-YFP
or A3 W243F-YFP were seeded into 96-well clear-bottomed,
black-walled 96-well plates (μclear base, Greiner Bio One, Stonehouse, UK) and grown to confluency. Immediately before experimentation, normal growth medium was re-placed with serum-free medium. To generate concentration-response curves, increasing concentrations of NECA or HEMADO were added to the cells before incubation for 45 min (YFP cell lines) or 60 min (BiFC cell lines) at 37°C/5% CO2/95% air. To estimate the time course of
inter-nalization, cells were treated with 10μM NECA or HEMADO for 2.5–120 min. For experiments to estimate the affinity dissociation constant of CA200645 at A3-YFP and A3
W243F-YFP, cells were pretreated with 25 nM CA200645 for 30 min at 37°C/5% CO2/95% air before the addition of increasing
concentrations of NECA for 45 min. Medium was removed and cells were washed once in PBS. Cells were then fixed by the addition of 3% paraformaldehyde solution in PBS for 20 min at room temperature. After fixing, cells were washed twice in PBS, before staining of the cell nuclei with the cell permeable dye H33342 (2μg·mL−1 in PBS) for 20 min at
room temperature, followed by two additional washes with PBS. Images were obtained using an ImageXpress Ultra con-focal plate reader (Molecular Devices, Sunnyvale, CA, USA). Four central images were obtained per well using a Plan Fluor 40x NA0.6 extra-long working distance objective. BiFC and YFP images were obtained by excitation with a 488 nm laser line with emission collected through a 525–550 nm band pass filter and H33342 images obtained by excitation with a 405 nm laser line and emission collected through a 447–460 nm band pass filter. Granularity analysis was per-formed on the resulting images using a granularity algo-rithm within MetaXpress software (Molecular Devices, Sunnyvale, CA, USA) and intensity above background was set for each individual experiment (Kilpatrick et al., 2010). Areas of internalized receptors were identified by granularity analysis; granules were defined as having a diameter of between 7 and 15μm and nuclei as having a diameter of between 6 and 9μm, resulting in a measurement of the granule count per cell for each image.
Fluorescence-based competition binding assay
A3-YFP or A3W243F-YFP CRE-SPAP cells were seeded into a96-well clear-bottomed, black-walled plate and grown to con-fluency. On the day of analysis, normal growth medium was removed and cells washed once with HBSS pre-warmed to 37°C. Fresh HBSS was added to each well and the required concentration of NECA or HEMADO added in addition to 25 nM CA200645 and the cells incubated for 60 min, 37°C/5% CO2. Buffer was then removed from each well, cells
length cell scoring algorithm within MetaXpress software (Molecular Devices).
CRE-SPAP gene transcription assay
A3-YFP or A3W243F-YFP CRE-SPAP cells were grown to
con-fluence in 96-well plates. One day before analysis, normal growth medium was removed from the cells and replaced with serum-free medium (DMEM/F12 containing 2 mM L-glutamine). Where applicable, PTx (100 ng·mL−1) was
added at this stage. On the day of the assay, the medium was removed and replaced with fresh serum-free medium con-taining the required concentration of the agonist, and cells were incubated for 1 h at 37°C/5% CO2. After 1 h, the
required concentration of forskolin (FSK) was added, and cells were incubated for a further 5 h at 37°C/5% CO2. Following
the 5 h incubation, all medium was removed from the cells, 40μL of fresh serum-free medium was added to each well and cells incubated for a further 1 h at 37°C/5% CO2. The plates
were then incubated at 65°C for 30 min, to destroy any endogenous alkaline phosphatases. Plates were cooled to room temperature and 100μL of 5 mM 4-nitrophenyl phos-phate in diethanolamine-containing buffer [10% (v v−1)
diethanolamine, 280 mM NaCl, 500μM MgCl2, pH 9.85] was
added to each well; the plates were then incubated at 37°C for 25 min. The absorbance at 405 nm was measured using a Dynex MRX plate reader (Chelmsford, MA, USA).
ERK1/2 phosphorylation assay
A3-YFP or A3W243F-YFP CRE-SPAP cells were grown to
con-fluency in clear 96-well plates. Normal growth medium was replaced with serum-free medium for at least 4 h before analysis. Levels of ERK1/2 phosphorylation were measured using the AlphaScreen SureFire p-ERK assay kit (PerkinElmer). Briefly, cells were stimulated with the required concentration of NECA for 5 min in fresh serum-free medium. Medium was removed from each well and replaced with 40μL SureFire lysis buffer. After shaking for 5 min, a 1:80:20:120 v v−1
dilu-tion of AlphaScreen beads : lysate : activadilu-tion buffer : reac-tion buffer in a 5.5μL total volume was transferred to a white opaque 384-well proxiplate in diminished light. After 2 h of incubation in the dark at room temperature, the fluorescence signal was measured with an EnVision plate reader (Perki-nElmer) using standard AlphaScreen settings.
cAMP accumulation assay
A3-YFP or A3W243F-YFP CRE-SPAP cells were grown to
con-fluence in 24-well plates. On the day of analysis, cells were labelled with [3H]-adenine (2μCi·mL−1) in a total volume of
600μL per well for 2 h at 37°C/5% CO2 in normal growth
medium. After 2 h, the [3
H]-adenine-containing medium was removed; cells washed once in serum-free medium and fresh serum-free medium, containing 10μM rolipram, added. The required concentration of agonist was added to the appropri-ate well and cells incubappropri-ated for 10 min at 37°C. After 10 min, 10μM FSK was added to all wells, apart from basal wells, and cells were incubated for a further 1 h at 37°C. The assay was terminated by the addition of 50μL concentrated HCl to each well. The levels of [3H]-cAMP incorporated were
meas-ured by sequential Dowex and alumina chromatography and the efficiency of each column was determined by the recovery of [14C]-cAMP as described by Donaldsonet al. (1988).
Data analysis
A basal and FSK control was included in each separate concentration-response CRE-SPAP gene transcription assay and cAMP accumulation assay to allow the responses in each cell line to be expressed as an inhibition of FSK-stimulated SPAP production. For ERK1/2 phosphorylation assays, data were normalized to basal (in the absence of NECA) and the maximal 10μM NECA response. In NECA-induced internali-zation assays, data were normalized to basal (in the absence of NECA) and maximal internalization, and in assays using HEMADO, data were normalized to basal (in the absence of agonist) and a 10μM NECA control which was included in each separate experiment.
All data were fitted using non-linear regression in Prism 5 (GraphPad Software, San Diego, CA, USA). Concentration-response curves were fitted to the following equation:
Response E A A EC
max
= × [ ]
[ ]+ 50
where Emaxis the maximal response and the EC50is the molar
concentration of agonist required to generate 50% of the Emax.
Time course experiments were fitted using a one phase asso-ciation equation which is as follows
Y=Yo+(Plateau Y− o)
(
1−e−Kt)
where Yo represents the level of internalization at time (t)
equal to zero, Plateau is the maximal internalization at infinite time and K is the rate constant in min. Statistical significance was determined by Student’s unpairedt-test or by one-wayANOVA with Dunnett’spost hocanalysis and P<
0.05 was considered statistically significant. Competition binding curves with the fluorescently labelled antagonists CA200645 were fitted to the following equation to calculate the binding affinity (Ki) NECA and HEMADO
K IC L K i
D =
+[ ]
50 1
where [L] is the concentration of CA200645 in nM,KDis the
KD of CA200645 at A3-YFP or A3 W243F-YFP in nM. The
calculatedKDvalues used were 18.1 and 15.6 nM at A3-YFP
and A3 W243F-YFP respectively (Supporting Information
Figure S2). IC50is calculated using the following equation
% inhibition of specific binding= × [ ]
[ ]+
100
50 A A IC
where [A] is the concentration of competing drug and the IC50
is the molar concentration of ligand required to inhibit 50% of the specific binding of concentration [L] of CA200645. Estimated affinity values (pKD) of CA200645 at A3-YFP and A3
W243F-YFP were calculated from the shift of the agonist concentration-response curves elicited in the presence of a single concentration of CA200645 (B = 25 nM) using the following equation
DR B
KD
= +1 [ ]
Materials
G418, Lipofectamine and Optimem were obtained from Inv-itrogen (Paisley, UK). FCS was obtained from PAA Laborato-ries (Wokingham, UK), L-glutamine from Lonza (Basel, Switzerland) and Fugene HD from Promega (Southampton, UK). Pertussis toxin (PTx) was purchased from Merck Chemi-cals (Nottingham, UK). NECA [5-(N-ethylcarboxamido) adenosine] and HEMADO [2-(1-hexynyl)-N -methyladeno-sine] were obtained from Tocris Bioscience (Bristol, UK). The AlphaScreen SureFire p-ERK assay kit was obtained from PerkinElmer (Waltham, MA, USA). [3H]-adenine and [14
C]-cAMP were from Perkin-Elmer (Buckinghamshire, UK). CA200645 was purchased from Cellaura Technologies Ltd (Nottingham, UK). All other chemicals and reagents were purchased from Sigma-Aldrich (Gillingham, UK).
Results
Effect of W243F mutation in the A
3receptor
on agonist-stimulated receptor internalization
Previous studies have found that substitution of tryptophan for phenylalanine at residue 243 in the A3receptor (W243F)resulted in a receptor that was unable to couple effectively to heterotrimeric G-proteins (Gao et al., 2002). In the present study, we have evaluated the impact of this mutation on agonist mediated internalization, downstream signalling and
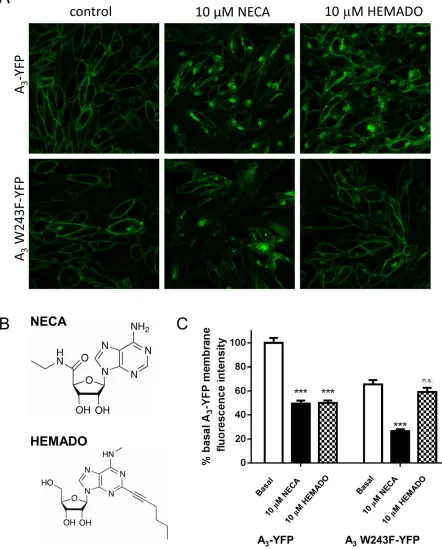
β-arrestin2 recruitment to two adenosine receptor agonists, NECA and HEMADO (Figure 1B). To monitor receptor inter-nalization, we generated CHO cell lines expressing either an A3receptor-YFP (A3-YFP) fusion protein or a fusion protein
containing the W243F mutation (A3 W243F-YFP). Confocal
imaging confirmed that both A3-YFP and A3W243F-YFP were
predominantly expressed on the cell surface.
Treatment of both A3-YFP- and A3W243F-YFP-expressing
cells with 10μM NECA resulted in rapid internalization of the receptor from the cell membrane to punctuate intracellular granules, which accumulated predominantly in the perinu-clear region (Figure 1A). In contrast, it was found that 10μM HEMADO-mediated substantial internalization of A3-YFP but
was unable to stimulate internalization of A3 W243F-YFP
(Figure 1A). Quantification of the fluorescence intensity at the cell surface revealed that both NECA and HEMADO stimulated 50% reduction in membrane fluorescence in A3-YFP cells. In A3 W243F-YFP cells, a similar reduction in
membrane fluorescence was observed upon NECA treatment, but there was no significant change in membrane fluores-cence in the presence of HEMADO (Figure 1C), indicating that minimal levels of A3W243F-YFP are being removed from
the cell surface upon treatment with this agonist.
As the C-terminus of a GPCR plays an important role in the interaction with intracellular proteins, such as
β-arrestins and GRKs, it may be that the fluorescent protein fused to the C-terminus of the receptor is preventing the interaction of the HEMADO-stimulated A3W243F with these
adaptor proteins. To investigate this, the wild-type A3
recep-tor and the equivalent W243F mutant, were labelled on their N-terminus with a SNAP tag. These constructs were transiently expressed in CHO CRE-SPAP cells and the SNAP tag was subsequently labelled with the BG-AF488 surface
substrate to allow visualization of the receptors on the surface of the transfected cells. Clear membrane expression of SNAP-A3 and SNAP-A3 W243F were observed and
treat-ment of SNAP-A3-expressing cells with 10μM NECA or
HEMADO resulted in clear punctate granules within the cells. Whereas in cells expressing SNAP-A3 W243F, NECA
retained the ability to cause internalization of the receptor, treatment with HEMADO did not result in any clear change in the localization of the receptor from the cell surface (Sup-porting Information Figure S1). These data suggest that the differences observed with NECA and HEMADO are not due to the C-terminal YFP tag.
To investigate the time- and concentration-dependence of A3-YFP and A3 W243F-YFP internalization to both agonists,
quantification of internalized receptor was carried out using a MD ImageXpress Ultra confocal plate reader. This high-content screening based approach automatically collects images from each well of a 96-well plate and quantifies the accumulation of receptor in granules within the cells (pre-dominantly in the perinuclear compartment) using a math-ematical algorithm (Kilpatrick et al., 2010; Watson et al., 2012). This enabled full concentration-response curves to both NECA and HEMADO to be generated for A3-YFP and A3
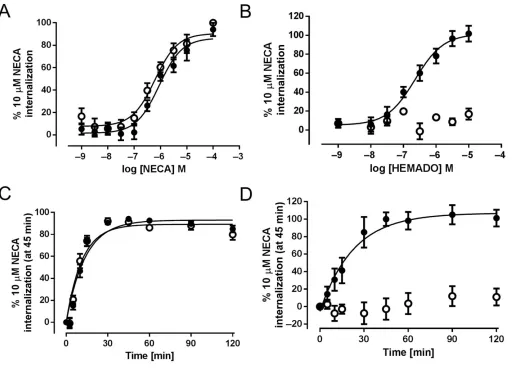
W243F-YFP (Figure 2). NECA stimulated receptor internaliza-tion with similar potency in the A3W243F-YFP- and A3
-YFP-expressing cells (Figure 2A, Table 1). In contrast, HEMADO stimulated internalization with a higher potency than NECA at A3-YFP but did not stimulate any significant internalization
of the mutant A3W243F-YFP receptor at concentrations up to
10μM. These experiments were performed at a single time point (45 min); therefore, to confirm that the observed results were not due to slower kinetics of the HEMADO-mediated response, the time course of internalization was determined for both agonists. HEMADO-mediated internali-zation of the wild-type A3-YFP was indeed significantly slower
than that observed with NECA (HEMADOt1/2=18.0±4.8 min
vs. NECAt1/2=8.5 ±0.8 min,P <0.05, unpaired Student’s
t-test), but at the A3W243F-YFP receptor, no accumulation of
internalized receptor could be detected even after 2 h stimu-lation with 10μM HEMADO (Figure 2C,D) and visual inspec-tion of the images showed no change in receptor distribuinspec-tion (data not shown). The difference in the kinetics of NECA- and HEMADO-mediated internalization of A3-YFP suggests the
involvement of different downstream signalling pathways to stimulate receptor internalization and to test this, cells expressing A3-YFP or A3 W243F-YFP were treated with PTx
for 16 h before stimulation to prevent coupling to Gi/o
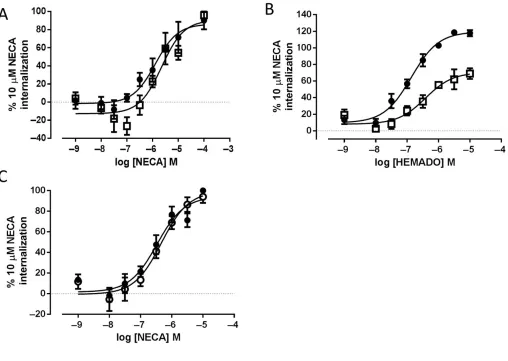
G-proteins. Pretreatment of A3-YFP- or A3
W243F-YFP-expressing cells with PTx resulted in no change in the potency of NECA (pEC50values in the presence of PTx of 5.58
±0.31 and 6.29±0.11 for A3-YFP and A3W243F-YFP,
respec-tively; n = 4, P > 0.05, Student’s unpaired t-test vs. pEC50
values in the absence of PTx) (Figure 3). In addition, PTx treatment did not alter the distribution of either receptor before or after agonist treatment (data not shown). The influence of PTx treatment on the concentration-response characteristics of HEMADO-mediated internalization of the wild-type A3-YFP receptor is shown in Figure 3. In contrast to
NECA-mediated A3-YFP receptor internalization,
Figure 1
NECA, but not HEMADO, treatment stimulates internalization of A3W243F-YFP. (A) Confocal images of A3-YFP (top panels) and A3 W243F-YFP-expressing (bottom panels) cells were obtained in the absence of agonist (left-hand panels), and both receptors showed predominately membrane expression. After a 30 min treatment with 10μM NECA (middle panels) or 10μM HEMADO (right hand panels), fluorescent granules were observed within both A3-YFP- and A3W243F-YFP-expressing cells upon NECA treatment with not with HEMADO. Images are representative of those obtained in three separate experiments. (B) Chemical structures of the agonists NECA and HEMADO. (C) Fluorescent intensity values (expressed as a percentage of the wild-type control) were determined for YFP in membrane regions of interest (ROIs) for control (basal), 10μM NECA and 10μM HEMADO images obtained in (A). Each bar represents the mean±SEM of membrane ROIs obtained from at least 55 different cells.***
in the maximal levels of internalization in the presence of PTx (30±6% reduction vs. 10μM NECA internalization,n=
5) but no significant change in the potency of the agonist (pEC50=6.55±0.21,n=5).
By introducing the W243F mutation to the A3receptor, it
is possible that ligand-binding site has been sufficiently altered to prevent the binding of HEMADO to the receptor. To confirm that HEMADO was still capable of binding to the A3 W243F-YFP receptor, we investigated the affinity of
NECA and HEMADO at both A3-YFP and A3W243F-YFP
recep-tors using a previously characterized fluorescence-based com-petition binding assay, using an xanthine amine congener-based fluorescent antagonist, CA200645 (Stoddart et al., 2012). Initially, we established that the fluorescent antagonist used in the competition binding assay, CA200645, itself retained affinity at both A3-YFP and A3W243F-YFP. This was
achieved by measuring the shift in NECA internalization concentration-response curves at both A3-YFP and A3
W243F-YFP in the presence of 25 nM CA200645 (Supporting Infor-mation Figure S2). Subsequent Gaddum analysis revealed the pKDfor CA200645 was 7.82±0.13 at the A3-YFP receptor and
7.81 ± 0.05 at the A3 W243F-YFP receptor. A3-YFP and A3
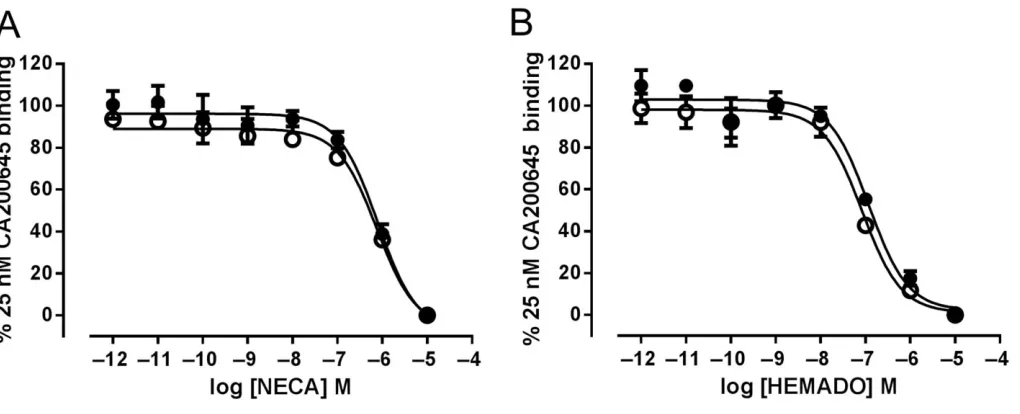
W243F-YFP cells were treated with increasing concentrations of NECA or HEMADO in the presence of 25 nM CA200645, automated confocal images were obtained on the Ultra con-focal plate reader and total image intensities were deter-mined. As shown in Figure 4A, a concentration-dependent decrease in CA200645 binding was observed with both NECA and HEMADO in both cell lines. Calculation of pKi values
from the resulting IC50values showed that the affinity of both
NECA and HEMADO was similar at both wild-type and mutant receptors (Table 1). To confirm that HEMADO was acting as an antagonist at the A3W243F-YFP receptor
(com-pared with its agonist properties at the A3-YFP receptor), A3
[image:7.594.46.560.59.431.2]W243F-YFP-expressing cells were pretreated with 10μM HEMADO before the addition of increasing concentrations of
Figure 2
NECA. Under these conditions, the ability of NECA to cause internalization of the A3 W243F-YFP receptor was virtually
abolished (Figure 5).
Influence of the A
3W243F mutation
on inhibition of downstream
functional responses
We further investigated the functional consequences of this mutation by evaluating its impact on second-messenger sig-nalling. It is well documented that the A3receptor can induce
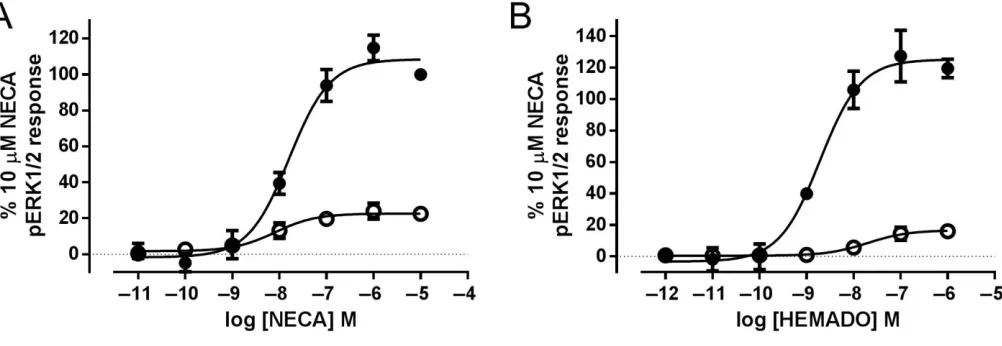
phosphorylation of ERK1/2 via the activatedβγ subunits of the G-protein (Schulte and Fredholm, 2002). We observed a robust, concentration-dependent increase in ERK1/2 phos-phorylation in both A3-YFP- and A3 W243F-YFP-expressing
cells following a 5 min stimulation with NECA (Figure 6A). There was no significant difference in the potency of NECA at A3-YFP and A3 W243F-YFP receptors (Table 2,P> 0.05,
Stu-dent’s unpairedt-test), but the maximal increase in ERK1/2 phosphorylation was significantly reduced in the A3
W243F-YFP cells (P<0.05, Student’s unpairedt-test). Unexpectedly, HEMADO also caused a concentration-dependent increase in ERK1/2 in both A3-YFP- and A3 W234F-YFP-expressing
cells (Figure 6B). However, HEMADO was significantly less potent at A3 W243F-YFP compared with A3-YFP (P < 0.05,
Student’s unpairedt-test) and showed a significantly reduced maximum response compared with the wild-type receptor (Table 2).
The effect of the W243F mutation on agonist-mediated changes in cAMP were also investigated via two independent methods: firstly, by direct measurement of [3H]-cAMP levels
and secondly, by cAMP-mediated activation of a reporter gene. The A3receptor couples predominately to the Gifamily
of G-proteins, causing an inhibition of FSK-stimulated cAMP production. In A3-YFP-expressing cells, stimulation
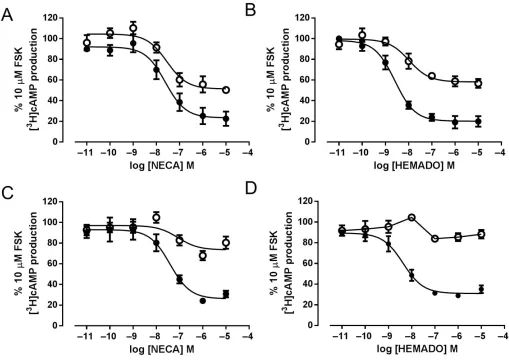
with either NECA or HEMADO for 1 h caused a substantial concentration-dependent inhibition of FSK-stimulated [3
[image:8.594.46.554.60.421.2]H]-cAMP accumulation (Figure 7A,B), with HEMADO acting as a full agonist at this response compared with NECA. In A3 W234F-YFP-expressing cells, NECA and HEMADO also
Figure 3
induced inhibition of FSK-stimulated [3H]-cAMP
accumula-tion, but the maximum response was reduced relative to A3-YFP-expressing cells (Table 2). In order to compare results
directly with those from the reporter gene assay, [3H]-cAMP
accumulation was also carried out using a 5 h stimulation
time. In cells expressing the A3-YFP receptor, a similar
response was seen to that using a 1 h stimulation for both agonists, in terms of both potency and maximum effect, (P>
0.05, Student’s unpairedt-test) (Figure 7C,D). In contrast, for the A3 W243F-YFP receptor, while 1 h treatment with both
NECA and HEMADO lead to a moderate inhibition of FSK-stimulated cAMP accumulation (49.7±2.0% and 43.2±4.3% inhibition, respectively) (Table 2), extending the agonist stimulation time to 5 h reduced the maximal inhibition of cAMP accumulation (Figure 7). This reduction in response following a 5 h agonist exposure was much more pronounced with HEMADO, with very little inhibition of [3H]-cAMP
accu-mulation seen compared with the levels of inhibition observed after 1 h of agonist stimulation.
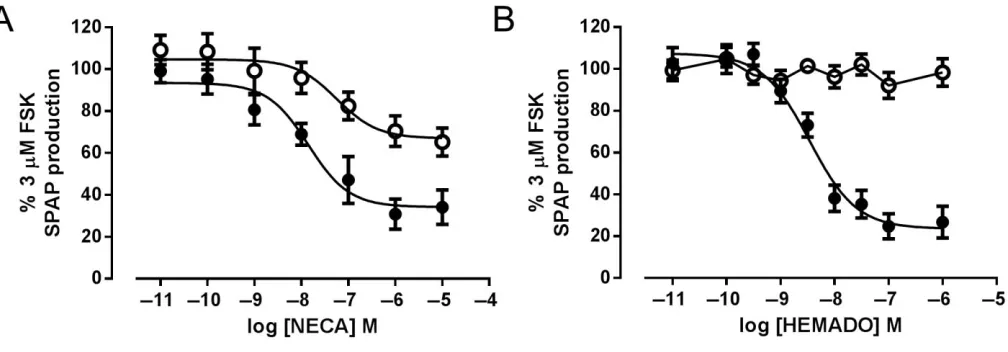
Both A3-YFP and A3W243F-YFP cell lines also expressed a
SPAP reporter gene, linked to a CRE-promoter (Bakeret al., 2002), which gives an indirect measure of cAMP levels. NECA stimulation (5 h) caused a concentration-dependent inhibi-tion of SPAP producinhibi-tion in response to 3μM FSK in both the wild-type A3-YFP and A3W243F-YFP receptor-expressing cells.
As with the [3H]-cAMP accumulation assays, the maximum
inhibition achieved was substantially reduced in A3
W234F-YFP cells compared with that in A3-YFP cells (30±4%
inhi-bition for A3W243F-YFP vs. 79±7% for A3-YFP) (Figure 8A,
Table 2). As shown in Figure 8, HEMADO showed similar efficacy to NECA in cells expressing the wild-type A3-YFP.
However, in A3W243F-YFP-expressing cells, HEMADO caused
no significant decrease in FSK-stimulated SPAP production at any concentration of agonist tested (Figure 8B, Table 2). To confirm that the inhibition of SPAP production in A3-YFP and
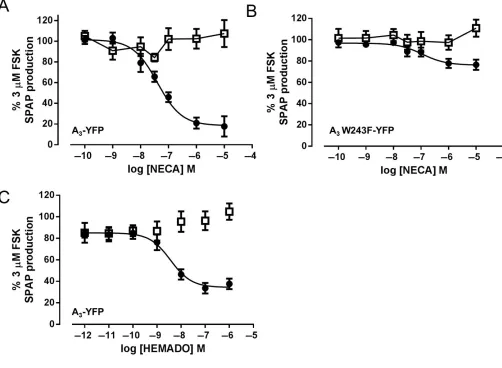
A3W243F-YFP cells was Gi/o-mediated, cells were treated with
[image:10.594.47.557.59.266.2]PTx and NECA concentration-response curves were generated in the presence and absence of FSK. In both cell lines, pre-incubation with PTx abolished NECA-mediated inhibition of
Figure 4
Measuring NECA and HEMADO affinity at A3-YFP and A3W243F-YFP using a fluorescence-based competition binding assay. A3-YFP (closed circles) and A3W243F-YFP (open circles) cells were treated with 25 nM of the fluorescent A3receptor antagonist CA200645 in addition to increasing concentrations of NECA (A) or HEMADO (B) and automated confocal images of the BY630/650 containing fluorescent ligand obtained. Data are normalized to image intensity in the absence of competing ligand and to the image intensity obtained in the presence of 10μM NECA for each cell line. Each data point represents the mean±SEM of four experiments performed in triplicate.
Figure 5
[image:10.594.41.284.359.521.2]SPAP production, suggesting that the response is mediated by activation of Gi/o. In addition, no HEMADO-mediated
response was observed in A3-YFP cells treated with PTx
(Figure 9), and basal levels of SPAP production were unaf-fected by PTx in both cell lines. In the absence of FSK, there was no increase in SPAP production in the presence of NECA, indicating that there is no measurable Gscoupling by either
receptor, and that treatment with PTx does not induce the receptors to couple to Gs in the absence of Gi/o (data not
shown).
Interaction of A
3and A
3W243F
with
β
-arrestin2
Subtle differences in the efficacies of NECA and HEMADO at the signalling pathways tested thus far, and the inability of HEMADO to stimulate sequestration of A3W243F-YFP from
the cell surface, raises the possibility that these agonists may differentially recruitβ-arrestin2 to the receptor. To quantify
β-arrestin2 recruitment, we used a BiFC approach to trap receptor-β-arrestin complexes through interaction between two fragments of venus YFP (vYFP) and subsequent
visuali-zation of the resulting mature vYFP chromophore (Roseet al., 2010). We generated stable CHO cell lines expressing
β-arrestin2-vYnL (residues 1-173 of vYFP) in combination with A3-vYc fusion protein (residues 155-238 of vYFP) or
A3-vYc containing the W243F point mutation (A3
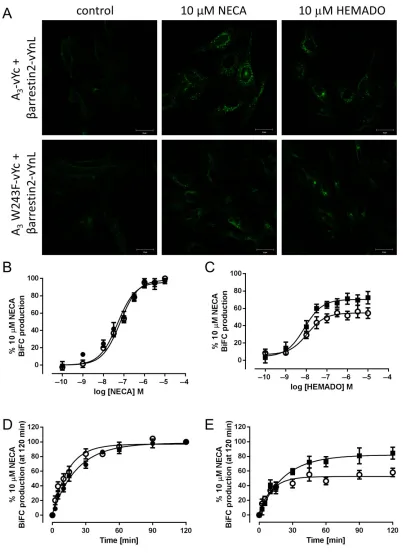
W243F-vYc). Confocal imaging of the resulting cell lines indicated low levels of BiFC under control conditions in both A3-vYc/
β-arrestin2-vYnL and A3 W234F-vYc/β-arrestin2-vYnL cell
lines, suggesting some degree of basal receptor-β-arrestin association (Figure 10). Both NECA and HEMADO caused a substantial increase in BiFC fluorescence in both cell lines, which was localized in perinuclear compartments indicating internalized receptor-β-arrestin complexes (Figure 10). To investigate the time- and concentration-dependence of A3-vYc/β-arrestin2-vYnL and A3W243F-vYc/β-arrestin2-vYnL
BiFC to both agonists, quantification of BiFC was carried out using a MD ImageXpress Ultra confocal plate reader. NECA-stimulated receptor β-arrestin BiFC with similar potency in both A3-vYc/β-arrestin2-vYnL- and A3 W243F-vYc/β
[image:11.594.50.551.63.236.2]-arrestin2-vYnL-expressing cells (Table 3). HEMADO also caused a concentration-dependent increase in BiFC although
Figure 6
NECA and HEMDAO mediated ERK1/2 phosphorylation via A3-YFP and A3 W243F-YFP. A3-YFP CRE-SPAP (closed circles) and A3 W243F-YFP CRE-SPAP-expressing (open circles) cells were exposed to increasing concentrations of (A) NECA or (B) HEMADO for 5 min. Levels of phospho-rylated ERK1/2 were quantified using the SureFire AlphaScreen kit. Data were normalized to the 10μM NECA response in A3-YFP-expressing cells. The data shown represent the mean±SEM of four (A) or three (B) experiments performed in triplicate.
Table 3
Summary of agonist-mediated A3-vYc and A3W243F-vYc BiFC withβ-arrestin2-vYnL
NECA HEMADO
pEC50
Maximal
BiFC (%) n t1/2 n pEC50
Maximal
BiFC(%) n t1/2 n
A3-YFP 7.19±0.14 100 9 14.9±1.8 6 8.19±0.18 72.2±7.1 7 17.7±4.8 6 A3W243F-YFP 7.15±0.109 100 7 14.2±4.4 11 7.97±0.10 54.5±6.1 7 11.5±5.0 5
The pEC50,t1/2and maximal BiFC induced by NECA and HEMADO was determined in A3-vYc and A3W243F-vYc-expressingβ-arrestin2-vYnL cells. Maximal BiFC is expressed as a percentage of the internalization from treatment with 10μM NECA in each cell line. Values are mean
with significantly reduced maximal levels of BiFC compared with NECA (Figure 10 and Table 3). BiFC occurs rapidly when the two fragments of the fluorescent protein are within close proximity (Rose et al., 2010); therefore, it can be used to examine the recruitment ofβ-arrestin by agonist-stimulated receptor. Both NECA and HEMADO stimulated the formation of receptor/β-arrestin complexes rapidly in both cell lines. In addition, longer exposure to HEMADO did not increase the maximal BiFC observed in both A3-vYc/β-arrestin2-vYnL
and A3 W243F-vYc/β-arrestin2-vYnL-expressing cells (%
maximal internalization vs. 10μM NECA at 2 h, 84.3 ±8.2 and 58.0 ± 5.8 for A3-vYc/β-arrestin2-vYnL and A3
W243F-vYc/β-arrestin2-vYnL BiFC, respectively, P > 0.05, Student’s unpairedt-test vs. maximal internalization at 60 min).
Discussion
The binding of an agonist to a GPCR leads to structural changes within the TM regions allowing activation of a
G-protein, receptor internalization and desensitization. The most conserved residues across the GPCR superfamily are thought to play key roles in forming the active conformation of the receptor (Katritchet al., 2013; Venkatakrishnanet al., 2013). One such region is the CWxP motif within TM6, with the conserved tryptophan originally reported to be in involved in a rotomer toggle switch that is central to receptor activation (Shi et al., 2002; Schwartz et al., 2006; Nygaard
et al., 2009; Tate and Schertler, 2009). However, recent crystal structures of active-state GPCRs do not show rotomer changes in this residue upon agonist activation (Katritch
et al., 2013). Nevertheless, W6.48 has been shown to have a prominent role in ligand-dependent activation (Katritch
[image:12.594.43.552.60.423.2]et al., 2013). For example, comparison of the existing GPCR crystal structures have indicated that agonist-induced move-ments of TM3, TM5, TM6 and TM7 are accompanied by a rearrangement of a cluster of conserved hydrophobic and aromatic residues leading to a rearrangement of the TM3– TM5 interface and formation of new non-covalent contacts between TM5 and TM6 (Deupi and Standfuss, 2011;
Figure 7
Venkatakrishnan et al., 2013). This ‘transmission switch’ includes W6.48 (which interestingly is also located close to the base of the binding pocket of many GPCRs) and also involves L5.51, P5.50 and L3.40.
Here, we have studied the effect of mutating this residue to phenyalanine within the A3receptor (W243F) and
deter-mined its effects on the ability of the receptor to: (i) generate a second-messenger signal; (ii) interact withβ-arrestin2; and (iii) to undergo receptor internalization.
Previous studies of the properties of the A3receptor
con-taining a mutation in this region found the mutant receptor unable to couple to G-proteins (Gaoet al., 2002). To compare the expression pattern and internalization characteristics of the wild-type and mutant A3receptor, we created YFP fusions
to allow visualization of the receptors. Initial confocal imaging confirmed that the mutant receptor was trafficked effectively to the cell surface, and indicated that both the A3-YFP and A3W243F-YFP were sequestered from the cell
surface upon treatment with the NECA. Quantification of the kinetics and concentration-dependence of this response showed that the rate of internalization of the YFP-tagged wild-type receptor was in agreement with previous studies (Ferguson et al., 2002; Trincavelli et al., 2002; Gao and Jacobson, 2008). The internalization characteristics of the mutant receptor in response to NECA stimulation were also similar to those of the wild-type receptor. Furthermore, HEMADO and NECA were equally efficacious in stimulating internalization of the wild-type receptor. However, in marked contrast to NECA, HEMADO was completely unable to inter-nalize the W243F mutant receptor at any concentration or time point tested. We confirmed that the affinity of the ago-nists was not significantly different at the mutant receptor compared with the wild-type receptor and pretreatment with HEMADO inhibited NECA-mediated internalization. This confirmed that, although still able to bind to the mutant receptor with high affinity, HEMADO was unable to stabilize the active conformation of the W243F mutant receptor responsible for internalization.
The complete loss in efficacy of HEMADO at the mutant A3 receptor W243F for receptor internalization was not
observed to the same extent when other second-messenger pathways were examined. HEMADO retained an ability to activate ERK1/2 phosphorylation and to inhibit FSK-stimulated cAMP accumulation via A3receptor W243F, albeit
with a lower maximal response compared with the wild-type A3 receptor. The maximal pERK1/2 and cAMP responses
obtained for NECA and HEMADO were not significantly dif-ferent in the W243F A3receptor cells. However, it was
notice-able that the W243F mutation caused a significant decrease in the potency of HEMADO for both pERK1/2 and cAMP responses (consistent with a reduction in efficacy) while the potency of NECA was not altered to the same degree.
This suggests that the W243F mutation has resulted in a greater reduction in the efficacy of HEMADO for all responses measured compared with NECA. The data also suggest that the differences in agonist efficacy cannot be simply explained by any differences in receptor expression levels between the two cell lines. The smaller pERK1/2 and cAMP responses obtained with both HEMADO and NECA are also in agree-ment with data obtained in a variety of other GPCRs in which the substitution of the conserved typtophan in TM6 also resulted in a small agonist response (Wesset al., 1993; Holst
et al., 2010). In other receptors, mutations of this residue increased receptor efficacy (bradykinin B2 receptor; Marie
et al., 2001) or converted bovine rhodopsin to a light-insensitive mutant (Ridgeet al., 1992). This confirms that this residue plays a key role in determining the balance between active and inactive states of the receptor.
It was noticeable that responses measured over a longer time course (5h [3H]-cAMP accumulation or CRE-SPAP
reporter gene expression) were more sensitive to the influ-ences of the W243F mutation, with HEMADO affected to a greater extent than NECA. As the stimulation of CRE-driven transcription of the SPAP gene requires a small but sustained increase in the levels of intracellular cAMP (Baker
[image:13.594.49.553.60.236.2]et al., 2004), the absence of a response to HEMADO in the
Figure 8
CRE-driven gene transcription assay compared with the 1h [3H]-cAMP assay suggests that there are differences in the
sustained nature of the Gi-mediated inhibitory signal gener-ated in A3receptor W243F cells in response to HEMADO and
NECA. This is consistent with the data obtained on [3
H]-cAMP accumulation after 5 h and provides some evidence that receptor internalization may be required for sustained signalling to Gi. Interestingly, a requirement of receptor internalization for sustained signalling to the cAMP pathway has been observed for a number of other GPCRs (Mullershausen et al., 2009; Feinstein et al., 2011; Werthmannet al., 2012; Irannejadet al., 2013).
It is becoming clear that certain ligands can bias intracel-lular signalling to particular pathways (Kenakin, 2012). For example, propranolol can act as an inverse agonist of
β2-adrenoceptor-mediated cAMP accumulation but as an
agonist of β2-adrenoceptor-mediated pERK1/2 pathways
within the same cells (Azzi et al., 2003; Baker et al., 2003). Differences in the ability of agonists to translocateβ-arrestin
and signal to the cAMP pathway via the A3receptor have been
demonstrated previously (Gao and Jacobson, 2008). The com-plete loss of the ability of the W243F A3receptor to
internal-ize in response to HEMADO (under conditions where the response to NECA is unaffected) therefore raises the possibil-ity that this ligand may bias signalling towards G-protein coupled pathways in this mutant cell line.
To determine whether both NECA and HEMADO are capable of stimulating the recruitment ofβ-arrestin2 to both the wild-type A3receptor and the mutant W243F receptor, we
used a BiFC approach previously used to study other
GPCR-β-arrestin interactions (Kilpatrick et al., 2010; Watsonet al., 2012). We observed that NECA and HEMADO induced BiFC between β-arrestin2 and both the wild-type and W243F mutant of the A3 receptor. The potency of NECA is in line
[image:14.594.45.547.63.431.2]with that observed using enzyme fragment complementation (EFC) based approach (Gao and Jacobson, 2008). The positive BiFC signal relies on the close proximity of the two non-fluorescent fragments of the vYFP, which allows their
Figure 9
Figure 10
interaction and refolding to generate the mature chromo-phore which can be measured as vYFP fluorescence (Rose
et al., 2010). BiFC and EFC can measure transient interactions between two proteins but it is important to note that the complementation of the two fragments is essentially irrevers-ible (Morell et al., 2007). This effectively means that A3
receptor-β-arrestin2 complexes will be trapped by the BiFC process once they have been formed. The differences observed in the efficacy of HEMADO for the A3 receptor
W243F mutant between the quantitative imaging of receptor internalization and the β-arrestin BiFC approaches may, therefore, be due to the overexpression ofβ-arrestin2 in the BiFC cell line, which may amplify the receptor-arrestin inter-action and trap the receptor in A3receptor-β-arrestin2
com-plexes that then enhance A3receptor internalization. It is also
worth noting, however, that A3-vYc fused protein is smaller
that A3-YFP and this might therefore allow more efficient
coupling of the W243F A3 receptor toβ-arrestin2 following
stimulation with HEMADO. Finally, it may also be that the interaction of the HEMADO-bound mutant receptor and
β-arrestin2 in the W243F cell line (in the absence of
β-arrestin2 overexpression) is normally transient and not long enough to facilitate receptor internalization. What is clear, however, is that HEMADO has a lower efficacy than NECA for this A3receptor-β-arrestin2 interaction and that the
W243F mutation further reduces this efficacy in comparison with NECA. Variations inβ-arrestin recruitment by different agonists have been observed for other GPCRs (Hoffmann
et al., 2008; Shukla et al., 2008). For example, activation of the P2Y2 receptor by ATP or UTP has been shown to
induce differential coupling to β-arrestin1 and β-arrestin2 (Hoffmannet al., 2008).
Our data on the A3receptor W243F mutant supports the
idea that this residue is important in forming the active conformation of the receptor to stimulate a variety of down-stream signalling pathways. W6.48 appears in many GPCRs to be an important residue as part of a ‘transmission switch’ in mediating the transition between the active and inactive conformation of the receptor (Deupi and Standfuss, 2011; Katritchet al., 2013; Venkatakrishnanet al., 2013). Biophysi-cal techniques have shown that, in rhodopsin and the
β2-adrenoceptor, TM6 undergoes large conformational
changes upon activation (Farrenset al., 1996; Gether et al., 1997; Yaoet al., 2006). The crystal structure of the adenosine A2A receptor bound to an agonist demonstrates that the
agonist induces a shift in the position of W197 (W6.48) which causes TM6 to tilt and rotate (Xu et al., 2011), and although not as pronounced, there is also a shift in the position of W6.48 in the nanobody-stabilized active confir-mation of theβ2-adrenoceptor (Rasmussenet al., 2011). It has
been suggested that agonist binding causes movement of the TM backbone and the change in position of W6.48 induces the conformational change of TM6 that is important in receptor activation (Xuet al., 2011).
Our data support a central role of W6.48 in the agonist-induced activation of Gi protein andβ-arrestin2 pathways via the A3 receptor, but also raise the prospect that individual
agonists elicit different changes in the position of this residue with consequent implications for their ability to activate Gi-coupling and receptor internalization. These studies suggest that conformational changes in TM6 in the region of
W6.48 may have an important role in determining the struc-tural basis of agonist efficacy and ligand bias in activating intracellular signalling.
Acknowledgements
The authors thank Dr. Nicholas Holliday, University of Not-tingham for the BiFC plasmids and for theβ-arrestin-2-vYnL CHO cell line. This work was funded by a grant from the Medical Research Council (G080006).
Author contributions
LAS, BK, SJB and SJH participated in the research design. LAS conducted the experiments. LAS, SJB and SJH performed the data analysis. LAS, SJB and SJH wrote or contributed to the writing of the manuscript.
Conflict of interest
SJH and BK are directors of the University of Nottingham spinout company CellAura Technologies that supply the fluo-rescent ligand, CA200645.
References
Alexander SPH, Benson HE, Faccenda E, Pawson AJ, Sharman JL, Spedding M, Peters JA, Harmar AJ and CGTP Collaborators (2013). The Concise Guide to PHARMACOLOGY 2013/14: G
protein-coupled receptors. Br J Pharmacol 170: 1459–1581.
Azzi M, Charest PG, Angers S, Rousseau G, Kohout T, Bouvier M et al. (2003). Beta-arrestin-mediated activation of MAPK by inverse agonists reveals distinct active conformations for G protein-coupled receptors. Proc Natl Acad Sci 11406–11411.
Baker JG, Hall IP, Hill SJ (2003). Agonist and inverse agonist actions of beta-blockers at the human beta(2)-adrenoceptor provide evidence for agonist-directed signaling. Mol Pharmacol 64: 1357–1369.
Baker JG, Hall IP, Hill SJ (2002). Pharmacological characterization of CGP 12177 at the human beta(2)-adrenoceptor. Br J Pharmacol 137: 400–408.
Baker JG, Hall IP, Hill SJ (2004). Temporal characteristics of cAMP response element-mediated gene transcription: requirement for sustained cAMP production. Mol Pharmacol 65: 986–998.
Boutin A, Allen MD, Neumann S, Gershengorn MC (2012). Persistent signaling by thyrotropin-releasing hormone receptors correlates with G-protein and receptor levels. FASEB J 26: 3473–3482.
Deupi X, Standfuss J (2011). Structural insights into
agonist-induced activation of G protein-coupled receptors. Curr Opin Struct Biol 21: 541–551.
Farrens DL, Altenbach C, Yang K, Hubbell WL, Khorana HG (1996). Requirement of rigid-body motion of transmembrane helices for light activation of rhodopsin. Science 274: 768–770.
Feinstein TN, Wehbi VL, Ardura JA, Wheeler DS, Ferrandon S, Gardella TJet al. (2011). Retromer terminates the generation of cAMP by internalized PTH receptors. Nat Chem Biol 7: 278–284.
Ferguson G, Watterson KR, Palmer TM (2002). Subtype-specific regulation of receptor internalization and recycling by the carboxyl-terminal domains of the human A(1) and rat A(3) adenosine receptors: consequences for agonist-stimulated translocation of arrestin3. Biochem 41: 14748–14761.
Fredholm BB, IJzerman AP, Jacobson KA, Linden J, Müller CE (2011). International Union of Basic and Clinical Pharmacology. LXXXI. Nomenclature and classification of adenosine receptors–an update. Pharmacol Rev 63: 1–34.
Gaborik Z, Jagadeesh G, Zhang M, Spat A, Catt KJ, Hunyady L (2003). The role of a conserved region of the second intracellular loop in AT1 angiotensin receptor activation and signaling. Endocrinol 144: 2220–2228.
Gao ZG, Jacobson KA (2008). Translocation of arrestin induced by human A3 adenosine receptor ligands in an engineered cell line: comparison with G Protein-dependent pathways. Pharmacol Res 57: 303–311.
Gao ZG, Chen A, Barak D, Kim SK, Muller CE, Jacobson KA (2002). Identification by site-directed mutagenesis of residues involved in ligand recognition and activation of the human A(3) adenosine receptor. J Biol Chem 277: 19056–19063.
Gesty-Palmer D, Chen M, Reiter E, Ahn S, Nelson CD, Wang Set al. (2006). Distinctβ-arrestin- and G protein-dependent pathways for parathyroid hormone receptor-stimulated eRK1/2 activation. J Biol Chem 281: 10856–10864.
Gether U, Lin S, Ghanouni P, Ballesteros JA, Weinstein H, Kobilka BK (1997). Agonists induce conformational changes in
transmembrane domains III and VI of the beta(2) adrenoceptor. EMBO J 16: 6737–6747.
Hoffmann C, Ziegler N, Reiner S, Krasel C, Lohse MJ (2008). Agonist-selective, receptor-specific interaction of human P2Y receptors withβ-arrestin-1 and -2. J Biol Chem 283: 30933–30941.
Holst B, Cygankiewicz A, Jensen TH, Ankersen M, Schwartz TW (2003). High constitutive signaling of the ghrelin receptor – identification of a potent inverse agonist. Mol Endocrinol 17: 2201–2210.
Holst B, Nygaard R, Valentin-Hansen L, Bach A, Engelstoft MS, Petersen PSet al. (2010). A conserved aromatic lock for the tryptophan rotameric switch in TM-VI of seven-transmembrane receptors. J Biol Chem 285: 3973–3985.
Irannejad R, Tomshine JC, Tomshine JR, Chevalier M, Mahoney JP, Steyaert Jet al. (2013). Conformational biosensors reveal GPCR signalling from endosomes. Nature 495: 534–538.
Katritch V, Cherezov V, Stevens RC (2013). Structure-function of the G protein-coupled receptor superfamily. Annu Rev Pharmacol Toxicol 53: 531–556.
Kenakin TP (2012). Biased signaling and allosteric machines: new vistas and challenges for drug discovery. Br J Pharmacol 165: 1659–1669.
Kilpatrick LE, Briddon SJ, Hill SJ, Holliday ND (2010). Quantitative analysis of neuropeptide Y receptor association with beta-arrestin2 measured by bimolecular fluorescence complementation. Br J Pharmacol 160: 892–906.
Lefkowitz RJ, Shenoy SK (2005). Transduction of receptor signals by beta-arrestins. Science 308: 512–517.
Marie J, Richard E, Pruneau D, Paquet JL, Siatka C, Larguier Ret al. (2001). Control of conformational equilibria in the human B2 bradykinin receptor: modeling of nonpeptidic ligand action and comparison to the rhodopsin structure. J Biol Chem 276: 41100–41111.
Morell M, Espargaro A, Aviles FX, Ventura S (2007). Detection of transient protein-protein interactions by bimolecular fluorescence complementation: the Abl-SH3 case. Proteomics 7: 1023–1036.
Moukhametzianov R, Warne T, Edwards PC, Serrano-Vega MJ, Leslie AGW, Tate CGet al. (2011). Two distinct conformations of helix 6 observed in antagonist-bound structures of aβ1-adrenergic receptor. Proc Natl Acad Sci 108: 8228–8232.
Mullershausen F, Zecri F, Cetin C, Billich A, Guerini D, Seuwen K (2009). Persistent signaling induced by FTY720-phosphate is mediated by internalized S1P1 receptors. Nat Chem Biol 5: 428–434.
Nygaard R, Frimurer TM, Holst B, Rosenkilde MM, Schwartz TW (2009). Ligand binding and micro-switches in 7TM receptor structures. Trends Pharmacol Sci 30: 249–259.
Pellissier LP, Sallander J, Campillo M, Gaven F, Queffeulou E, Pillot Met al. (2009). Conformational toggle switches implicated in basal constitutive and agonist-induced activated states of
5-hydroxytryptamine-4 receptors. Mol Pharmacol 75: 982–990.
Rasmussen SGF, Choi H-J, Fung JJ, Pardon E, Casarosa P, Chae PS et al. (2011). Structure of a nanobody-stabilized active state of the beta(2) adrenoceptor. Nature 469: 175–180.
Ridge KD, Bhattacharya S, Nakayama TA, Khorana HG (1992). Light stable rhodopsin. II. An opsin mutant (TRP-265-PHE) and a retinal analogue with a nonisomerizable II-cis configuration form a photostable chromophore. J Biol Chem 267: 6770–6775.
Rose RH, Briddon SJ, Holliday ND (2010). Bimolecular fluorescence complementation: lighting up seven transmembrane domain receptor signalling networks. Br J Pharmacol 159: 738–750.
Schulte G, Fredholm BB (2002). Signaling pathway from the human adenosine A(3) receptor expressed in Chinese hamster ovary cells to the extracellular signal-regulated kinase 1/2. Mol Pharmacol 62: 1137–1146.
Schwartz TW, Frimurer TM, Holst B, Rosenkilde MM, Elling CE (2006). Molecular mechanism of 7TM receptor activation – a global toggle switch model. Annu Rev Pharmacol Toxicol 46: 481–519.
Shi L, Liapakis G, Xu R, Guarnieri F, Ballesteros JA, Javitch JA (2002).β2 adrenergic receptor activation. J Biol Chem 277: 40989–40996.
Shukla AK, Violin JD, Whalen EJ, Gesty-Palmer D, Shenoy SK, Lefkowitz RJ (2008). Distinct conformational changes in beta-arrestin report biased agonism at seven-transmembrane receptors. Proc Natl Acad Sci 105: 9988–9993.
Stoddart LA, Vernall AJ, Denman JL, Briddon SJ, Kellam B, Hill SJ (2012). Fragment screening at adenosine-A(3) receptors in living cells using a fluorescence-based binding assay. Chem Biol 19: 1105–1115.
Tate CG, Schertler GFX (2009). Engineering G protein-coupled receptors to facilitate their structure determination. Curr Opin Struct Biol 19: 386–395.
astrocytoma cells: agonist-mediated desensitization, internalization, and down-regulation. Mol Pharmacol 62: 1373–1384.
Venkatakrishnan AJ, Deupi X, Lenon G, Tate CG, Schertler GF, Babu MM (2013). Molecular signatures of G-protein-coupled receptors. Nature 494: 185–194.
Watson S-J, Brown AJH, Holliday ND (2012). Differential signaling by splice variants of the human free fatty acid receptor GPR120. Mol Pharmacol 81: 631–642.
Wei HJ, Ahn S, Shenoy SK, Karnik SS, Hunyady L, Luttrell LMet al. (2003). Independent beta-arrestin 2 and G protein-mediated pathways for angiotensin II activation of extracellular signal-regulated kinases 1 and 2. Proc Natl Acad Sci 100: 10782–10787.
Werthmann RC, Volpe S, Lohse MJ, Calebiro D (2012). Persistent cAMP signaling by internalized TSH receptors occurs in thyroid but not in HEK293 cells. FASEB J 26: 2043–2048.
Wess J, Nanavati S, Vogel Z, Maggio R (1993). Functional role of proline and tryptophan residues highly conserved amount G protein-coupled receptors studied by mutational analysis of the M3 muscarinic receptor. EMBO J 12: 331–338.
Whalen EJ, Rajagopal S, Lefkowitz RJ (2011). Therapeutic potential of beta-arrestin- and G protein-biased agonists. Trends Mol Med 17: 126–139.
Wisler JW, DeWire SM, Whalen EJ, Violin JD, Drake MT, Ahn S et al. (2007). A unique mechanism ofβblocker action: carvedilol stimulatesβ-arrestin signaling. Proc Natl Acad Sci 104:
16657–16662.
Xu F, Wu HX, Katritch V, Han GW, Jacobson KA, Gao ZGet al. (2011). Structure of an agonist-bound human A(2A) adenosine receptor. Science 332: 322–327.
Yao XJ, Parnot C, Deupi X, Ratnala VRP, Swaminath G, Farrens D et al. (2006). Coupling ligand structure to specific conformational switches in the beta(2)-adrenoceptor. Nat Chem Biol 2: 417–422.
Supporting information
Additional Supporting Information may be found in the online version of this article at the publisher’s web-site:
http://dx.doi.org/10.1111/bph.12739
Figure S1Internalization of SNAP-labelled A3and A3W243F.
Confocal images of cells transiently expressing SNAP-A3(top
panels) and SNAP-A3 W243F (bottom panels) and labelled
with SNAP-surface BG-AF488 were obtained in the absence of agonist (left-hand panels), and both receptors showed pre-dominately membrane expression. After a 30 min treatment with 10μM NECA (middle panels) or 10μM HEMADO (right hand panels), fluorescent granules were observed within both SNAP-A3- and SNAP-A3 W243F-expressing cells upon NECA
treatment with granules only observed with in HEMADO treated SNAP-A3 cells. Images are representative of those
obtained in three separate experiments.
Figure S2 Measuring CA200645 affinity at A3-YFP and A3
W243F-YFP. A3-YFP- (A) or A3W243F-YFP-expressing (B) cells
were treated with increasing concentrations of the agonist NECA after pretreatment with (open circles) or without (closed circles) 25 nM of the fluorescent antagonist CA200645. Cells were fixed and images were collected on the IX Ultra confocal plate reader and automated granularity analysis performed on the resulting images. Data were nor-malized to basal (absence of NECA) and 10μM NECA responses for each cell line. Each data point represents mean
± SEM from five experiments performed in triplicate. Gaddum analysis of the CA200645-induced shift in the NECA concentration-response curves was performed and the calcu-lated pKBof CA200645 for A3-YFP was 7.82±0.13 and 7.81±