Research Article
Development and Validation of Protein
Microarray Technology for Simultaneous Inflammatory
Mediator Detection in Human Sera
Senthooran Selvarajah,
1,2Ola H. Negm,
1,3Mohamed R. Hamed,
1,3Carolyn Tubby,
1Ian Todd,
1Patrick J. Tighe,
1Tim Harrison,
4and Lucy C. Fairclough
11School of Life Sciences, The University of Nottingham, A Floor West Block, Queen’s Medical Centre, Nottingham NG7 2UH, UK 2Roche Products Limited, 6 Falcon Way, Shire Park, Welwyn Garden City AL7 1TW, UK
3Medical Microbiology and Immunology Department, Faculty of Medicine, Mansoura University, Mansoura 35516, Egypt 4Nottingham Respiratory Research, University of Nottingham Clinical Sciences Building, City Hospital Campus,
Nottingham NG5 1PB, UK
Correspondence should be addressed to Lucy C. Fairclough; [email protected]
Received 20 May 2014; Revised 8 September 2014; Accepted 8 September 2014; Published 14 October 2014
Academic Editor: Vera L. Petricevich
Copyright © 2014 Senthooran Selvarajah et al. This is an open access article distributed under the Creative Commons Attribution License, which permits unrestricted use, distribution, and reproduction in any medium, provided the original work is properly cited.
Biomarkers, including cytokines, can help in the diagnosis, prognosis, and prediction of treatment response across a wide range of disease settings. Consequently, the recent emergence of protein microarray technology, which is able to quantify a range of inflammatory mediators in a large number of samples simultaneously, has become highly desirable. However, the cost of commercial systems remains somewhat prohibitive. Here we show the development, validation, and implementation of an in-house microarray platform which enables the simultaneous quantitative analysis of multiple protein biomarkers. The accuracy and precision of the in-house microarray system were investigated according to the Food and Drug Administration (FDA) guidelines for pharmacokinetic assay validation. The assay fell within these limits for all but the very low-abundant cytokines, such as interleukin- (IL-) 10. Additionally, there were no significant differences between cytokine detection using our microarray system and the “gold standard” ELISA format. Crucially, future biomarker detection need not be limited to the 16 cytokines shown here but could be expanded as required. In conclusion, we detail a bespoke protein microarray system, utilizing well-validated ELISA reagents, that allows accurate, precise, and reproducible multiplexed biomarker quantification, comparable with commercial ELISA, and allowing customization beyond that of similar commercial microarrays.
1. Introduction
A biological marker, or “biomarker,” is a quantifiable charac-teristic that, when measured, may indicate normal biological processes, a pathogenic state, or a pharmacological response
to a therapy [1]. As such, biomarker identification may help
to diagnose disease, aid in the prognosis of disease, and/or help to predict treatment outcome. DNA, RNA, proteins, cytokines, and chemokines can all act as biomarkers, sources of which include local tissue, peripheral blood, and urine
(reviewed in [2]).
Cytokine biomarkers play an important role in a vast range of diseases. These include but are not limited to
interferon-𝛾(IFN-𝛾) and IFN-𝛾-induced protein 10 (IP-10) in
Mycobacterium tuberculosis, which can aid in the diagnosis of
disease, as well as vaccine-induced protection [3,4]; CCL2 in
HIV infection, which correlates with viral load [5]; tumour
necrosis factor-𝛼(TNF-𝛼), interleukin (IL)-1𝛽, and IL-6 in
heart failure, which are associated with more severe disease
and adverse outcome [6,7]; and TNF-𝛼 and IL-6 in major
depressive disorder, which correlate to poor antidepressant
response [8,9].
The enzyme-linked immunosorbent assay (ELISA) is the traditional method of accurately quantifying cytokine levels. This can be performed with high sensitivity and specificity. However, it is limited by the fact that only
one cytokine can be measured at a time [10]. However,
protein microarrays have recently evolved as a promising
tool for quantifying proteins in biological samples [11,12]. A
protein microarray is, in many ways, a miniaturised version of a sandwich ELISA. Quantifying cytokine abundance by microarray typically involves printing capture antibody onto a coated glass slide and incubating with a serum sample. As with sandwich ELISA, target specificity is maximized through the use of paired sets of capture and detection antibodies, which bind to the same antigen via separate epitopes. In contrast to ELISAs, microarrays have the ability to evaluate multiple cytokines simultaneously. They require smaller sample volumes than ELISAs, are more sensitive,
and have a greater dynamic range [13]. These factors make
microarrays a cheaper and potentially favourable alternative to ELISAs for the large-scale detection of known proteins
(reviewed in [14]).
In order to utilise microarray technology, factors such as slide surface; printing settings; print, wash, and block-ing buffers; and detection methods must be optimised. In addition, multiplexing requires a further optimization above and beyond that performed for singleplex ELISAs and that of testing for cross-reactivity between the different capture and detection antibodies, reporter, and antigen targets. This is typically performed in a checkerboard or matrix experi-ment where each combination is tested as a monoplex of a specific antigen processed against the entire panel of capture antibodies and all detection antibodies. Following this, results must be shown to be reproducible and be validated against the established “gold standard,” the ELISA. As there are currently no guidelines for protein microarray biomarker assay development, reproducibility standards for this work were based on the Food and Drug Administration (FDA) guidelines for pharmacokinetic assay validation. These are
80–120% for accuracy and<20% coefficient of variation (CV)
for precision [15].
In this study, the objective was to develop and vali-date a microarray platform to simultaneously quantify 16 biomarkers in the sera. The biomarkers were eotaxin-1,
eotaxin-2, IFN-𝛾, IL-1𝛽, 4, 6, 8, 10, 17,
IL-23, IP-10, monocyte chemotactic protein-1 (MCP-1), receptor for advanced glycation end-products (RAGE), transforming
growth factor-𝛽(TGF-𝛽), TNF-𝛼, and vascular endothelial
growth factor (VEGF). A direct comparison of ELISA and protein microarray was performed on 30 human sera as an integral part of the comprehensive validation of the microarray technique.
2. Methods
2.1. Serum Samples. The University of Nottingham Medical
School Ethics Committee approved the study protocol and written informed consent was obtained from the 30 healthy participants before entering the study. Peripheral blood
(10 mL) was collected in SST vacutainer tubes (BD); the
serum was isolated and stored at−20∘C.
2.2. Microarray Protocol. DuoSet paired antibody kits (R&D
Systems, Minneapolis, MN) were used for the detection of 16
cytokines: eotaxin-1, eotaxin-2, IFN-𝛾, IL-1𝛽, IL-4, IL-6, IL-8,
IL-10, IL-17, IL-23, IP-10, MCP-1, RAGE, TGF-𝛽, TNF-𝛼, and
VEGF. Each capture antibody diluted to 100𝜇g/mL in
PBS-Trehalose (Dulbeccos’s phosphate buffered saline containing 50 mM D-(+) Trehalose) was loaded onto a 384-well plate (Genetix) and printed in in four sets of triplicate spots in a
16×16 array format onto a poly-l-lysine-coated glass slide
(Thermofisher, UK) using a Biorobotics Microgrid II arrayer (Microgrid) and a silicon contact pin (Parallel Synthesis Technologies, USA). During printing, the array chamber was
set to 60% humidity at 20∘C, and the spot diameter was
315𝜇m. Printed slides were left on the arrayer overnight,
with the humidity turned off, and processed the next day. Parameters for the optimization of the protocol presented
here are taken from Selvarajah, 2013 [16].
Slides were blocked with PBS-BSA (PBS containing 3% BSA; Sigma) for one hour and washed three times with PBS-Tween (PBs containing 0.05% Tween-20) wash buffer. A cocktail of recombinant protein standards was prepared containing each cytokine at a maximum recommended con-centration for standard curve generation, according to man-ufacturers instructions (R&D Systems, Minneapolis, MN). The cocktail of standards was diluted twofold across eight
dilutions and 50𝜇L added to each block for 45 minutes.
Slides were washed as above, and 50𝜇L of an appropriately
diluted cocktail of biotinylated detection antibodies, each at the manufacturers recommended concentration, was added
to each block for 45 minutes. Following another wash, 50𝜇L
of 1 : 1000 diluted streptavidin-HRP (Opti-4CN amplification kit, #170-8238 Bio-Rad, USA) was added to each block and slides stored in the dark for 15 minutes. After further washing,
50𝜇L of Bio-Rad amplification reagent (BAR, Opti-4CN
amplification kit) was added to each block and slides were stored in the dark for 10 minutes. The slides were washed three times with PBS Tween containing 20% DMSO (v/v)
and three times with wash buffer. Following this, 50𝜇L of
1 : 1000 diluted streptavidin-conjugated Cy5 (final
concentra-tion 0.2𝜇g/mL in wash buffer: #19-4317 E-Biosciences, UK)
was added to each block and the slides were stored in the dark for 15 minutes. After a final wash, slides were rinsed in ultra-pure water and dried by centrifugation. Slides were scanned at 635 nm and the data analysed using the GenePix Pro Software (Axon GenePix). Briefly, the median local background was subtracted from the median fluorescence of each spot and the corrected fluorescence was used to calculate the average fluorescence signal as well as the standard deviation. Unless stated otherwise, all incubation steps were performed at room temperature. The experiment was repeated at least twice for each biomarker.
PBS spike
Standard curve Spiked PBS
8 16 32 64 128 256 512 1024 2048
Concentration (pg/mL) 512
1024 2048 4096 8192 16384 32768 65536
Arb
it
ra
ry
fl
u
o
res
cence uni
ts
751.19(750)
183.94(180)
20.1(22)
(a)
Serum spike
Standard curve Spiked serum Control serum
4 8 16 32 64 128 256 512 1024 2048
32 64 128 256 512 1024 2048 4096 8192 16384 32768
Arb
it
ra
ry
fl
u
o
res
cence uni
ts
Concentration (pg/mL) 750
188
22
30.4
191.2
755.4
[image:3.600.68.540.74.313.2](b)
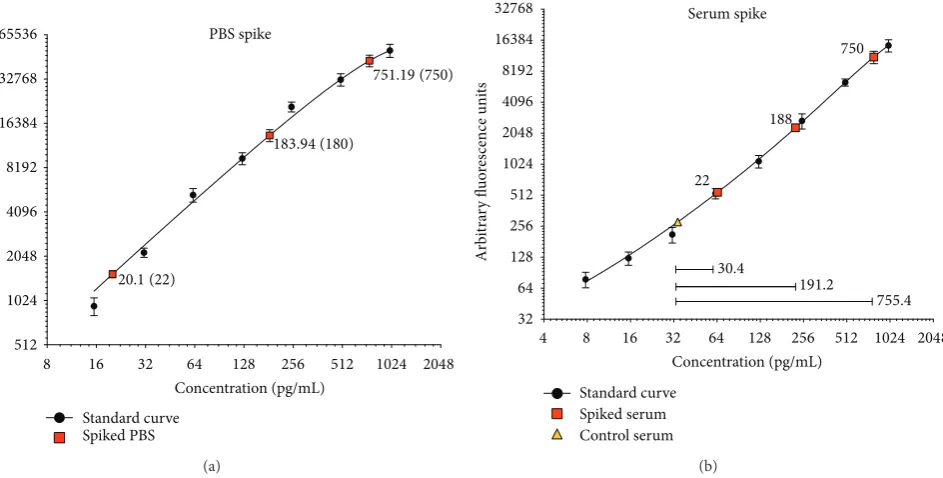
Figure 1: Microarray validation using spiked PBS and serum samples. (a) PBS was spiked with three known concentrations of protein: 22 pg/mL, 188 pg/mL, and 750 pg/mL. Standard curves were used to calculate the observed concentration in the PBS. Representative data for RAGE is shown. (b) The serum protein levels of biomarkers were quantified prior (triangle) to and after (squares) the addition of three known concentrations of cytokine (22 pg/mL, 188 pg/mL, and 750 pg/mL), by microarray. Standard curves were used to calculate the observed concentration differences between the control (nonspiked) and spiked serum samples (closed bars). The three inserted horizontal lines and numerical values in (b) indicate the difference between the quantified target level detected in control and spiked serum samples, that is, the difference due to the addition of the spike in each case. Representative data for VEGF is shown.
concentrations were spiked into PBS, while in the second experiment, the biomarkers were spiked into healthy donor serum, to identify if serum proteins had any detrimental effects on the assay system. Accuracy (%) was calculated based on the observed concentration measured against the expected concentration.
To determine the precision of the microarray platform, intra- and interassay comparisons were performed for all 16 biomarkers in the sera of up to 30 healthy volunteers. Intra-assay comparisons were performed sixteen times on the same slide simultaneously, while interassay comparisons were performed on different slides over a period of three consecutive days. The mean of the replicates and standard deviation were used to calculate the coefficients of variation (CV) of the microarray methodology. Significant differences between the variability of low-, mid-, and high-abundance cytokines were determined using the Kruskal-Wallis test and the post hoc Dunn’s multiple comparison test.
2.3. ELISA Protocol. ELISAs were performed using R&D
Systems DuoSet paired antibody kits (as per the microarray work) according to the manufacturer’s instructions. Briefly,
plates were coated with 1–4𝜇g/mL of capture antibody and
stored overnight. The plates were washed three times with 0.05% PBS-Tween (Sigma) and blocked with reagent diluent (1% BSA in PBS) for one hour. Following three washes as above, standards (prepared in reagent diluent in twofold
dilutions, according to kit instructions) were added at 100𝜇L
per well in duplicate and the plate was incubated for two
hours. The plate was washed and incubated with 100𝜇L of
appropriately diluted biotinylated detection antibody per well
for a further two hours. After washing as above, 100𝜇L of
diluted streptavidin-HRP was added to each well and the plate was stored for 30 minutes in the dark. After a final wash, the plate was developed using the enzyme substrate peroxidase chromogen. After 30 minutes of incubation, the
reaction was stopped by adding 50𝜇L of 0.18 M H2SO4per
well and the absorbance read at 450 nm. All incubations steps were performed at room temperature.
3. Results
3.1. Microarray Validation. A microarray technique was
developed to enable the quantification of 16 cytokine biomarkers in human sera. A series of validation tests were performed to ensure the reproducibility and accuracy of this technique. In the first instance, PBS (representative data
for RAGE shown inFigure 1(a)) and serum (representative
data for VEGF shown in Figure 1(b)) were spiked with
three known concentrations of protein: 22 pg/mL, 188 pg/mL, and 750 pg/mL. The pre- and post-serum spike protein concentrations were quantified using a protein standard
curve specific for each biomarker (Figure 1(b)). Serum was
lower background signal achieved with serum, relative to plasma for these microarrays (data not shown). BSA was our preferred blocking buffer for all experiments; 1% I-Block (purified casein) performs equally well (results not shown), but BSA is preferred due to cost and ease of preparation.
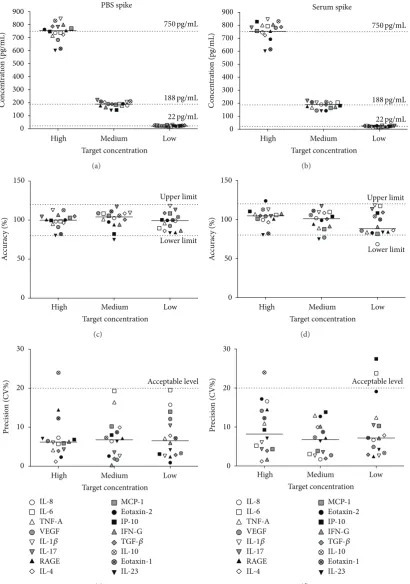
The accuracy and precision values of the microarray
assay were then calculated from these data (Figure 2).
The postspike observed values for the 16 biomarkers and expected values (dashed lines) of the biomarkers are shown
in Figures2(a) and 2(b). All but two of the high
concen-tration spikes (750 pg/mL) were within 10% of the expected value, whereas all of the mid- and low-concentration spikes (22 pg/mL and 188 pg/mL) were within this range for the PBS
spike (Figure 2(a)). The same was observed for the serum
spike (Figure 2(b)). The observed mean protein values were
within the acceptable criteria of accuracy (80–120%) for the vast majority of cytokines of the three spike concentrations
(Figures2(c)and2(d)). The same was true for the acceptable
level of precision (<20% CV, Figures2(e)and2(f)).
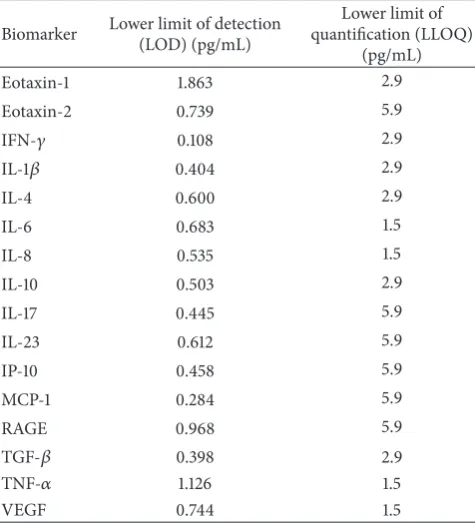
3.2. Microarray Limits of Detection and Quantification. The
limits of sensitivity of the assay were measured using the lower limit of detection (LOD) and the lower and upper
limits of quantification (LLOQ and ULOQ, resp.) [17]. The
lower limit of detection (LOD) is the concentration of the biomarker required to give a signal equal to the background (blank) plus three times the standard deviation of the blank; the lower limit of quantification (LLOQ) is twice the level of the LOD or the point where the CV falls below 20%, whichever is highest. The lower limits of detection and
quantification for the microarray assay are shown inTable 1.
For the 16 biomarkers investigated, LOD values ranged from 0.284 to 1.9 pg/mL and LLOQ values ranged from 1.5 to 5.9 pg/mL. The upper limit of quantification (ULOQ) is the point at which the calculated precision does not exceed 15% of the CV and the accuracy is within 15% of the expected
concentration [18] and this ranged from 750 to 1900 pg/mL
for the 16 biomarkers tested (data not shown).
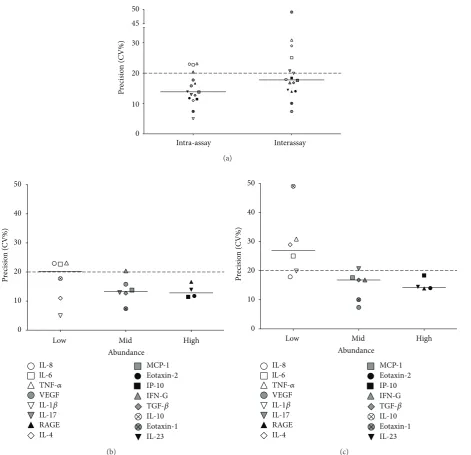
3.3. Microarray Intra- and Interassay Precision. The
microar-ray intra- and interassay variability, using the sera of up to
30 healthy volunteers, is shown inFigure 3. Three sets of two
slides, containing 16 arrays per slide, were used for intra- and interassay variation testing. Identical samples were used on each set of two slides, at three independent time points. In the case of intra-assay variation, 13 of 16 biomarkers were within
the acceptable limits of precision (<20% CV). When looking
at interassay variation, 11 out of the 16 biomarkers were within
the acceptable limits (Figure 3(a)).
The cytokine biomarkers were then subdivided into three groups, depending on their serum abundance, and each was analysed separately for intra- and interassay precision
(Figures3(b)and3(c), resp.). Low-abundance cytokines were
defined as those with a serum concentration of≤50 pg/mL
and were IL-1𝛽, IL-4, IL-6, IL-8, IL-10, and TNF-𝛼;
mid-abundance cytokines, with a serum concentration of 51–
199 pg/mL, were eotaxin-1, IL-17, IFN-𝛾, MCP-1, TGF-𝛽, and
[image:4.600.310.548.90.352.2]VEGF; and high-abundance cytokines (serum concentration
Table 1: Microarray lower limits of detection and quantification.
Biomarker Lower limit of detection
(LOD) (pg/mL)
Lower limit of quantification (LLOQ)
(pg/mL)
Eotaxin-1 1.863 2.9
Eotaxin-2 0.739 5.9
IFN-𝛾 0.108 2.9
IL-1𝛽 0.404 2.9
IL-4 0.600 2.9
IL-6 0.683 1.5
IL-8 0.535 1.5
IL-10 0.503 2.9
IL-17 0.445 5.9
IL-23 0.612 5.9
IP-10 0.458 5.9
MCP-1 0.284 5.9
RAGE 0.968 5.9
TGF-𝛽 0.398 2.9
TNF-𝛼 1.126 1.5
VEGF 0.744 1.5
The lower limit of detection (LOD) is the concentration of biomarker required to give a signal that is equal to the background (blank) plus three times the standard deviation of the blank. The lower limit of quantification (LLOQ) is twice the LOD value or the point where the coefficient of variation (CV), a measure of precision, falls below 20%, whichever is highest [17].
≥200 pg/mL) were eotaxin-2, IL-23, IP-10, and RAGE. The
precision values for 5 out of 6 mid-abundance cytokines and all four high-abundance cytokines were within the acceptable level of precision for both intra- and interassay variation. When looking at low-abundance cytokines, however, the median precision value for the intra-assay variation was on the limit of acceptable precision, with 3 cytokines outside the acceptable limit. As for the interassay variation, only one cytokine was within the acceptable level of precision and the median value for these low-abundance cytokines was outside the acceptable limits of precision.
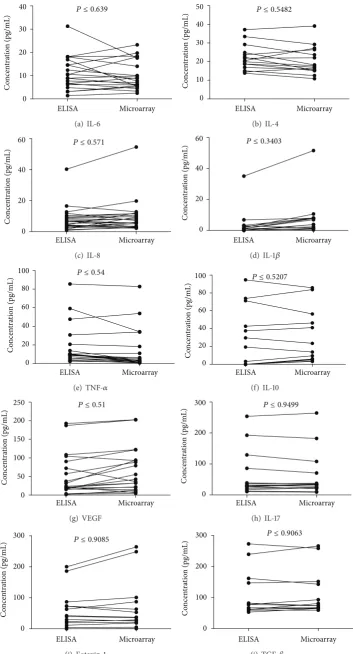
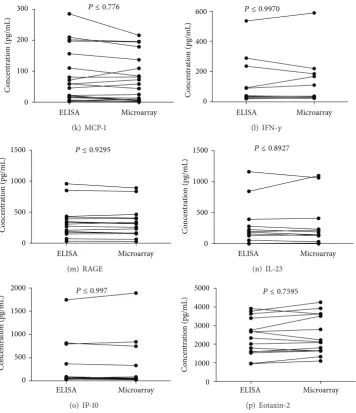
3.4. Correlation between Microarray and ELISA Cytokine
Detection Levels. The serum levels of the 16 cytokine
biomarkers were quantified from 30 healthy individuals using both ELISA and the in-house microarray system; and the
two detection methods were compared using pairedt-tests
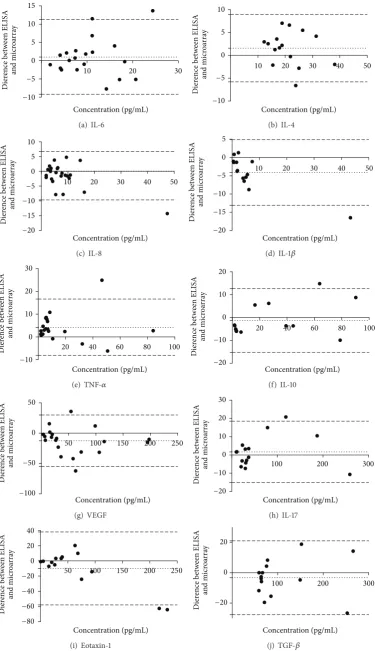
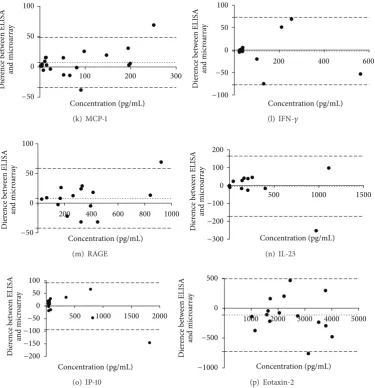
(Figure 4) and visually represented in Bland-Altman plots
(Figure 5). There were no significant differences in the level
of cytokines detected by the two assays, for any of the
16 cytokines (P values ranged from 0.3404 to 0.997). This
highlights the agreement between the two detection methods; in concordance with this, bias in favour of either technique
was negligible (Figure 5). Furthermore, for less-abundant
cytokines, such as IL-1𝛽, the microarray platform appeared
High Medium Low 0
100 200 300 400 500 600 700 800 900
Target concentration
C
o
ncen
tra
tio
n (pg/mL)
750pg/mL
188pg/mL
22pg/mL PBS spike
(a)
Serum spike
High Medium Low
Target concentration 0
100 200 300 400 500 600 700 800 900
C
o
ncen
tra
tio
n (pg/mL)
750pg/mL
188pg/mL
22pg/mL
(b)
0 50 100 150
A
cc
urac
y (%)
Upper limit
Lower limit
High Medium Low
Target concentration
(c)
0 50 100 150
A
cc
urac
y (%)
High Medium Low
Target concentration
Upper limit
Lower limit
(d)
0 10 20 30
P
recisio
n (CV%)
Acceptable level
IL-8
IL-6
TNF-A VEGF
MCP-1
Eotaxin-2
IP-10
IFN-G
IL-1𝛽
IL-17
RAGE
IL-4
TGF-𝛽
IL-10
Eotaxin-1
IL-23
High Medium Low
Target concentration
(e)
0 10 20 30
P
recisio
n (CV%)
Acceptable level
IL-8
IL-6
TNF-A VEGF
MCP-1
Eotaxin-2
IP-10
IFN-G
IL-1𝛽
IL-17
RAGE
IL-4
TGF-𝛽
IL-10
Eotaxin-1
IL-23
High Medium Low
Target concentration
[image:5.600.96.507.73.658.2](f)
Figure 2: Microarray accuracy and precision of cytokine detection. PBS (a) and serum (b) spike experiments were performed for 16 cytokines at three known concentrations (22 pg/mL, 188 pg/mL, and 750 pg/mL). The expected (dashed lines) and observed concentration differences from these spiked experiments were determined by microarray. The accuracy of microarray cytokine detection was calculated for PBS (c) and serum (d) at each spike concentration. The majority of data fell within the acceptable limits of 80–120% accuracy, as outlined by the FDA
[15]. The precision of microarray cytokine detection in PBS (e) and serum (f) spike experiments was also calculated. Again, the majority of
Intra-assay Interassay 0
10 20 30 45 50
P
recisio
n (CV%)
(a)
Low Mid High
0 10 20 30 40 50
P
recisio
n (CV%)
Abundance
Eotaxin-2
IFN-G
IL-17
RAGE
TGF-𝛽
IL-10
Eotaxin-1
IL-23
IL-8
lL-6
TNF-𝛼
VEGF
MCP-1
IL-1𝛽
IL-4
IP-10
(b)
0 10 20 30 40 50
P
recisio
n (CV%)
Low Mid High
Abundance
Eotaxin-2
IFN-G
IL-17
RAGE
TGF-𝛽
IL-10
Eotaxin-1
IL-23
IL-8
lL-6
TNF-𝛼
VEGF
MCP-1
IL-1𝛽
IL-4
IP-10
[image:6.600.70.542.69.524.2](c)
Figure 3: Microarray intra- and interassay precision. The intra- and interassay precision of microarray cytokine detection was calculated (a).
Experiments to measure intra-assay precision were conducted on the same slide (𝑛 = 15arrays), while those to measure interassay precision
were performed on three consecutive days (𝑛 = 30arrays per time point). The median precision values for intra- and interassay variation
were within the acceptable limit of 20% coefficient of variation (CV), akin to the majority of individual cytokines. Cytokines were divided into
low-abundance (<50 pg/mL), mid-abundance (51–199 pg/mL), and high-abundance (>200 pg/mL) groups for intra- and interassay variation
((b) and (c), resp.). All high-abundance cytokines, along with all but one mid-abundance cytokine, showed acceptable levels of intra- and interassay variation. The majority of low-abundance cytokines showed unacceptable interassay variation.
4. Discussion
Biomarkers can be very helpful in the diagnosis of disease, aid in the prognosis of disease, and/or help to predict treatment outcome. As a result, efforts to identify and quantify biomarkers have increased substantially in recent years. However, access to commercial protein microarray platforms is expensive and makes them unattainable for
most [19]. Further adding to the problem is a lack of
comprehensive guidelines for microarray protein biomarker validation studies. In this study, we validated our in-house sandwich microarray according to the FDA guidelines for pharmacokinetic assays.
ELISA Microarray 0
10 20 30
40 P ≤ 0.639
C
o
ncen
tra
tio
n (pg/mL)
(a) IL-6
ELISA Microarray
C
o
ncen
tra
tio
n (pg/mL)
0 10 20 30 40
50 P ≤ 0.5482
(b) IL-4
0
20 40
60 P ≤ 0.571
ELISA Microarray
C
o
ncen
tra
tio
n (pg/mL)
(c) IL-8
C
o
ncen
tra
tio
n (pg/mL)
0 20 40
60 P ≤ 0.3403
ELISA Microarray
(d) IL-1𝛽
C
o
ncen
tra
tio
n (pg/mL)
0 20 40 60 80
100 P ≤ 0.54
ELISA Microarray
(e) TNF-𝛼
C
o
ncen
tra
tio
n (pg/mL)
0 20 40 60 80
100 P ≤ 0.5207
ELISA Microarray
(f) IL-10
C
o
ncen
tra
tio
n (pg/mL)
0 50 100 150 200
250 P ≤ 0.51
ELISA Microarray
(g) VEGF
C
o
ncen
tra
tio
n (pg/mL)
0 100 200
300 P ≤ 0.9499
ELISA Microarray
(h) IL-17
C
o
ncen
tra
tio
n (pg/mL)
0 100 200
300 P ≤ 0.9085
ELISA Microarray
(i) Eotaxin-1
C
o
ncen
tra
tio
n (pg/mL)
0 100 200
300 P ≤ 0.9063
ELISA Microarray
[image:7.600.123.477.71.726.2](j) TGF-𝛽
C
o
ncen
tra
tio
n (pg/mL)
0 100 200
300 P ≤ 0.776
ELISA Microarray
(k) MCP-1
C
o
ncen
tra
tio
n (pg/mL)
0 200 400
600 P ≤ 0.9970
ELISA Microarray
(l) IFN-𝛾
C
o
ncen
tra
tio
n (pg/mL)
0 500 1000
1500 P ≤ 0.9295
ELISA Microarray
(m) RAGE
C
o
ncen
tra
tio
n (pg/mL)
0 500 1000
1500 P ≤ 0.8927
ELISA Microarray
(n) IL-23
C
o
ncen
tra
tio
n (pg/mL)
0 500 1000 1500
2000 P ≤ 0.997
ELISA Microarray
(o) IP-10
C
o
ncen
tra
tio
n (pg/mL)
0 1000 2000 3000 4000
5000 P ≤ 0.7595
ELISA Microarray
[image:8.600.123.480.71.485.2](p) Eotaxin-2
Figure 4: Correlation between microarray and ELISA cytokine detection levels. The levels of 16 cytokines were quantified by microarray and
ELISA techniques in up to 30 human serum samples. Pairedt-tests showed there were no significant differences between the two techniques
for any of the cytokines tested. The 16 cytokines were eotaxin-1, eotaxin-2, IFN-𝛾, IL-1𝛽, IL-4, IL-6, IL-8, IL-10, IL-17, IL-23, IP-10, MCP-1,
RAGE, TGF-𝛽, TNF-𝛼, and VEGF.
80 to 120% accuracy and <20% CV precision. This was
in accordance with published literature [20–24].
Addition-ally, microarray intra- and interassay precision values were deemed acceptable for nine out of ten mid- and high-abundance cytokines, with the tenth being on the borderline of acceptability. As might be expected, there was a greater level of interassay variation compared to intra-assay variation and in low-abundance cytokines, such as IL-10, compared to mid- and high-abundance cytokines.
The limits of quantification are defined as the lowest and highest points in an assay that can be detected and quantified to an acceptable level of accuracy and precision. The microarray platform proved to be superior in sensitivity and has the advantage of detecting the lowest concentrations
of cytokines [25, 26]. Whilst the LOD shown here is very
low (less than 1 pg/mL for most of the examined cytokines), often it is not chosen as the limit to measure proteins in biological samples, as at this concentration there is a higher degree of variability between samples and thus the LLOQ is preferred when using microarray technology as the lowest analyte concentration that can be quantified to an acceptable level with both accuracy and precision.
Decisively, no significant differences were found between serum cytokine levels detected by microarray and the ELISA,
the “gold standard” in immunoassays [27,28], showing the
two techniques to be comparable. However, for some
low-abundance biomarkers, such as IL-1𝛽and IL-6, there was less
agreement between techniques. Interestingly, this may be due to the greater sensitivity of the microarray detection format
10 20 30 −10 −5 0 5 10 15 Concentration (pg/mL) Dier ence b etw een ELISA an d micr oa rr ay (a) IL-6
10 20 30 40 50
−10 −5 0 5 10 Concentration (pg/mL) Dier ence b etw een ELISA an d micr oa rr ay (b) IL-4 −20 −15 −10 −5 0 5 10
10 20 30 40 50
Concentration (pg/mL) Dier ence b etw een ELISA an d micr oa rr ay (c) IL-8
10 20 30 40 50
−20 −15 −10 −5 0 5 Concentration (pg/mL) Dier ence b etw een ELISA an d micr oa rr ay
(d) IL-1𝛽
20 40 60 80 100
−10 0 10 20 30 Concentration (pg/mL) Dier ence b etw een ELISA an d micr oa rr ay
(e) TNF-𝛼
20 40 60 80 100
−20 −10 0 10 20 Concentration (pg/mL) Dier ence b etw een ELISA an d micr oa rr ay (f) IL-10
50 100 150 200 250
−100 −50 0 50 Concentration (pg/mL) Dier ence b etw een ELISA an d micr oa rr ay (g) VEGF
100 200 300
−20 −10 0 10 20 30 Concentration (pg/mL) Dier ence b etw een ELISA an d micr oa rr ay (h) IL-17
50 100 150 200 250
−80 −60 −40 −20 0 20 40 Concentration (pg/mL) Dier ence b etw een ELISA an d micr oa rr ay (i) Eotaxin-1
100 200 300
−20 0 20 Concentration (pg/mL) Dier ence b etw een ELISA an d micr oa rr ay
[image:9.600.113.489.72.724.2](j) TGF-𝛽
100 200 300
−50 0 50 100
Concentration (pg/mL)
Dier
ence b
etw
een ELISA
an
d micr
oa
rr
ay
(k) MCP-1
200 400 600
−100 −50 0 50 100
Concentration (pg/mL)
Dier
ence b
etw
een ELISA
an
d micr
oa
rr
ay
(l) IFN-𝛾
200 400 600 800 1000
−50 0 50 100
Concentration (pg/mL)
Dier
ence b
etw
een ELISA
an
d micr
oa
rr
ay
(m) RAGE
500 1000 1500
−300 −200 −100 0 100 200
Concentration (pg/mL)
Dier
ence b
etw
een ELISA
an
d micr
oa
rr
ay
(n) IL-23
500 1000 1500 2000
−200 −150 −100 −50 0 50 100
Concentration (pg/mL)
Dier
ence b
etw
een ELISA
an
d micr
oa
rr
ay
(o) IP-10
1000 2000 3000 4000 5000
−1000 −500 0 500
Concentration (pg/mL)
Dier
ence b
etw
een ELISA
an
d micr
oa
rr
ay
[image:10.600.113.489.73.462.2](p) Eotaxin-2
Figure 5: Bland Altman plots to compare ELISA and microarray. The acceptable level of bias is dictated by the thin dotted line on either side of zero. The dashed lines represent the 95% limits of agreement as the mean difference (2 SD). The differences between ELISA and microarray
estimations show a notable advantage of the microarray technique in sensitivity especially for the low-abundance cytokines, such as IL-1𝛽
and IL-6.
a range of many 10,000 s of fluorescence arbitrary units, compared to the discrete 0 to 3 optical density scale available in ELISAs.
One of our aims within this work was to produce a cost-effective method to support multiple cytokine/chemokine assays for large numbers of samples. With this in mind we have estimated the cost of performing equivalent 16 cytokine assays on multiple samples, assuming best use of reagents for commercial kits, and encompassing the number of plates/slides and associated secondary reagents required, but not pipette tips or technical time. Based upon this, we estimate that R&D Duoset kits would allow testing of 712 samples for each cytokine, in duplicate, requiring 240, 96-well plates and cost approximately £0.63 per cytokine per sample (£10 per sample for 16 cytokines).
Based upon similar best use of the same ELISA kits, our system would allow the testing of 2872 samples, with 4 technical replicates for each cytokine per array. Including
slide, amplification and fluorescent dye costs equate to £0.18 per cytokine tested, or £2.88 per sample. This 71% saving comes with added technical replication, improved quality control based upon the analysis of spot morphology within the arrays, and reduced logistical issues due to the reduced
number of plate “equivalent” assays required (roughly 1\10th
of the number of ELISA plates are required).
The closest equivalent commercial cytokine array is a 96-well plate array from Quantsys (testing 16 cytokines), which costs £11.45 per sample, or £0.71 per cytokine tested. Once again our system represents a 75% saving.
5. Conclusions
have shown that 11 of the 16 cytokine biomarkers tested are in line with the FDA guidelines for analytical method validation. However, we saw a loss of precision at the lowest concentrations of protein in ra. This highlights the require-ment for more detailed guidelines on acceptable levels of accuracy and precision, specifically with regard to biomarker detection, which are standardized across research institutions
[30, 31]. This microarray system clearly offers great scope
for the detection of biomarkers using microarrays. The in-house microarray protocol established here enables multiple biomarkers to be quantified simultaneously with relative ease, uses a smaller sample volume and is more sensitive than ELISA, and has lower running costs. Importantly, detection is not limited to the 16 biomarkers shown here but can be expanded as required.
Abbreviations
BSA: Bovine serum albumin
CV: Coefficient of variation
ELISA: Enzyme-linked immunosorbent assay
FDA: Food and Drug Administration
HRP: Horseradish peroxidase
IFN-𝛾: Interferon-gamma
IL: Interleukin
IP-10: Interferon-gamma-induced protein-10
LLOQ: Lower limit of quantification
LOD: Lower limit of detection
MCP-1: Monocyte chemotactic protein-1
PBS: Phosphate buffered saline
RAGE: Receptor for advanced glycation end-products
TGF-𝛽: Transforming growth factor-beta
TNF-𝛼: Tumour necrosis factor-alpha
ULOQ: Upper limit of quantification VEGF: Vascular endothelial growth factor.
Conflict of Interests
The authors declare that there is no conflict of interests regarding the publication of this paper.
Acknowledgments
The authors would like to acknowledge the research nurse Sarah Lenney who obtained the samples for the study. This work was supported by the Nottingham Respiratory Biomedical Research Unit and The Jones 1986 Charitable Trust.
References
[1] L. J. Lesko and A. J. Atkinson Jr., “Use of biomarkers and surrogate endpoints in drug development and regulatory
deci-sion making: criteria, validation, strategies,”Annual Review of
Pharmacology and Toxicology, vol. 41, pp. 347–366, 2001. [2] S. Nowsheen, K. Aziz, M. I. Panayiotidis, and A. G. Georgakilas,
“Molecular markers for cancer prognosis and treatment: have
we struck gold?”Cancer Letters, vol. 327, no. 1-2, pp. 142–152,
2012.
[3] S. Wang, N. Diao, C. Lu et al., “Evaluation of the diagnostic potential of IP-10 and IL-2 as biomarkers for the diagnosis of active and latent tuberculosis in a BCG-vaccinated population,” PLoS ONE, vol. 7, no. 12, Article ID e51338, 2012.
[4] M. G. Madariaga, Z. Jalali, and S. Swindells, “Clinical utility of interferon gamma assay in the diagnosis of tuberculosis,” Journal of the American Board of Family Medicine, vol. 20, no. 6, pp. 540–547, 2007.
[5] A. W. Ansari, N. Bhatnagar, O. Dittrich-Breiholz, M. Kracht, R. E. Schmidt, and H. Heiken, “Host chemokine (C-C motif) ligand-2 (CCL2) is differentially regulated in HIV type 1
(HIV-1)-infected individuals,”International Immunology, vol. 18, no.
10, pp. 1443–1451, 2006.
[6] A. Deswal, N. J. Petersen, A. M. Feldman, J. B. Young, B. G. White, and D. L. Mann, “Cytokines and cytokine receptors in advanced heart failure: an analysis of the cytokine database
from the Vesnarinone Trial (VEST),”Circulation, vol. 103, no.
16, pp. 2055–2059, 2001.
[7] J. Or´us, E. Roig, F. Perez-Villa et al., “Prognostic value of serum
cytokines in patients with congestive heart failure,”The Journal
of Heart and Lung Transplantation, vol. 19, no. 5, pp. 419–425, 2000.
[8] S. Lanquillon, J.-C. Krieg, U. Bening-Abu-Shach, and H. Ved-der, “Cytokine production and treatment response in major
depressive disorder,”Neuropsychopharmacology, vol. 22, no. 4,
pp. 370–379, 2000.
[9] S. M. O’Brien, P. Scully, P. Fitzgerald, L. V. Scott, and T. G. Dinan, “Plasma cytokine profiles in depressed patients who fail to respond to selective serotonin reuptake inhibitor therapy,” Journal of Psychiatric Research, vol. 41, no. 3-4, pp. 326–331, 2007. [10] F. Zhou, M. M. Wang, L. Yuan, Z. P. Cheng, Z. Q. Wu, and H. Chen, “Sensitive sandwich ELISA based on a gold nanoparticle
layer for cancer detection,”Analyst, vol. 137, no. 8, pp. 1779–1784,
2012.
[11] M. Gonzalez-Gonzalez, R. Jara-Acevedo, S. Matarraz et al., “Nanotechniques in proteomics: protein microarrays and novel
detection platforms,”European Journal of Pharmaceutical
Sci-ences, vol. 45, no. 4, pp. 499–506, 2012.
[12] L. A. Tessler and R. D. Mitra, “Sensitive single-molecule protein quantification and protein complex detection in a microarray
format,”Proteomics, vol. 11, no. 24, pp. 4731–4735, 2011.
[13] C. Wingren, A. Sandstr¨om, R. Segersv¨ard et al., “Identification of serum biomarker signatures associated with pancreatic
can-cer,”Cancer Research, vol. 72, no. 10, pp. 2481–2490, 2012.
[14] P. Tighe, O. Negm, I. Todd, and L. Fairclough, “Utility, reliability
and reproducibility of immunoassay multiplex kits,”Methods,
vol. 61, no. 1, pp. 23–29, 2013.
[15] K. V. Desai, C. J. Kavanaugh, A. Calvo, and J. E. Green, “Chipping away at breast cancer: insights from microarray
studies of human and mouse mammary cancer,”
Endocrine-Related Cancer, vol. 9, no. 4, pp. 207–220, 2002.
[16] S. Selvarajah, The development and application of an
anti-body microarray as a diagnostic platform for COPD [Ph.D. thesis], University of Nottingham, 2013,
http://etheses.notting-ham.ac.uk/3572/.
[17] D. A. Armbruster and T. Pry, “Limit of blank, limit of detection
and limit of quantitation,”The Clinical Biochemist Reviews, vol.
29, supplement 1, pp. S49–S52, 2008.
[18] Guidance for Industry: Bioanalytical Method Validation, US
Food and Drug Administration, 2001, http://www.fda.gov/
downloads/drugs/guidancecomplianceregulatoryinformation/
[19] D. A. Fici, W. McCormick, D. W. Brown, J. E. Herrmann, V. Kumar, and Z. L. Awdeh, “A protein multiplex
microar-ray substrate with high sensitivity and specificity,”Journal of
Immunological Methods, vol. 363, no. 1, pp. 60–66, 2010. [20] B. A. Wood, R. M. Troyer, J. A. TerWee, and S. VandeWoude,
“Microsphere immunoassay for the detection of cytokines in domestic cat (Felis catus) plasma: elevated IL-12/23 in acute
feline immunodeficiency virus infections,”Veterinary
Immunol-ogy and ImmunopatholImmunol-ogy, vol. 145, no. 3-4, pp. 604–610, 2012. [21] H. Dietrich, K. Hu, M. Ruffin et al., “Safety, tolerability, and pharmacokinetics of a single dose of pasireotide long-acting release in healthy volunteers: a single-center Phase I study,” European Journal of Endocrinology, vol. 166, no. 5, pp. 821–828, 2012.
[22] M. Anderson, J. David, S. Pearlman, and J. Schmidt, “Evaluation
of multiplex immunoassay results,” Genetic Engineering and
Biotechnology News, vol. 31, no. 8, pp. 24–25, 2011.
[23] M. J. Binnicker, D. J. Jespersen, and J. A. Harring, “Evaluation of three multiplex flow immunoassays compared to an enzyme immunoassay for the detection and differentiation of IgG class
antibodies to herpes simplex virus types 1 and 2,”Clinical and
Vaccine Immunology, vol. 17, no. 2, pp. 253–257, 2010.
[24] T. Urbanowska, S. Mangialaio, C. Zickler et al., “Protein microarray platform for the multiplex analysis of biomarkers in
human sera,”Journal of Immunological Methods, vol. 316, no. 1-2,
pp. 1–7, 2006.
[25] B. Schweitzer and S. F. Kingsmore, “Measuring proteins on
microarrays,”Current Opinion in Biotechnology, vol. 13, no. 1,
pp. 14–19, 2002.
[26] P. R. Knight, A. Sreekumar, J. Siddiqui et al., “Development of a sensitive microarray immunoassay and comparison with standard enzyme-linked immunoassay for cytokine analysis,” Shock, vol. 21, no. 1, pp. 26–30, 2004.
[27] S. X. Leng, J. E. McElhaney, J. D. Walston, D. Xie, N. S. Fedarko, and G. A. Kuchel, “ELISA and multiplex technologies for cytokine measurement in inflammation and aging research,” Journals of Gerontology—Series A Biological Sciences and Medi-cal Sciences, vol. 63, no. 8, pp. 879–884, 2008.
[28] M. F. Elshal and J. P. McCoy, “Multiplex bead array assays: per-formance evaluation and comparison of sensitivity to ELISA,” Methods, vol. 38, no. 4, pp. 317–323, 2006.
[29] J.-G. Walter, F. Stahl, M. Reck et al., “Protein microarrays:
reduced autofluorescence and improved LOD,”Engineering in
Life Sciences, vol. 10, no. 2, pp. 103–108, 2010.
[30] M.-A. Valentin, S. Ma, A. Zhao, F. Legay, and A. Avrameas, “Val-idation of immunoassay for protein biomarkers: bioanalytical study plan implementation to support pre-clinical and clinical
studies,”Journal of Pharmaceutical and Biomedical Analysis, vol.
55, no. 5, pp. 869–877, 2011.
[31] A. A. Ellington, I. J. Kullo, K. R. Bailey, and G. G. Klee, “Measurement and quality control issues in multiplex protein
assays: a case study,”Clinical Chemistry, vol. 55, no. 6, pp. 1092–
Submit your manuscripts at
http://www.hindawi.com
Stem Cells
International
Hindawi Publishing Corporation
http://www.hindawi.com Volume 2014
Hindawi Publishing Corporation
http://www.hindawi.com Volume 2014 INFLAMMATION
Hindawi Publishing Corporation
http://www.hindawi.com Volume 2014
Behavioural
Neurology
Endocrinology
International Journal of Hindawi Publishing Corporationhttp://www.hindawi.com Volume 2014
Hindawi Publishing Corporation
http://www.hindawi.com Volume 2014
Disease Markers
Hindawi Publishing Corporation
http://www.hindawi.com Volume 2014
BioMed
Research International
Oncology
Journal of Hindawi Publishing Corporationhttp://www.hindawi.com Volume 2014
Hindawi Publishing Corporation
http://www.hindawi.com Volume 2014 Oxidative Medicine and Cellular Longevity Hindawi Publishing Corporation
http://www.hindawi.com Volume 2014
PPAR Research
The Scientific
World Journal
Hindawi Publishing Corporationhttp://www.hindawi.com Volume 2014
Immunology Research
Hindawi Publishing Corporation
http://www.hindawi.com Volume 2014
Journal of
Obesity
Journal ofHindawi Publishing Corporation
http://www.hindawi.com Volume 2014
Hindawi Publishing Corporation
http://www.hindawi.com Volume 2014
Computational and Mathematical Methods in Medicine
Ophthalmology
Journal ofHindawi Publishing Corporation
http://www.hindawi.com Volume 2014
Diabetes Research
Journal ofHindawi Publishing Corporation
http://www.hindawi.com Volume 2014
Hindawi Publishing Corporation
http://www.hindawi.com Volume 2014
Research and Treatment
AIDS
Hindawi Publishing Corporation
http://www.hindawi.com Volume 2014
Gastroenterology Research and Practice
Hindawi Publishing Corporation
http://www.hindawi.com Volume 2014
Parkinson’s
Disease
Evidence-Based Complementary and Alternative Medicine
Volume 2014