ISSN Online: 2333-9721 ISSN Print: 2333-9705
DOI: 10.4236/oalib.1104347 Feb. 23, 2018 1 Open Access Library Journal
Effect of Geometrical Parameters on the
Coefficient of Performance of the
Ranque-Hilsch Vortex Tube
Seif T. Abdelghany
1,
Hamdy A. Kandil
21Mechatronics Engineering Department, German University in Cairo, Cairo, Egypt
2Mechanical Engineering Department, Faculty of Engineering, Alexandria University, Alexandria, Egypt
Abstract
The Ranque-Hilsch vortex tube is a simple device with no moving parts and no mechanical operations. This tube separates the inlet air into two distinctive regions; an outward high temperature region and an inner low-temperature one. A computational study of the vortex tube is presented in this article using the ANSYS Fluent® software whose results showed good agreement with the experimental measurements. The effects of different geometrical parameters such as the tube length to diameter ratio and the cold orifice size on the coef-ficient of performance of the tube were investigated. The results showed that the coefficient of performance (COP) of the tube is highly affected by the tube length to diameter ratio (L D), and this effect varies when operating at
dif-ferent cold mass fractions where the maximum coefficient of performance occur at cold mass fraction of 0.64. The results also showed that the coefficient of performance of the tube is also affected by the cold orifice to tube diameter ratio (dc D) and that the maximum (COP) at any (dc D) ratio occurs also at a cold mass fraction of 0.64.
Subject Areas
Mechanical Engineering
Keywords
Ranque-Hilsch Vortex Tube (RHVT), Cold Orifice, Maxwell’s Demon, Refrigeration, Computational Fluid Dynamics (CFD), ANSYS Fluent
1. Introduction
The vortex tube (VT) is a device with a simple geometry without moving me-How to cite this paper: Abdelghany, S.T.
and Kandil, H.A. (2018) Effect of Geometrical Parameters on the Coefficient of Performance of the Ranque-Hilsch Vortex Tube. Open Access Library Journal, 5: e4347.
https://doi.org/10.4236/oalib.1104347
Received: January 17, 2018 Accepted: February 20, 2018 Published: February 23, 2018
Copyright © 2018 by authors and Open Access Library Inc.
This work is licensed under the Creative Commons Attribution International License (CC BY 4.0).
DOI: 10.4236/oalib.1104347 2 Open Access Library Journal chanical parts [1] [2] [3] [4]. It enables the separation of hot and cold air vortices from the inlet air, as it is supplied with compressed air that flows tangentially through the inlet nozzles [5] [6] [7]. The Vortex tube was first discovered in 1933 by Georges J. Ranque [8], and in 1947 Rudolf Hilsch improved and mod-ified the design of Ranque [9]. The vortex tube consists of many parts [10] [11] including one or more inlet nozzles, a vortex chamber, a control valve that is lo-cated at the hot outlet, a cold orifice and a working tube [12]. When compressed air is injected tangentially through the inlet nozzles into the vortex chamber a strong rotational flow (vortex) is formed at the periphery of the tube wall [13]. The vortex propagates till the end of the tube where some air leaves the tube via the hot outlet. However, adjusting the control valve at the hot outlet forces the rest of the air to reverse its direction and exit from the cold outlet along the cen-terline of the tube. It is noted that two vortices occur inside the tube, one at the periphery of the tube which exits at the hot outlet at a temperature much higher than the inlet temperature and the other one at the core of the tube with oppo-site flow direction which exits at the cold orifice with a temperature much lower than the inlet temperature.
The VT is used in many applications such as cooling of airborne electronic components, cooling of gas samples, and cooling of soldered parts including spot welding and ultrasonic welding. It is also used in the separation of air into nitrogen and oxygen rich fluid stream [14] [15]. The VT has many advantages [16] [17] [18] [19] because of its low cost, light weight, reliability, compactness and free maintenance as it has no moving parts. It has an adjustable temperature range and cools without using any refrigerant or electricity.
The results presented in this paper show that the COP of the VT can be en-hanced by adjusting the cold orifice to tube diameter ratio (dc D) and the length to the tube diameter ratio while depending on the adjusted cold mass fraction. This opens a new door to research on enhancing the performance of the VT based on the requirements of the application.
2. Energy Separation inside the RHVT
DOI: 10.4236/oalib.1104347 3 Open Access Library Journal proposed that the energy separation is due to damping of acoustic streaming.
The effect of friction and turbulence in the VT has always been a major con-cern of many researchers and was considered by some researchers as the reason for energy separation. For example, using a simple vortex tube model with CFX software and κ-ε turbulence model, Kazantseva et al.[26] attributed the energy separation inside the VT to the energy and gas dynamic interaction of vortices inside the VT. Behara et al.[27] modeled the RHVT using STAR-CD software and concluded that the energy separation inside the VT exists due to the shear work and heat transfer between the hot and cold streams. Bovand et al.[28] stu-died a 3D model of the VT and concluded that a large portion of the energy transfer inside the RHVT is due to the tangential viscous shear. Aljuwayehl et al. [1] explained the operation inside the VT by the existence of viscous shear acting on a control rotating surface separating the cold and hot flow regions. A torque is produced which causes work transfer between the cold and hot flows. El May et al.[29] reported the formation of a great amount of tangential shear stress of the flow near the wall of the tube, and proposed that the tangential shear work can be considered the most important mechanism of energy separation in the tube. Abdelghany and Kandil [30] presented an operational theory for the vortex tube such the mechanism inside the tube is in analogy to the gas refrigeration cycle (re-versed Brayton cycle) where the inner vortex acts as a turbine and that outer vor-tex acts as a compressor. They [30] concluded that a power transfer exist between bother vortices in which the inner vortex loses energy and the outer vortex gains energy based on the transfer of angular momentum between both vortices.
Some researchers noted the existence of secondary circulations in the vortex tube. They attributed the energy separation to the secondary circulations. For example, Behara et al.[31] confirmed the existence of secondary circulations in-side the RHVT at small cold orifice to tube diameter ratio (dc D) and that such circulations become weak as the dc D ratio increases and they disappear at
c
d D ratios higher than 0.583. They used a CFD model of the RHVT and
DOI: 10.4236/oalib.1104347 4 Open Access Library Journal performance of the vortex tube.
3. Performance Optimization of the RHVT
The performance of the RHVT is affected by geometrical properties such as the length to tube diameter ratio (L D) and cold orifice to tube diameter ratio
(dc D). The length to tube diameter ratio L D is a very important parameter that attracted the interest of many researches s such as [1] [2] [35] [36] [37] [38] [39]. For example, Bramo and Pourmahmoud [2] [35] [37] conducted a study on the L D ratio effect on the performance of the VT at cold mass fraction of 0.3
(at the maximum cooling effect) and concluded that at L D ratio of 9.3 the VT
has the highest total temperature change. Almost all the other L D ratios have
the same performance and that the high performance at L D ratio of 9.3 is due
to the stagnation point along the centerline of the tube. Patel and Bartaria [38] showed that as L D increases ΔTtotal increases to reach its maximum value at
L D ratio of 30 after which the performance of the VT decreases. They
re-ported that the performance of the tube in terms of maximum temperature dif-ference between the hot and cold outlets, ∆ =T Th−Tc, increases with increas-ing L D ratio up to a critical value after which the performance degrades.
Ay-din and Baki [40] confirmed that there is an optimum value for the L D ratio
for the vortex tube. Maurya and Bhavsar [36] concluded that as the L D ratio
increasesΔTtotal increases to reach an asymptotic state, and to obtain the maxi-mum energy separation effect the L D ratio should be greater than 10.
Alju-wayhel et al.[1] studied the L D ratio effect on the performance at cold mass
fraction of 0.3, near the maximum refrigeration point, and reported that as the length increases the performance of the tube increases up to a certain length of tube after which the effect of the L D ratio on the performance becomes
neg-ligible. Their results showed that there is a critical length of the VT over which the majority of energy transfer takes place and exceeding this length doesn’t af-fect the energy separation.
Kandil and Abdelghany [34] studied the effect of (L D) ratio on the performance
DOI: 10.4236/oalib.1104347 5 Open Access Library Journal of the dc D ratio on the energy separation inside the tube and showed that there is an optimum cold orifice diameter and operating at a lower diameter will result in mixing the cold stream with the hot one and operating at a higher di-ameter will result in mixing the hot stream with the cold one.
Recently, Kandil and Abdelghany [34] studied the effect of the dc D ratio on the performance of vortex tube in terms of the cold temperature drop and the hot temperature rise. Their results [34] showed that all the dc D ratio cases exhibit similar behavior where the cold temperature drop increases when de-creasing the cold mass fraction until a certain value of the cold mass fraction af-ter which the cold temperature drop decreases significantly. They explained the reason behind the decrease of the cold temperature drop after certain cold mass fraction by the occurrence of back flow at the cold outlet
The results presented in this paper support and build on the research of Kan-dil and Abdelghany [34] where the changes in the geometrical parameters of the VT can be adjusted to enhance one parameter which is the COP.
4. Numerical Model
An Axisymmetric model of the RHVT was designed and simulated using ANSYS Fluent® software. The model was validated using the experimental measure-ments of Skye et al.[42]. ANSYS Fluent software solves the following compress-ible turbulent flow conservation of mass, momentum and energy and state equa-tion [43] (ANSYS Fluent Theory Guide):
Continuity equation in tensor notation:
(
j j)
0, 1, 2, 3j
u u j
t x
ρ ρ ρ
∂ ∂ ′ ′
+ + = =
∂ ∂
(1) Momentum equations in tensor notations (all three components):
(
)
(
)
(
)
i i i j i j
j
ij j i i j i j
i j
u u u u u u
t x
u u u u u u x x
p
ρ ρ ρ ρ
τ ρ ρ ρ
∂ ′ ′ ∂ ′ ′ + + + ∂ ∂ ∂ ∂ ′ ′ ′ ′ ′ ′ ′ = − + − − − ∂ ∂ (2) Where 2 3 j i k ij ij
j i k
u
u u
x x x
τ =µ∂ +∂ − δ ∂
∂ ∂ ∂
(3)
Energy Equation:
(
)
2 3
2
, , , 1, 2, 3 3
i
j j j j j
j j
j
k i
i ij i
j k i j
j
k i
ij i i i
k i j
T H H u H u H u H u H u H k
t x x
u
u u
u u
t x x x x
u
u u
u u u i j k
x x x
ρ ρ ρ ρ ρ ρ ρ
ρ µδ µ
DOI: 10.4236/oalib.1104347 6 Open Access Library Journal Equation of State (ideal gas law)
p=ρRT (5)
where δij is the Kronecker delta function (δij =1 if i= j and δij=0 if
i≠ j); τij denotes viscous stress tensor; H represents the total enthalpy; T is
the static temperature, p is the pressure, ρ is the density and R is the universal gas constant at standard conditions.
4.1. Turbulence Model
The results of the CFD model of the RHVT using the κ-ε Turbulence model showed the best agreement with the experimental results of Skye et al. [42]. Therefore, the κ-ε Turbulence model was selected to simulate the turbulence in-side the VT in this study.
The geometry used in the current CFD model is based on the ExairTM 708
slpm vortex tube used by Skye et al. [42] as shown in Figure 1. The current model shown in Figure 2 is an axisymmetric model of the tube with matching geometrical properties to the VT used by Skye et al. [42], where the working tube length is 106 mm, tube diameter is 11.4 mm and cold exit diameter is 6.2 mm.
The results of the CFD model of the VT became mesh independent when the number of elements reached 17,000 elements. Due to the complexity and sensi-tivity of the flow inside the VT, the time step of the solution had to be very small
Figure 1. Schematic of vortex tube used in the experiment [42].
DOI: 10.4236/oalib.1104347 7 Open Access Library Journal to allow converge such that the computation time of one simulation ranged from 12 to 48 hours using 8 processors on a 3.64 GHz HP workstation Z800 with 16 GB Ram.
4.2. Boundary Conditions
The experimental data from Skye et al.[42] provided some of the boundary con-ditions for the inlet nozzles and both outlets while the rest of the data were ac-quired from different previous CFD models [2] [35] which were implemented based on the current configuration. The boundary conditions are summarized in Table 1.
4.3. Numerical Model Validation
The current CFD model was validated by comparing its results with the experi-mental measurements of Skye et al.[42] using the cold temperature drop (ΔTc), and the hot temperature rise (ΔTh) defined as the difference in temperatures between the outlet hot air and the inlet air.
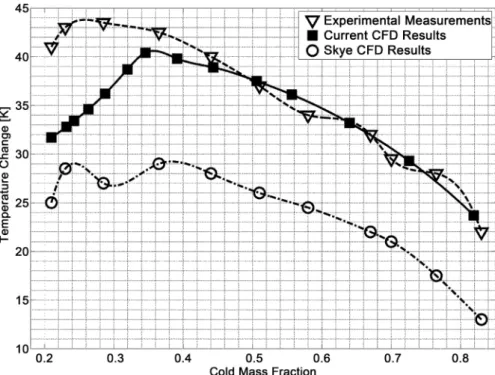
Figure 3 shows the comparison of the cold temperature drop of the current
model with the experimental measurements and the computational results of Skye et al.[42].
The results in Figure 3 show that the cold temperature drop increases as the cold mass fraction (µc), which is the ratio between the cold air outlet mass flow rate divided by the inlet mass flow rate, decreases up to a maximum ΔTc of 40.4 K at a cold mass fraction of 0.34 after which ΔTc decreases to reach a temperature of 31.7 K at µc of 0.2099. The ΔTc reaches a minimum value of 20 K at µc of 0.87 which shows that as the cold mass fraction increases to a maximum value the cold temperature drop decreases to its minimum value. It is noted that the current model has better agreement with the experimental mea-surements than that of Skye et al.[42] model.
Figure 4 shows the comparison between the hot temperature rise results of
the current study with the experimental measurements and the computational results of Skye et al.[42].
The results show that the hot temperature rise increases as the cold mass frac-tion increases to reach a maximum value of 86.7 K at cold mass fracfrac-tion of 0.87. Increasing the cold mass fraction further will be impractical due to the very low
Table 1. Boundary conditions used in the current study. Boundary Condition Type and Parameter of boundary condition
Inlet nozzles Mass flow inlet boundary condition with mass flow rate of 8.35 g/s, total temperature of 294.2 K
Cold outlet Pressure outlet Hot outlet Pressure outlet
DOI: 10.4236/oalib.1104347 8 Open Access Library Journal
Figure 3. Comparison of the cold temperature drop results with the experimental mea-surements and computational results of Skye et al. [42].
Figure 4. Comparison of the hot temperature rise results with the experimental mea-surements and computational results of Skye et al. [42].
DOI: 10.4236/oalib.1104347 9 Open Access Library Journal becomes rapid especially at very high cold mass fractions. The comparison shows that the current model has better agreement with the experimental mea-surements than that of Skye et al.[42] model.
5. Performance Optimization of the RHVT
5.1. Effects of the Length to Tube Diameter Ratio on the Total
Coefficient of the Vortex Tube (
COP
total)
The performance of the VT was determined by Kandil and Abdelghany [34] in terms of total temperature change. When studying the performance of the RHVT, not only the hot temperature rise or the cold temperature drop should considered but also the cold mass fraction, the pressure at the inlet and the pressure at the cold outlet. The VT can be used for cooling as it may be used for heating therefore a coefficient of performance (COP) for the two operations are defined.
The coefficient of performance for the RHVT when it is used as a refrigerator is the cooling power Qc divided by the input power P. The input power for
any refrigeration system is the input to the compressor. But for a RHVT system a compressed air source is used which makes it difficult to define the input pow-er. Fulton [44] proposed that the work used to compress the air through a re-versible isothermal compression process from the exhaust pressure up to the input pressure the input work is expressed as follows:
ln in in m in
c
p m R T
p = P (6) where
(
)
c c p in c
Q =m c T −T
(7) where Rm is the specific gas constant, pin is the input pressure and pc is the cold exit pressure
Therefore the COP of the RHVT as a cooler is expressed as
(
)
1 ln
c in c
c in in c T T COP p T p µ γ γ − = −
(8)
The COP for the RHVT when it is used as a heat pump is defined as the heat-ing power Qh divided by the input power P. The input power used by the
system takes the same from as the one used for the cooling RHVT Therefore, the COP of the RHVT as a heat pump is expressed as
(
1)(
)
1 ln
c h in
h in in c T T COP p T p µ γ γ − − = −
(9)
DOI: 10.4236/oalib.1104347 10 Open Access Library Journal
total c h
COP =COP+COP
(10)
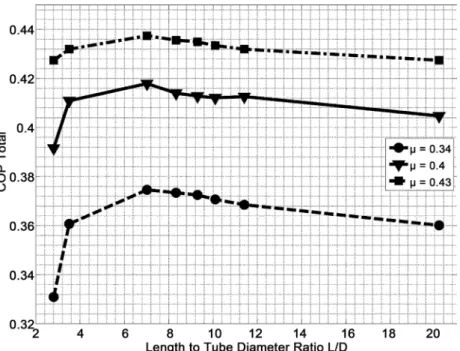
Figure 5 shows the relationship between the COPtotal and different L D ra-tios at cold mass fractions of 0.34, 0.4 and 0.43. The results in Figure 5 at cold mass fraction of 0.34 show that at L D ratio of 2.8 the COPtotal is 0.3309 and as the L D increases the COPtotal increases to reach a maximum value of 0.3746 at L D of 7.02 with a difference of 0.0437 from the COPtotal at the lowest L D ratio of 2.8. After which any further increase in the L D ratio
will result in a decrease in the COPtotal and the performance of the VT to reach a value of 0.3601 at L D ratio of 20.2.
The performance of the VT in terms of COPtotal at different L D ratios was studied at different values of cold mass fraction. The results in Figure 5 and Figure 6 at cold mass fraction of 0.4 show that the COPtotal at L D ratios above 3.5 decreased significantly changing the trend of the curve. Increasing μ to 0.439 decreased the COPtotal even more such that the relation between the
total
COP and the L D ratio at µ =0.72 in Figure 6 shows a completely
dif-ferent pattern than that at µ =0.34 shown in Figure 5 where the lowest L D
ratio of 2.8 has the highest COPtotal of 0.4936. As the L D ratio increases the total
COP decreases to reach an asymptotic value of 0.476 at L D ratio of 20.2.
These results show that the COPtotal at different L D ratios is dependent upon the cold mass fraction, where at low cold mass fraction, as the L D
in-creases the COPtotal increases to reach a maximum value at a critical L D ra-tio. Any further increase in the L D ratio will result in decreasing the COPtotal. While as the cold mass fraction increases the difference between the maximum and minimum COPtotal is reduced from 0.04 at µ =0.34 to 0.0086 at µ =0.5. Any further increase in the cold mass fraction will change the trend of the curve
DOI: 10.4236/oalib.1104347 11 Open Access Library Journal
Figure 6. Total COP of the VT at different L/D ratios at cold mass fractions of 0.5, 0.64 and 0.72.
between the COPtotal and different L D ratios such that the lowest L D ra-tio has the highest COPtotal and as the L D ratio increases the COPtotal de-creases to reach asymptotic value at critical L D ratio.
In Figure 6, it is shown that the COPtotal at a cold mass fraction of 0.64 is higher than that at any other cold mass fraction. Such results show that the best
total
COP value will be achieved when operating the tube at a cold mass fraction
of 0.64 at any length to tube diameter ratio.
Such results don’t follow the same pattern of the results of total temperature of Kandil and Abdelghany [34] where the best performance of the VT in terms of total temperature is when operating at the maximum possible cold mass frac-tion. This can be interpreted that the COPtotal depend not only on the cold and hot temperature changes as the total temperature change but also on the cold mass fraction and the pressure at the inlet and cold outlet.
5.2. Effects of the Cold Orifice to Tube Diameter Ratio on the
Performance of the Vortex Tube in Terms of COP
The cold orifice diameter is an important parameter that affects the performance of the VT. Therefore, several trials were done to optimize the performance of the tube of a diameter of 11.4 mm by varying the cold orifice diameter to pipe di-ameter ratio, dc D.
5.2.1. Highest COP Cold (COPc)
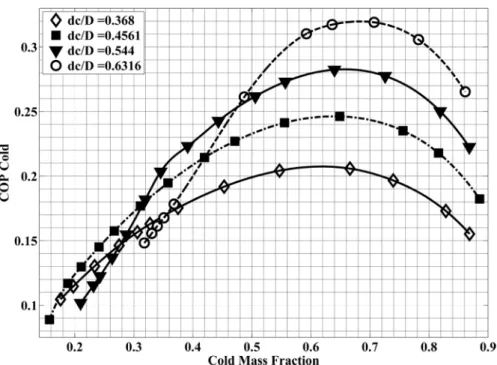
DOI: 10.4236/oalib.1104347 12 Open Access Library Journal the performance of the vortex tube. This dimensionless parameter is the COPc which was defined by Equation (8). Figure 7 shows the relationship between the
c
COP and the cold mass fraction.
It is shown in Figure 7 that all dc D ratio cases follow a similar pattern whereas the cold mass fraction increases the COPc increases till a critical cold mass fraction which is almost the same in all cases of value of 0.64 after which the COPc decreases with any further increase in cold mass fraction. The results show that the dc D ratio of 0.6316 has the highest COPc of 0.319 at a cold mass fraction of 0.64.
It is shown in Figure 7 that at cold mass fraction of 0.3 the COPc of the c
d D ratios above 0.5 drops to be lower than the COPc of the dc D ratios below 0.5 but the pattern starts when the highest dc D ratio of 0.6316 drops at cold mass fraction of 0.4. These results show that decreasing the cold mass frac-tion beyond a threshold, especially for high dc D ratios, causes a drop in
c
COP , resulting in an inversely proportional relationship beyond this threshold.
5.2.2. Highest COP Hot (COPh)
When studying the performance of the RHVT taking into consideration not just the highest temperature rise but also the hot mass fraction, the pressure at the inlet and the pressure at the cold outlet, a new dimensionless parameter had to be defined to combine the effect of all the previously mentioned parameters on the performance of the vortex tube. This dimensionless parameter is the COPh which was defined by Equation (9). Figure 8 shows the relationship between the
h
COP and the cold mass fraction.
It is shown in Figure 8 that all dc D ratio cases follow a similar pattern whereas cold mass fraction increases the COPh increases up to a critical cold
DOI: 10.4236/oalib.1104347 13 Open Access Library Journal
Figure 8. Hot COP of the RHVT at different dc/D ratio.
mass fraction which is almost the same value of 0.64 in all cases after which any further increase in the cold mass fraction will result in decreasing the COPh. The highest COPc of different dc D ratio cases existed at this exact cold mass fraction as stated in the previous Section 5.2.1. The dc D ratio of 0.6316 has the highest COPh of 0.2145 at cold mass fraction of 0.64.
5.2.3. Highest COP Total (COPtotal)
From the previous sections, it was noted that the highest COPc and COPh were at a cold mass fraction of 0.64 for all dc D ratio cases The COPtotal was defined in Equation (10) as the summation of the COPc and COPh, therefore when studying the performance of the RHVT in terms of the COPtotal, the maximum COPtotal for all the different dc D ratio cases should exist at cold mass fraction of 0.64 which is confirmed in Figure 9 which shows the relation-ship between the COPtotal and the cold mass fraction. It is shown in Figure 9 that the dc D ratio of 0.6361 has the highest COPtotal of 0.534 at cold mass fraction of 0.64.
It is noted from the results in Section 5.1 and Section 5.2 that the best perfor-mance of the vortex tube in terms of COPtotal occurs when operating the vortex tube at a cold mass fraction of 0.64 regardless of the length to tube diameter ratio or the cold orifice to tube diameter ratio.
DOI: 10.4236/oalib.1104347 14 Open Access Library Journal
Figure 9. Total COP of the RHVT at different dc/D ratio.
6. Conclusions
The results of the current model are in good agreement with the available expe-rimental measurements. Many geometrical parameters affect the performance of the tube. In this study, the length to tube diameter ratio effect in terms of
total
COP was investigated and the results showed that its effect on the
perfor-mance of the tube is different at different cold mass fractions where the maxi-mum COPtotal at any length to tube diameter ratio occurs at cold mass fraction of 0.64.
Also the effect of the cold orifice to tube diameter ratio on COPc, COPh and total
COP was investigated and the results showed that all the studied VTs at
dif-ferent dc D ratios have the maximum COPc and the maximum COPh at a cold mass fraction of 0.64. The highest dc D ratio of 0.6361 has the highest
c
COP and COPh.
It can be concluded that the best performance of the studied vortex tube at any L D or dc D ratio occurs at a cold mass fraction of 0.64. Future inves-tigation of the physical properties of the tube at such cold mass fraction and its relation to other operating points of the vortex tube should be considered.
References
[1] Aljuwayhel, N.F., Nellis, G.F. and Klein, S.A. (2005) Parametric and Internal Study of the Vortex Tube Using a CFD Model. International Journal of Refrigeration, 28, 442-450. https://doi.org/10.1016/j.ijrefrig.2004.04.004
DOI: 10.4236/oalib.1104347 15 Open Access Library Journal [3] Nimbalkar, S.U. and Muller, M.R. (2009) An Experimental Investigation of the Op-timum Geometry for the Cold End Orifice of a Vortex Tube. Applied Thermal En-gineering, 29, 509-514. https://doi.org/10.1016/j.applthermaleng.2008.03.032
[4] Rafiee, S.E. and Rahimi, M. (2013) Experimental Study and Three-Dimensional (3D) Computational Fluid Dynamics (CFD) Analysis on the Effect of the Conver-gence Ratio, Pressure Inlet and Number of Nozzle Intake on Vortex Tube Perfor-mance-Validation and CFD Optimization. Energy, 63, 195-204.
https://doi.org/10.1016/j.energy.2013.09.060
[5] Dutta, T., Sinhamahapatra, K.P. and Bandyopdhyay, S.S. (2010) Comparison of Different Turbulence Models in Predicting the Temperature Separation in a Ran-que-Hilsch Vortex Tube. International Journal of Refrigeration, 33, 783-792.
https://doi.org/10.1016/j.ijrefrig.2009.12.014
[6] Aydin, O., Markal, B. and Avci, M. (2010) A New Vortex Generator Geometry for a Counter-Flow Ranquee-Hilsch Vortex Tube. Applied Thermal Engineering, 30, 2505-2511. https://doi.org/10.1016/j.applthermaleng.2010.06.024
[7] Thakare, H.R. and Parekh, A.D. (2014) CFD Analysis of Energy Separation of Vor-tex Tube Employing Different Gases, Turbulence Models and Discretisation Schemes. International Journal of Heat and Mass Transfer, 78, 360-370.
https://doi.org/10.1016/j.ijheatmasstransfer.2014.06.083
[8] Ranque, G.J. (1933) Methods and Apparatus for Obtaining from a Fluid under Pressure Two Currents of Fluids at Different Temperatures. Patent No. 1,952,281. [9] Hilsch, R. (1947) The Use of the Expansion of Gases in a Centrifugal Field as
Cool-ing Process. The Review of Scientific Instruments, 18, 108-113.
https://doi.org/10.1063/1.1740893
[10] Xue, Y., Arjomandi, M. and Kelso, R. (2014) Energy Analysis within a Vortex Tube. Experimental Thermal and Fluid Science, 52, 139-145.
https://doi.org/10.1016/j.expthermflusci.2013.09.004
[11] Xue, Y., Arjomandi, M. and Kelso, R. (2012) Experimental Study of the Flow Struc-ture in a Counter Flow Ranque-Hilsch Vortex Tube. International Journal of Heat and Mass Transfer, 55, 5853-5860.
https://doi.org/10.1016/j.ijheatmasstransfer.2012.05.081
[12] Dincer, K., Baskaya, S., Uysal, B.Z. and Ucgul, I. (2009) Experimental Investigation and Exergy Analysis of the Performance of a Counter Flow Ranque-Hilsch Vortex Tube with Regard to Nozzle Cross-Section Areas. International Journal of Refrige-ration, 32, 87-94.https://doi.org/10.1016/j.ijrefrig.2008.06.002
[13] Bovand, M., Valipour, M.S., Dincer, K. and Eiamsa-ard, S. (2014) Application of Response Surface Methodology to Optimization of a Standard Ranquee-Hilsch Vortex Tube Refrigerator. Applied Thermal Engineering, 67, 545-553.
https://doi.org/10.1016/j.applthermaleng.2014.03.039
[14] Crocker, A.M., White, S.M. and Bremer, F. (2003) Experimental Results of a Vortex Tube Air Separator for Advanced Space Transportation. In: Proceedings of the 39th Joint Propulsion Conference and Exhibit, AIAA, Huntsville, 4451.
https://doi.org/10.2514/6.2003-4451
[15] Balepin, V. and Rosholt, D. (1999) Progress in Air Seperation with the Vortex Tube. In: Proceedings of the 9th International Space Planes and Hypersonic Systems and Technologies Conference, Norfolk, Virginia, 4884.
[16] Im, S.Y. and Yu, S.S. (2012) Effects of Geometric Parameters on the Separated Air Flow Temperature of a Vortex Tube for Design Optimization. Energy, 37, 154-160.
DOI: 10.4236/oalib.1104347 16 Open Access Library Journal [17] Zin, K.K., Hansske, A. and Ziegler, F. (2010) Modeling and Optimization of the
Vortex Tube with Computational Fluid Dynamic Analysis. Energy Research Jour-nal, 1, 193-196.https://doi.org/10.3844/erjsp.2010.193.196
[18] Gao, C.M., Bosschaart, K.J., Zeegers, J.C.H. and de Waele, A.T.A.M. (2005) Expe-rimental Study on a Simple Ranque-Hilsch Vortex Tube. Cryogenics, 45, 173-183.
https://doi.org/10.1016/j.cryogenics.2004.09.004
[19] Liu, X. and Liu, Z. (2014) Investigation of the Energy Separation Effect and Flow Mechanism inside a Vortex Tube. Applied Thermal Engineering, 67, 494-506.
https://doi.org/10.1016/j.applthermaleng.2014.03.071
[20] Ahlborn, B.K. and Gordon, J.M. (2000) The Vortex Tube as a Classic Thermody-namic Refrigeration Cycle. Journal of Applied Physics, 88, 3645-3653.
[21] Ahlborn, B.K., Keller, J.U. and Rebhan, E. (1998) The Heat Pump in a Vortex Tube. Journal of Non Equilibrium Thermodynamics, 23, 159-165.
https://doi.org/10.1515/jnet.1998.23.2.159
[22] Gao, C. (2005) Experimental Study on the Ranque-Hilsch Vortex Tube. PhD Thesis, Technische Universiteit Eindhoven, Eindhoven.
[23] Arbuzov, V.A., Dubnishchev, Y.N., Lebedev, A.V., Pravdina, M.K. and Yavorskii, N.I. (1997) Observation of Large-Scale Hydrodynamic Structures in a Vortex Tube and the Ranque Effect. Technical Physics Letters, 23, 938-940.
https://doi.org/10.1134/1.1261939
[24] Colgate, S.A. and Buchler, J.R. (2000) Coherent Transport of Angular Momen-tum—The Ranque-Hilsch Tube a Paradigm. Annuals of the New York Academy of Sciences, 898, 105-112.https://doi.org/10.1111/j.1749-6632.2000.tb06166.x
[25] Kurosaka, M. (1982) Acoustic Streaming in Swirling Flow and the Ranque-Hilsch (Vortex-Tube) Effect. Journal of Fluid Mechanics, 124, 139-172.
https://doi.org/10.1017/S0022112082002444
[26] Kazantseva, O.V., Piralishvili, S.A. and Fuzeeva, A.A. (2005) Numerical Simulation of Swirling Flows in Vortex Tubes. High Temperature, 43, 608-613.
https://doi.org/10.1007/s10740-005-0102-8
[27] Behera, U., Paul, P.J., Dinesh, K. and Jacob, S. (2008) Numerical Investigations on Flow Behaviour and Energy Separation in Ranque-Hilsch Vortex Tube. Interna-tional Journal of Heat and Mass Transfer, 51, 6077-6089.
https://doi.org/10.1016/j.ijheatmasstransfer.2008.03.029
[28] Bovand, M., Valipour, M.S., Eiamsa-ard, S. and Tamayol, A. (2014) Numerical Analysis for Curved Vortex Tube Optimization. International Communications in Heat and Mass Transfer, 50, 98-107.
https://doi.org/10.1016/j.icheatmasstransfer.2013.11.012
[29] El May, O.T., Mokni, I., Mhiri, H. and Bournot, P. (2011) CFD Investigation of a Vortex Tube: Effect of the Cold End Orifice in the Temperature Separation Me-chanism. Science Academy Transactions on Renewable Energy Systems Engineering and Technology, 1, 84-89.
[30] Abdelghany, S.T. and Kandil, H.A. (2015) Three-Dimensional Computational In-vestigation of the Power Separation and Flow Anatomy in the Vortex Tube. Inter-national Journal of Refrigeration, 20, 21-31.
[31] Behera, U., et al. (2005) CFD Analysis and Experimental Investigations towards Op-timizing the Parameters of Ranque-Hilsch Vortex Tube. International Journal of Heat and Mass Transfer, 48, 1961-1973.
https://doi.org/10.1016/j.ijheatmasstransfer.2004.12.046
DOI: 10.4236/oalib.1104347 17 Open Access Library Journal Temperature Separation in the Ranque-Hilsch Vortex Tube. International Journal of Heat and Mass Transfer, 50, 4724-4735.
https://doi.org/10.1016/j.ijheatmasstransfer.2007.03.048
[33] Farouk, T., Farouk, B. and Gustol, A. (2009) Simulation of Gas Species and Tem-perature Separation in the Counter-Flow Ranque-Hilsch Vortex Tube Using the Large Eddy Simulation Technique. International Journal of Heat and Mass Trans-fer, 52, 3320-3333.https://doi.org/10.1016/j.ijheatmasstransfer.2009.01.016
[34] Kandil, H.A. and Abdelghany, S.T. (2015) Computational Investigation of Different Effects on the Performance of the Ranque-Hilsch Vortex Tube. Energy, 84, 207-218.
https://doi.org/10.1016/j.energy.2015.02.089
[35] Bramo, A. and Pourmahmoud, N. (2011) Computational Fluid Dynamics Simula-tion of Length to Diameter Ratio Effect on the Energy SeperaSimula-tion in a Vortex Tube. Thermal Science, 15, 833-848.https://doi.org/10.2298/TSCI101004008B
[36] Maurya, R.S. and Bhavsar, K.Y. (2013) Energy and Flow Separation in the Vortex Tube: A Numerical Investigation. International Journal on Theoretical and Applied Research in Mechanical Engineering, 2, 25-32.
[37] Pourmahmoud, N. and Bramo, A. (2011) The Effect of L/D Ratio on the Tempera-ture Separation in the Counterflow Vortex Tube. International Journal of Research and Reviews in Applied Sciences, 6, 60-68.
[38] Patel, R.B. and Bartaria, V.N. (2013) Experimental Investigation & Numerical Analysis of Ranque Hilsch. International Journal of Engineering Research & Tech-nology, 2, 1-6.
[39] Dincer, K., Tasdemir, S., Baskaya, S. and Uysal, B.Z. (2008) Modeling of the Effects of Length to Diameter Ratio and Nozzle Number on the Performance of Counter-flow Ranque-Hilsch Vortex Tubes Using Artificial Neural Networks. Applied Thermal Engineering, 28, 2380-2390.
https://doi.org/10.1016/j.applthermaleng.2008.01.016
[40] Aydin, O. and Baki, M. (2006) An Experimental Study on the Design Parameters of a Counterflow Vortex Tube. Energy, 31, 2763-2772.
https://doi.org/10.1016/j.energy.2005.11.017
[41] Andalibi, M.R., Azizi, S.H., Khameneh, P.M. and Janmohammadi, M. (2012) Effect of Diameter and Diameter of Orifice on the Performance of Vortex Tube. Interna-tional Journal of Science and Engineering Investigations, 1, 89-93.
[42] Skye, H.M., Nellis, G.F. and Klein, S.A. (2006) Comparison of CFD Analysis to Em-pirical Data in a Commercial Vortex Tube. International Journal of Refrigeration, 29, 71-80.https://doi.org/10.1016/j.ijrefrig.2005.05.004
[43] ANSYS-Fluent. https://www.ansys.com/Products/Fluids/ANSYS-Fluent
![Figure 1. Schematic of vortex tube used in the experiment [42].](https://thumb-us.123doks.com/thumbv2/123dok_us/9971753.497980/6.892.339.785.590.832/figure-schematic-vortex-tube-used-experiment.webp)