ORIGINAL RESEARCH
BRAIN
CT Brain Perfusion Protocol to Eliminate the Need
for Selecting a Venous Output Function
A.J. Riordan, E. Bennink, M.A. Viergever, B.K. Velthuis, J.W. Dankbaar, and H.W.A.M. de Jong
ABSTRACT
BACKGROUND AND PURPOSE: In CTP, an arterial input function is used for cerebral blood volume measurement. AIFs are often influenced by partial volume effects resulting in overestimated CBV. A venous output function is manually selected to correct for partial volume. This can introduce variability. Our goal was to develop a CTP protocol that enables AIF selection unaffected by partial volume.
MATERIALS AND METHODS:First, the effects of partial volume on artery sizes/types including the MCA were estimated by using a CTP phantom with 9 protocols (section thicknesses of 1, 1.8, and 5 mm and image resolutions of 0.5, 1, and 1.5 mm). Next, these protocols were applied to clinical CTP studies from 6 patients. The influence of the partial volume effect was measured by comparison of the time-attenuation curves from different artery locations with reference veins.
RESULTS:AIFs from MCAs were unaffected by partial volume effects when using high image resolution (1 mm) and medium section thickness (1.8 mm). For the clinical data, a total of 104 arteries and 60 veins was selected. The data confirmed that high image resolution and thin section thickness enable selection of MCAs for AIFs free of partial volume influences. In addition, we found that large veins were not insusceptible to partial volume effects relative to large arteries, questioning the use of veins for partial volume correction.
CONCLUSIONS: A CTP protocol with 1.8-mm section thickness and 1-mm image resolution allows AIF selection unaffected by partial volume effects in MCAs.
ABBREVIATIONS:AIF⫽arterial input function; AUC⫽area under the curve; PVE⫽partial volume effect; VOF⫽venous output function; SRT⫽signed rank test
C
TP is used in the diagnosis of acute ischemic stroke to non-invasively measure cerebral perfusion parameters.1-5Relativeperfusion parameters can be obtained by normalization to the uninvolved hemisphere and are successfully applied in stroke im-aging to differentiate penumbra from benign oligemia.6-8
Accu-rate absolute CTP values would be desirable to improve the com-parability of results. As an example, absolute CBV has been found to be an accurate method of delineating the infarct core,9and this
method is widely used in clinical practice, providing motivation to assess and improve the accuracy of CBV measurements.
Calculation of CTP maps requires selection of an arterial input function (Fig 1). The AUC (the integral of contrast agent concentration with time) of the AIF is used to calculate the CBV. However, this AUC is commonly underestimated due to
the partial volume effect, especially when smaller arteries like the anterior cerebral artery or MCA are selected. The PVE is a result of limited spatial resolution as defined by the in-plane axial image resolution and section thickness.10-13Because
un-derestimation of the AUC of the AIF results in overestimation of the CBV, correction for PVE is necessary and typically per-formed by using the VOF.14-20This correction assumes that
without PVE, all AIFs and VOFs should have equal AUCs and that a VOF selected in a large vein like the superior sagittal sinus or the straight sinus is unaffected by PVE.
Correction of the PVE by using the VOF has limitations. It requires the user to select a second vessel besides the AIF, intro-ducing additional user variability. Also, the AUC of the VOF has been reported to depend on section thickness17and cannot always
be considered uninfluenced by PVE. Finally, although the as-sumption of equal AUCs in AIF and VOF is plausible, it has not been investigated so far, to our knowledge.
The goal of this study was to develop a CTP protocol that would enable PVE-free AIF selection in the MCA by increasing image resolution and decreasing section thickness, eliminating a step that every clinician must currently make in perfusion analysis.
Received July 20, 2012; accepted after revision September 24.
From the Department of Radiology, University Medical Center Utrecht, Utrecht, the Netherlands.
Please address correspondence to A. Riordan, MD, Department of Radiology, Uni-versity Medical Center Utrecht, Room E02.222, Heidelberglaan 100, 3584 CX Utrecht, the Netherlands; e-mail: [email protected]
http://dx.doi.org/10.3174/ajnr.A3397
MATERIALS AND METHODS
The required section thickness and image resolution were estab-lished by using phantom and patient studies.
Anthropomorphic Head Phantom
A realistic anthropomorphic CTP head phantom, previously used to compare CTP software and protocols,21was applied to gain
insight into the PVE for a range of CTP reconstruction protocols. The phantom also allows measurement of PVE with knowledge of the underlying truth. The CTP phantom is a combination of CT images (using the Brilliance iCT 256 [Philips Healthcare, Best, the Netherlands] section protocol, detailed in the “Clinical Data” sec-tion) of a physical skull phantom together with brain MR images. Spatially variant CT noise, effects of tube settings, and reconstruc-tion parameters are included by scanning the skull phantom by using the CTP protocol. Cerebral vessels and tissue, automatically segmented from the MR imaging data,22,23were manually
regis-tered to fit inside CT images of the skull phantom. Time-attenu-ation curves in the arteries and veins (AIF and VOF) were taken from clinical scans. Arterial and venous time-attenuation curves from clinical data were added, and perfusion values observed in clinical studies were used to generate tissue time-attenuation curves. Pixel size and section thickness can be set by averaging the original image voxels and resolution by changing the scale of a blur-ring kernel.
Phantom data were constructed by using 9 different protocols (Fig 2), varying in section thickness and in section image resolu-tion. These parameters mainly define the 3D spatial resolution of the CTP images and hence the strength of the PVE for a vessel.24
The section thicknesses used were the following: 1 mm, achievable with most modern scanners; 1.8 mm, and 5 mm, often used in
CTP protocols to reduce noise in the tis-sue time-attenuation curves.
The in-plane image resolution de-pends on several parameters, including focal spot size, image reconstruction fil-ter, and pixel size, which can be set by the operator. The image resolution was ex-pressed in the full width at half maximum (in millimeters) of the point spread func-tion and was measured by using an image-quality phantom. For the head phantom, we choose image resolutions of 0.5 mm, a typical technical limit for most scanners, and 1 and 1.5 mm, typ-ical of current CTP protocols. In all cases, the pixel size was set to 0.2⫻0.2 mm. To ensure that variance in the measured PVE could not be attributed to noise, the phantoms were constructed by using unrealistically high milliampere-second, approximately 100 times higher than that used in a clinical setting.
Clinical Data
An initial group of 30 patients was selected from participants in the Dutch Acute Stroke Trial (http://clinicaltrials.gov/ct2/show/ NCT00880113), a national multicenter prospective study on the prognostic value of CTP and CTA in patients with acute stroke symptoms. This study was approved by the institutional review committee, and subjects gave informed consent. Inclusion crite-ria were as follows: 1) patients who displayed no hemorrhage or infarcted tissue on both admission and 3-day follow-up noncon-trast CT, to ensure that all of the connoncon-trast agent entering via the arteries would exit via the veins and that all time-attenuation curves were fully sampled; 2) admission scan on a 256-section scanner, to ensure a uniform quality of data; 3) CTP acquisition in thin-section mode to allow reconstruction of different section thicknesses. Next, the patients were visually assessed by an expert reader to ensure the absence of any motion and that the ICA and MCA were present, resulting in 24 of these patients being elimi-nated; the 6 patients left were included in this study.
All data were acquired and constructed by using the standard clinical protocol: 150 mAs/rotation, 80 kV(peak), 512⫻512 ma-trix, 200-mm FOV, 0.39-mm2pixels, section thickness/spacing of
1/0.8 mm, and an acquisition series of 25 time frames at 2-second intervals with a rotation time of 0.33 seconds. These data were subsequently reconstructed to a section thickness of 5 mm (clin-ical standard) or 1.8 mm (thin section) and an in-plane image resolution (point spread function) of 1.5 mm (clinical standard) or 1 mm (high resolution) in the combinations given in Fig 2.
Image Analysis
Both the phantom data and the clinical data were analyzed in a similar fashion. Circular regions of interest with diameters of 20 mm, to ensure complete encircling of the vessel cross–section, were manually drawn over artery locations in the maximum in-tensity projections (Fig 1). These arteries were approximately per-pendicular to the section plane.17The content of each region of
interest in the raw data was examined to determine the artery diameter and center. The diameter and center were estimated by using a threshold technique,25allowing grouping in artery types: FIG 1. Semiautomatic blood vessel designation requires user definition of ROIs (circles) on an
artery and a large vein. The software then determines the voxel within the region of interest representing the time-attenuation curve with maximum AUC.
[image:2.594.55.371.47.142.2] [image:2.594.54.285.191.314.2]ICA (diameterⱖ4 mm), MCA (2–3 mm), and smaller arteries (1–2 mm) such as small MCA and anterior cerebral artery vessels. This technique proved accurate as long as the vessel diameter was not smaller than the full width at half maximum of the CT images.25Selection of the VOF was similar to the selection of
the AIF, though now the ROIs were placed over large veins (sagittal sinus) that were approximately perpendicular to the imaging plane.
Because the vessel center can be considered least affected by partial volume, the AUC was estimated by fitting a Gaussian curve to the time-attenuation curve of the pixel determined to be at the center. Only the center pixel was measured to conform to meth-ods used in clinical perfusion software and to ensure that the PVE was not overestimated in smaller vessels by averaging with pixels nearer to the vessel wall. The Gaussian curve fit enabled us to distinguish the first-pass bolus from the recirculation as is done in commercial software such as Brain Perfusion 4.0 (Philips Health-care) (Fig 3A). Before curve fitting, time-attenuation curves were corrected for background, defined as the local time-averaged Hounsfield unit value before bolus arrival.
A measure for the PVE in the vessels was calculated by dividing the AUC of the AIF by the AUC of a reference time-attenuation curve, yielding a relative AUC (AUCrel). For the phantom data,
the known input arterial time-attenuation curve before PVE in-fluences served as the reference time-attenuation curve. For the clinical data, the VOF measured with protocol B1 (Fig 2) was used as the reference. AUCrelvalues were expected to beⱕ1, where 1
could be interpreted as being unaffected by PVE. Values of⬍1 could be considered as a PVE-induced reduction of the AUC. The relative value of 1 was a reference point so that patients with dif-fering enhancement may be compared. Ideally, we wished to find the vessel with the highest enhancement, and AUCrelvalues of⬎1
were allowed for in the clinical data, for example, if an artery had a higher AUC than the reference vein. The results from the clinical data were grouped according to vessel type (small arteries, MCA, ICA, and large veins) and protocol used.
Statistical Analysis
Statistical analyses by using the Statistical Package for the Social Sciences software (SPSS, Chicago, Illinois) determined the signif-icance and implication of the clinical measurements. Depending on the relative group size, relationship, and the number of groups being compared, either a Mann-Whitney 2-tailed, Friedman with post hoc, or Wilcoxon signed rank test was used to test the differ-ence in PVE results between vessel groups and CTP protocols. In all cases, probability values are reported, and aPvalue of .05 was considered significant in all test types.
RESULTS
Anthropomorphic Head Phantom
Figure 4 shows that the protocol with a section thickness ofⱕ1.8 mm and an image resolution of, at most, 1 mm (protocol B2) shows the least PVE for the MCA vessel group. In the boxplot, AUCrelvalues are compared among the 9 CTP protocols. The
impact of PVE reduces with higher (improved) image resolution and thinner sections (protocols B and C).
Clinical Data
From the 6 patient studies, a total of 104 AIF and 60 VOF locations were selected. At every AIF and VOF location, the time-attenua-tion curve was measured by using the 3 protocols, A1, B1, and B2. Examples of MCA and venous time-attenuation curves are shown in Fig 3B. The time-attenuation curve of the AIF gets higher with smaller section thickness and higher (improved) resolution. This effect is much less pronounced or even absent for the venous time-attenuation curves.
Figure 5, a boxplot, shows the median and range of AUCrelfor
the 3 artery groups and the large veins. In all vessel groups, the protocols with smaller section thickness and higher resolution, in the order of A1, B1, and B2, show decreasing PVEs. This boxplot merely illustrates the distribution of the samples; the Table con-tains statistical analysis that investigates the trends observable in this figure.
For the smaller arteries, AUCrelstays well below 1 for all eval-FIG 3. A, Gaussian fit to the AUC (shaded area) of a vessel to estimate the AUC of the first pass of the bolus.B, Time-attenuation curves, background-corrected, demonstrate the changes in enhancement for the different protocols, A1, B1, and B2. Black lines represent an MCA, and gray lines, a vein from the same patient. The MCA has a higher AUC than the vein when using protocol B2.
[image:3.594.56.530.47.232.2]uated protocols. For the veins, the average AUCrelis 1, by
defini-tion, for protocol B1 and approximately 1 if B2 is used. When applying protocol A1 (often used clinically) with a 5-mm section thickness, the veins are still slightly affected by PVE. This finding is important, given that in clinical practice, PVE correction is commonly based on the VOF.
For the larger arteries, the MCA group showed less PVE for protocol B2 over B1. For the ICA, protocols B1 and B2 showed similar results, which indicates that for large arteries, protocol B1 suffices to allow AIF selection unaffected by PVE in the MCA. Most interesting, the larger artery (MCA and ICA) groups showed an AUCrellarger than 1. This is unexpected because current CTP FIG 4. Results of PVE measurements applying 9 different CTP protocols to the digital head phantom. The vertical axis gives a measure of the partial volume effect expressed as AUCrel.
FIG 5. Boxplot describing how PVE depends on CTP protocol. Vessel type and group are defined on the horizontal axis; AUC of the vessel time-attenuation curve relative to AUC of the average VOF from protocol B1 (AUCrel), as a measure for partial volume effect is displayed on the
vertical axis. Each of the groupings represents a range of vessel diameters (small arteries,⬍2 mm; MCA, 2–3 mm; large arteries [ICA],⬎4 mm; vein, ⬎5 mm).
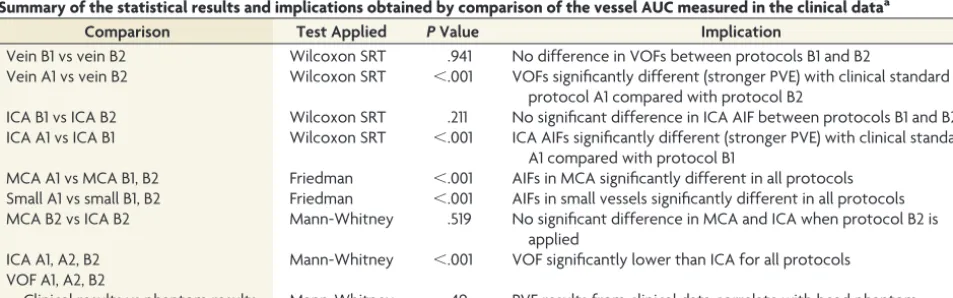
Summary of the statistical results and implications obtained by comparison of the vessel AUC measured in the clinical dataa
Comparison Test Applied PValue Implication
Vein B1 vs vein B2 Wilcoxon SRT .941 No difference in VOFs between protocols B1 and B2
Vein A1 vs vein B2 Wilcoxon SRT ⬍.001 VOFs significantly different (stronger PVE) with clinical standard protocol A1 compared with protocol B2
ICA B1 vs ICA B2 Wilcoxon SRT .211 No significant difference in ICA AIF between protocols B1 and B2 ICA A1 vs ICA B1 Wilcoxon SRT ⬍.001 ICA AIFs significantly different (stronger PVE) with clinical standard
A1 compared with protocol B1
MCA A1 vs MCA B1, B2 Friedman ⬍.001 AIFs in MCA significantly different in all protocols Small A1 vs small B1, B2 Friedman ⬍.001 AIFs in small vessels significantly different in all protocols MCA B2 vs ICA B2 Mann-Whitney .519 No significant difference in MCA and ICA when protocol B2 is
applied
ICA A1, A2, B2 Mann-Whitney ⬍.001 VOF significantly lower than ICA for all protocols VOF A1, A2, B2
[image:4.594.57.528.48.223.2] [image:4.594.55.532.481.630.2]methodology assumes the AUC of the arteries to be ideally equal to that of the veins.
The Table shows a summary of the statistical comparisons that confirm the significance of the results. Specific tests, Wilcoxon SRT, Friedman, and Mann-Whitney, were performed in consul-tation with a trained statistician, taking into consideration the asymmetry of the distributions, number of samples per group, and number of groups being compared. The implications will be examined further in the “Discussion.”
DISCUSSION
Although previous studies17,26have investigated PVE under
dif-ferent CT protocols and conditions, there are no published data on what protocol would eliminate the need for correction of AIF measurements. In addition, there are no studies that have vali-dated correction of PVE by using the measurements of the VOF, to our knowledge. The results of our phantom experiments indi-cated that an image resolution of 1 mm and a section thickness of 1.8 mm enable AIF definition in MCA vessels unaffected by PVE. The application of this protocol to clinical data resulted in good agreement with the findings from the phantom study, and the area under the curve of the MCA was found to be larger or equal to the VOF.
The spread in the measured values from the protocols A1-A3 (Fig 4) is mainly attributed to variance in the vessel orientation between approximately 0° and 30°, which has a substantial influ-ence when using thick sections. While it is possible to reconstruct CTP volumes with a section thickness limited only by the hard-ware (0.625 mm in the case of the scanner used here), the time taken to process⬎100 sections for a 7- to 8-cm-long CTP image volume can be prohibitive for a time-critical procedure, in which a quick diagnosis is crucial. Reconstructing to 1.8-mm-thick sec-tions is more practical (protocols B1–B3), and the phantom re-sults indicate that thinner sections (protocol C1–C3) offer no ad-ditional benefit. For the smaller arteries, the AUCrelstayed well
below 1 for all evaluated protocols, indicating that these vessels are not useable for AIF selection if PVE is to be prevented.
The measurements performed on the clinical data (Fig 5) have a noticeable variance. This can largely be attributed to uncertainty in vessel diameter measurements and vessel orientation and is illustrated by the fact that the large veins, where vessel diameter and orientation are less of an issue, have the least variance.
The unexpected finding that for the high-resolution protocols, the AUC of arteries was significantly larger than that of the veins (Table 1) is contrary to the common assumption that both AUCs are equal in the absence of PVE and hence can be used for PVE correction. In this study, every care was taken so that this differ-ence could not be attributed to biases induced by curve fitting, background correction, delay of venous peak (the Gaussian fit is insensitive to delay), noise, or other image-related sources. This suggests that the PVE correction by using the VOF will not be sufficient but will still result in overestimation of the CBV.
It has previously been observed that the hematocrit in arteries and veins can differ.27,28It is also well-documented that the high
osmolarity of CT contrast agents, which acutely increases the blood volume, causes red blood cell crenation.29It has been
the-orized that this could further change the hematocrit value in such
a way that it is dependent on the size of the red blood cells and the pressure in the vessel, both of which differ between the arteries and veins.27This theory implies that it might be incorrect to
as-sume that the hematocrit factor is the same in the veins and arter-ies and that the relative hematocrit is dynamic due to the changing concentration of contrast in the blood.
Several limitations to this study must be acknowledged. First, 6 patients are a small cohort: The inclusion criteria were stringent to minimize the influence of confounding factors. In this study, we focused on the PVE, keeping all other aspects of CTP studies as constant as possible. The total number of included vessels enabled us to draw statistically significant conclusions. Second, when working with the suggested thin-section data, CT noise may affect CTP map quality, because tissue time-attenuation curves have lower contrast enhancement compared to vessel time-attenuation curves. It may be necessary to average the thin sections to thicker sections after acquisition of the AIF, to reduce noise in the tissue time-attenuation curves.
An alternative method to prevent loss of valuable time may be to reconstruct a limited number of thin sections purely for the acquisition of the AIF and to reconstruct the rest of the volume in thicker sections. In this study, care was taken to minimize the effect of noise. The vessel center was chosen as the measurement location. One alternative was to measure the pixel with the max-imum enhancement; however, this measurement may have noise-induced bias toward higher AUC values and influences the calcu-lation of the PVE. In addition, the contrast enhancement in the vessels was high in comparison with the background noise in all protocols, allowing for constantly good fitting of the Gaussian shape to the first pass of the bolus. Because the method used to measure the AUC in this work is very similar, if not identical, to that in commercial CTP software, the measurements will reflect any bias observed in clinical practice.
CONCLUSIONS
Partial volume effects depend strongly on scan parameters and vessel diameter and can adversely affect CTP results. CTP data reconstructed with 1.8-mm section thickness and an image reso-lution of 1 mm can eliminate PVEs in MCA-sized arteries, which are found in all CTP scans. This protocol makes CTP scans less user-variant because no VOF selection is required. Such a recon-struction protocol may increase the accuracy of CTP maps and its subsequent diagnostic value.
Disclosures: Max A. Viergever—UNRELATED: Grants/Grants Pending: Philips Healthcare.* Birgitta K. Velthuis—Payment for Lectures (including service on Speak-ers Bureaus): CT perfusion presentations for Philips Healthcare.* *Money paid to the institution.
REFERENCES
1. Klotz E, Konig M.Perfusion measurements of the brain: using dy-namic CT for the quantitative assessment of cerebral ischemia in acute stroke.Eur J Radiol1999;30:170 – 84
2. Mayer TE, Hamann GF, Baranczyk J, et al.Dynamic CT perfusion imaging of acute stroke.AJNR Am J Neuroradiol2000;21:1441– 49 3. Wintermark M, Smith WS, Ko NU, et al.Dynamic perfusion CT:
optimizing the temporal resolution and contrast volume for calcu-lation of perfusion CT parameters in stroke patients.AJNR Am J Neuroradiol2004;25:720 –29
4. Axel L.Cerebral blood flow determination by rapid-sequence com-puted tomography: theoretical analysis. Radiology 1980;137: 679 – 86
5. Axel L.A method of calculating brain blood flow with a CT dynamic scanner.Adv Neurol1981;30:67–71
6. Lev MH, Segal AZ, Farkas J, et al.Utility of perfusion-weighted CT imaging in acute middle cerebral artery stroke treated with intra-arterial thrombolysis: prediction of final infarct volume and clini-cal outcome.Stroke2001;32:2021–28
7. Schaefer PW, Barak ER, Kamalian S, et al.Quantitative assessment of core/penumbra mismatch in acute stroke CT and MR perfusion imaging are strongly correlated when sufficient brain volume is im-aged.Stroke2008;39:2986 –92
8. Kamalian S, Kamalian S, Konstas AA, et al.CT perfusion mean tran-sit time maps optimally distinguish benign oligemia from true “at-risk” ischemic penumbra, but thresholds vary by postprocessing technique.AJNR Am J Neuroradiol2012;33:545– 49
9. Wintermark M, Flanders AE, Velthuis B, et al.Perfusion-CT assess-ment of infarct core and penumbra: receiver operating characteris-tic curve analysis in 130 patients suspected of acute hemispheric stroke.Stroke2006;37:979 – 85
10. Kalender WA.Computed Tomography. Fundamentals, System Tech-nology, Image Quality, Applications.New York: Wiley; 2000 11. Barrett JF, Keat N.Artifacts in CT: recognition and avoidance.
Ra-diographics2004;24:1679 –91
12. Prokop M, Galanski M.Spiral and Multislice Computed Tomography of the Body.New York: Thieme; 2003
13. Cianfoni A, Colosimo C, Basile M, et al.Brain perfusion CT: princi-ples, technique and clinical applications. Radiol Med2007;112: 1225– 43
14. Wintermark M, Reichhart M, Thiran JP, et al.Prognostic accuracy of cerebral blood flow measurement by perfusion computed tomog-raphy, at the time of emergency room admission, in acute stroke patients.Ann Neurol2002;51:417–32
15. Kudo K, Sasaki M, Ogasawara K, et al.Difference in tracer delay-induced effect among deconvolution algorithms in CT perfusion analysis: quantitative evaluation with digital phantoms.Radiology
2009;251:241– 49
16. Wintermark M, Albers GW, Alexandrov AV, et al.Acute stroke im-aging research roadmap.Stroke2008;39:1621–28
17. van der Schaaf I, Vonken EJ, Waaijer A, et al.Influence of partial volume on venous output and arterial input function.AJNR Am J Neuroradiol2006;27:46 –50
18. Lee T, Stewart E. Scientific basis and validation. In: Cuenod CA, Miles KA, eds.Multidetector Computed Tomography in Oncology: CT Perfu-sion Imaging.London, UK: Informa Healthcare; 2007:15– 46 19. Aviv RI, d’Esterre CD, Murphy BD, et al.Hemorrhagic
transforma-tion of ischemic stroke: predictransforma-tion with CT perfusion.Radiology
2009;250:867–77
20. Konstas AA, Goldmakher GV, Lee TY, et al.Theoretic basis and technical implementations of CT perfusion in acute ischemic stroke. Part 2. Technical implementations.AJNR Am J Neuroradiol
2009;30:885–92
21. Riordan AJ, Prokop M, Viergever MA, et al.Validation of CT brain perfusion methods using a realistic dynamic head phantom.Med Phys2011;38:3212–21
22. Dale AM, Fischl B, Sereno MI.Cortical surface-based analysis. I. Segmentation and surface reconstruction. Neuroimage 1999;9: 179 –94
23. Koopmans PJ, Manniesing R, Niessen WJ, et al.MR venography of the human brain using susceptibility weighted imaging at very high field strength.MAGMA2008;21:149 –58
24. Bushberg J, Seibert J, Leidholdt E, et al.The Essential Physics of Medical Imaging.2nd ed. Philadelphia: Lippincott, Williams & Wilkins; 2002 25. Hoffmann KR, Nazareth DP, Miskolczi L, et al.Vessel size measure-ments in angiograms: a comparison of techniques.Med Phys2002; 29:1622–33
26. Tang C, Blatter DD, Parker DL.Accuracy of phase-contrast flow measurements in the presence of partial-volume effects.J Magn Reson Imaging1993;3:377– 85
27. Lapin GD, Allen CV, Groothuis DR.Noninvasive measurement of arterial blood-plasma concentration of iodinated contrast agents from CT scans of human brain.J Comput Assist Tomogr1994;18: 363– 69
28. Mchedlishvili G, Varazashvili M, Kumsishvili T, et al.Regional he-matocrit changes related to blood flow conditions in the arterial bed.Clin Hemorheol Microcirc2003;29:71–79