University of Warwick institutional repository: http://go.warwick.ac.uk/wrap
A Thesis Submitted for the Degree of PhD at the University of Warwick
http://go.warwick.ac.uk/wrap/61763
This thesis is made available online and is protected by original copyright. Please scroll down to view the document itself.
HYDROGEN BONDED .ANIONS
by
TERENCE ANTHONY 0tSHEA
A dissertation submitted in part fulfilment of the requirements for a Doctor of Philosophy Degree at the University of Warwick.
BEST COpy
AVAILABLE
PrtEFACE.
The work described in this dissertation is original, except in those portions where it is specifically stated to the contrary. It has not been submitted, either wholly, or in part, for a degree at this, or at any other university.
ACKNOWLEDGEMENTS
The author wishe s to thank Professor T. C. Waddina,ton for his constant help and encouragement throughout the course of the work. He is grateful to many other Members of the Department, Research Students and Technical Staff who have assisted in many ways, and in particular to Dr. J. A. S. Smith for providing
the NQR facilities and to R. Lynch for recording the NQR Spectra. He is also indebted to many people outside this university for
providing other facilities and to Miss R. Perry for some excellent typing.
CONTENTS
Summary
CHAPrER ONE, INTROIUCTION 1
1.1 Hydrogen Bonded Anions 1
1.2 Structure of Hydrogen Bonded Anions 2
1.3 IR Spectra of H-bonded Species· 5
1.4 Hydrogen Dihalides 9
1.5 Acid Salts of :Monobasic Acids 10
1.6 Potassium Dihydrogen Phosphate
14-1.7 Chromous Acid 15
CHAPl'ER TWO, EXPERI1lENTAL TECHNIQUES 17
2.1 The Vacuum System 17
2.2 The Dry Box 19
2.3 Analytica.l Methods 20
(a) Weight Analysis 20
(b) Chemi6'al Analysis 22
(c) Elemental }Wnalysis 22
2.4 Preparation of Starting Materials 22
(a) Tetra-n-butylammonium chloride 22
(b) Carboxylic acids 23
(c) Deutero Carboxylic Acids 23
(d) Simple Salt s 25
(e) Solvents 25
(i) Chloroform 25
2.5 Low Temperature Infrared Cells 26
lea) Liquid Ni tros;en
m
cell 26(b) Method of Operation 26
2(a) Liquid Helium Cell 29
(b) Method of Operation 31
(c) Transfer of Liquid Helium 32
2.6 Spectrometers 35
(a) Infrared Spectra 35
(b) Raman Spectra 35
(c) Inelastic Neutron Scattering 35
(d) Nuclear Magnetic Resonance Spectrometer 35 (e) Pure Nuclear Quadrupolar Resonace~
36 S pectromet er
CHAPrER THREE, .ASYM1~TRIC HYDROGEN BONDED ANIONS 37 Introduction
1. Nomenclature and Abbreviations 42
43
44
50
54
54
2. Acetic Acid System
(a) ClH(OAc)-, BrH(OAc)-, m(OAc)-(b)
m(OAc)-3. Formic Acid System
(a) ClH(Ol!1n)-, BrH( OFm) -, m(OFm)-(b)
m(OFm)-57
60
62
4. Trifluoroacetic Acid System 5. Dichloroacetic Acid System 6. Solution Spectra
7.
Experimental63
64
69
70
REFERENCES 71 71
73
74 75 85 89 93 95 96 103 lC4 105 106 108 109 111 112 120 125 130 131132
135 136137
138CHAPl'ER FOUR, TYPE B SALTS
1. Introduction
2. Normal Modes of Vibration 3. Monenclature and Abbreviations 4. Hydrogen Diacetate Anion
5. Hydrogen Di-monochloroacetate Anion
6. Hydrogen Di-dichloroacetate Anion
7. Hydrogen Di-forma te Anion
8. Hydrogen Di-difluorochloroacetate Anion 9. Experimental
SPECTRA
CONTENTS
CHAITER FIVE, TYPE A SALTS
1. Introduction
2. Nonnal Modes of Vibration 3. Character Tables
4. Abbreviations
5. Sodium Hydrogen Diacetate
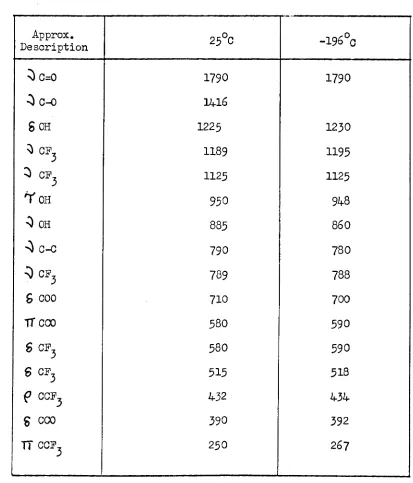
6. Hydrogen Di-trif1uoroacetate Anion
7.
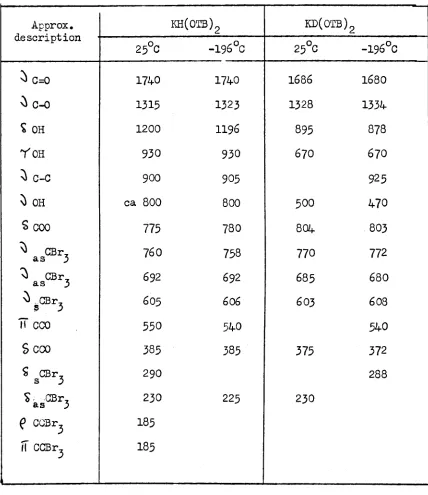
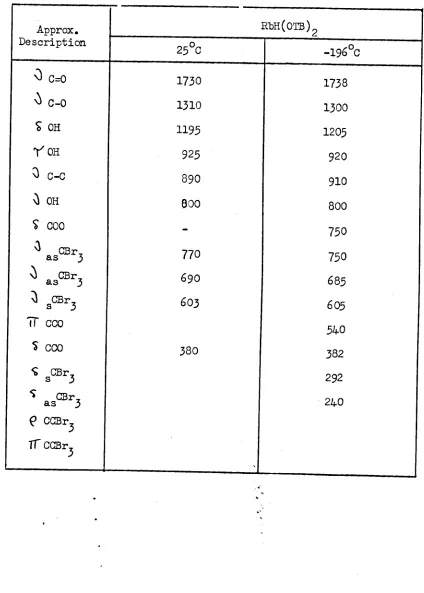
Hydrogen Di-trich10roacetate Anion8. Hydrogen Di-tribromoacej;ate Anion
9. Hydrogen Di-monochloroacetate Anion 10. Conclusion
11. Experimental
SPECTRA
SUMMARY
The work recorded in this thesis can be divided into three
sections. The first section (chapter three) is concerned with
essentially weak H-bonded anions of the type XH(02CR)-, where
X- is a group 7 halide ion, and R is H, CH3, CF3 or C"rlCI2• The
IR spectrum of each of the se anions has been examined and complete
assignments have been made in most cases. The relationships which
exist in the series, whichare a direct result of their chemical
similarities,~re discussed in terms of the pK values of the acid
a
and base concerned.
The second section (chapter four) deals with Type B hydrogen
dicarboxylate salts of acetic acid and its halogenated derivatives.
Their IR spectra have been examined at the temperature of liquid
nitrogen and assignments have been made. The importance of low
isotopic shifts is discussed and used as evidence for asymmetry in
the potential energy surface of the proton. Secondary evidence from
other techniques, viz. NQR, inelastic neutron scatteri~g, Raman
and Far IR spectroscopy, has been obtained which parallels and
confirms the results from IR spectroscopy.
Type A salts, which are thought to be examples of symmetric
H-bonds, have been examined by the same techniques which were used
for Type B salts. In particular their ID. spectra have been
examined and assigned for the first time. Attention is drawn to
the low frequency of~OH and~OD, and to its high isotopic shift.
but not analysed in detail, and it is clear that it is similar
to the much simpler IR spectrum of the Type A salts prepared in
this work. The latter example represents a case where very recent
and accurate neutron diffraction data is available and where it
-1
was suggested that~OH is below lOOOcm • This evidence,
t.ogether-with work on Type A and B salts, has led. to an idea of the shape
of the potential energy well for the proton and deuterium in Type A
salts which is based on a symme tr-lc double minimum. A similar
situation is suggested for the proposed symmetric cases of HC12-,
CHAPTER ONE
1
-Chapter 1.
INTRODUCTION
1. Hydror:en Bonded Anions
Over the past decade an extensive amount of literature has appeared on all aspects of hydrogen (H-) bonding (1,2.) Recently Hamilton and Ibers have summarised the techniques available for H-bond studies (3). With this vast amount of data available it remains only for a general outline to be discussed here, with particular attention to the more recent controversies which still exist.
In general, an H-bond is formed between a proton donor, HX, and an electron donor, Y, where Y can be a negatively charged species. The X-Y distance is between a normal chemical bond and the Van der Waals radii of X and Y. If an electrostatic model is assumed then it is not surprising that
the strongest H-bond exists in HF2 -. However, it is now believed that consid-erable covalent character exists in HF2 - and other He-bonds of this type
(4, 5, 6.)
The HF2 - ion is a member of a very large class of H-bonded anions which can be isolated as salts in a crystalline state. The enthalpy of
fonnation (~H) of HF2 - in solid KHF2 is -27 Kcal/mole (7) and the calc-ulated gas phase value is -57 Kcal/mole (8). The use of large cations, thereby lowering the lattice energy of the system, ha~ made possible the isolation of much weaker anions. Many H-bonded anions have now been isolated which parallel salt hydrates in the water system. Table 1,1. shows a
TABLE 1.1
Cation (+) Anion (-) Ref.
Group 1 HF2 (3)
Cs,Me4N, etc. HCl2 (9, 10)
Me4N,Ph4As EBr2 (11,l2)
n-B}l4N HI2 (13)
Et4N HFel (14)
Et4N H:ffir (14)
n-Bu4N HFI (14)
Cs,n-Bu4N HClBr (9,lS)
n-Bu4N HCll (lS)
n-Bu4N Cm(OAc) (16)
n-Bu4N cm(oFln) (16)
n-Bu
4
N BrH(OAc) (16)n-Bu4N BrH(OIDn) (16)
Me4N HClN03 (15)
Ph
4
As H(N03)2 (17)Ph4As H(N02)2 (18)
Ph
4
As H(NCS)2(19)
K H(OMe)2
(20)
n-Pr
4
N H(CN)2 (21)n-Bu4N HCICN (22)
n-Bu N HBrCN (22)
4
Et N CmCC13 (23)
4
[image:13.555.59.469.58.740.2]2
-Intramolecular H-bonded anions have also been the subject of much work, the classical example being potassium hydrogen maleate (25, 26). Potassium hydrogen malonate, on the other hand, is intermolecular in the solid phase (27) but is intramolecular in solution (28). This emphasises that crystal forces can modi~ the structure of H-bonded species, and that the solid state structure is not necessarily preserved in solution (28).
Although a considerable amount of work has gone into the isolation of H-bonded anions, the main body of the research has centred on structural determinations. This essentially reduces to determining the position of the hydrogen atom in relation to the groups bonded to it, and is, therefore, the subject of the next section
(3).
2. Structure of Hydrogen Bonded Anions
The small size of a hydrogen atom renders structural determinations of H-bonded anions difficult. The advent of neutron diffraction has contributed a great deal in solving the problem for weak H-bonds, but it is inconclusive for strong H-bonded species
(3).
Ibers and McGaw have pointed out that only the coupled use of neutron diffraction and spectroscopic techniques can determine unambiguously the structure where a hydrogen atom is situated near to the mid point between two interacting groups(3,
29).The most likely shapes of the potential energy wel1 along the bond axis in linear H-bonded anions are shown in fig. 1,2 (30). Non linear species are also known, especially in weak H-bonds, but will only be discussed in specific cases
(3).
The groups X and Yare different in the diagrams, however, the same arguments are applicable when X and Y is the same group.Case 1 represents an asymmetric H-bond with the hydrogen atom
3
-will be very unstable. Case 1 example s can be found in many crystalline hydrates and neutron diffraction alone can determine their structures unambiguously
(3).
For cases where X and Yare complex groups, such as CH3C02-, then an infrared (m) spectrum will show a superposition of the acid and base spectrum, which in itself is strong evidence in favour ofcase 1 (30). For species such as ClHBr- all the bands in the IR spectrum above about 200cm-l are associated with proton motion. This situation will be discussed in more detail in chapter three.
Case 2 represents an asymmetric H-bond with two equally possible equilibrium positions separated by a high energy barrier (30). Such a.
situation was suggested in DCr02, where it is quite clear that the deuterium bond is asymmetric (32). This case will be discussed in more detail at a later stage.
Cases 3 and 4 represent the most difficult cases to distinguish. In the former, the possibility of proton tunneling exists because of the low potential energy barrier (30). A neutron diffraction study on such a compound would indicate an elongated contour map representing the thermal motion of the hydrogen atom along the bond axis, and its centre woold coincide with the mid point between groups X and Y (32). The latter cannot be
distinguished unambiguously from an example of case
4
where a high thermal vibration of the proton occurs along the bond axis (29). Hadzi and Novakvsuggested that IR spectroscopy can distinguish between such cases since proton tunneling will give rise to several bands corresponding to
vXH
(30). The IR spectrum of KHl'04 was interpreted on the basis of proton tunnel ing(33)
but has recently been reinterpreted(34).
This compound will be discussed at a later stage. Ibers emphasised again that only the coupled use of neutron diffraction and spectroscopic techniques can differentiate unambiguously between cases 3 and 4 (35).4
-Figure 1,2.
4
(1)
--
..' (2)
. " •... J"'"'
, (3)
(4)
..
.
.
I
F,ig.1.2 '
X
~I
y.
X
II
Y
(a),
(b) .
y
X
II
Y'
:x
1-1
Y
..,,""
\
'/.' .•
5
-in the solid phase (1) (2)
(3).
Infrared Spectroscopy (4000.::m-1-200cm -1) Energy levels of proton
t -1 -1\
Far Inf'rared Spectroscopy \.~JOcm -1}.~1tl. )~~~ ~~<l,\lenC~ ff-bond vibrations
Raman Spectroscopy Compl1mentary to IR data in
deter-mining point groups
Polarised IR Spectroscopy Type of vibration
Inelastic Neutron Scattering Proton motion and energy levels of proton
Nuclear Magnetic Resonance (mat) Tunneling and Molecular Motion Nuclear Quadrupole Resonance (NQR) Electric Field Gradients
IR Spectroscopy has in the past contributed the main source of information on H-bonded anions and will be the subject of the next section. Far infrared and Raman spectroscopy has not been used extensively because of the experi-mental difficulties associated with the spectral region and with solids, respectively. However, now that some of the latter difficulties have been overcome these techniques have become more informative. Inelastic n~ron scattering has only recently been used and can be treated as comp1amenta~ to IR Spectroscopy
(3).
NUR techniques have been applied to proton and deuterium samples and are particularly sensitive to tunneling (3). NQR Spectroscopy is restricted to compounds which contain nuclei with a quad-rupole moment but, at present, little information is available.3. IR Spectra of H-bonded Species.
This subject has bee n discussed in detail by Sheppard
(36)
and others(5) (1) and, therefore, will not be discussed at length here. The normal modes of vibration are shown in fig.
1,3. (36).
With increasing H-bondstrength. (thermochemical) in structurally related systems ~JaI is progressively
(36):
(a) lowered in frequency (b) broadened in contour
(c) enhanced in integrated intensity
.
FIGURE 1,3 (36)
Type of Vibration Description Notation
Free Molecule H-bonded Sta£e
~ ~
,
~m
X -H /-H •••Y-R Xli stretching
/
R R
X-H) /X-~ ••Y-R' Xli in-plane
8m
/
bendingR R
X-H(} /X-I_l•••Y-R' Xli out-of- 'YXH
/
plane bending'R R
<Eo- ~
~ (XII••• Y)
Translation (RXH) ••• (Y-R' ) H-bond
stretch-J,(R-XH)1 •• 1(Y-R'),z,
ing
B
(RXH ••• YR')Translation
Hs-bond bending
6
-the XH bond which is caused by an overal reduction in -the X-H--Y bond length
(36).
~~ny early workers suggested correlations between the (X-H--Y)distance and~XH
(37,38,39),
but correlations are not good for short H-bonded species (40). More recently, Ratajczak and Thomas suggested that unique relations do not exist between the vibrational frequencies of the proton and bond lengths in O-H-Q systems (41).Parts (b) and (c) represent the most dramatic changes which occur on H-bond fornation. The bending vibrations SXH and'l'XH, on the other hand, are much narrower ani for most species the effect of H-bond formation is to reduce the band width
(36,
41). The theories which have been suggested for the band width of ~XH in O-H-Q systems are listed below (41) and can be generalised to all systems:(a) The superposition of peaks due to several different H-bonded species,
(b) Sum and difference combinations between ~OH and ~ (OH-O)
(c) Fermi resonance between ~OH, overtones, and combination bands' resulting in an enhancement of intensity of the later two. (d) The effect of proton tunneling giving rise to multiple ~OH
structure
(e) Anharmonic coupling between ~OH and low frequency H-bond vibrations.
Sheppard suggested that strong anharmonic interaction of YXH with ~ (XH-Y) together with Fenni resonance of:VXH with overtones and combin-ation bands was the most effective mechanism in accounting for band breadth
(36)•
Bratoz, Hadzi and Sheppard suggested this mechanism for ~OH... v in carboxylic acids (42). The mechanism of Lnteraotdon of~OH and ;;)(OH-Q) was studied theoretically by Marechal and Witkowski in1968 (43),
and was based on Sheppard's modification of Stepanov's mechanism(36).
7
-on absorpti-on of h.vXH the potential energy curve for the first excited state will have its equilibrium position displaced relative to that of the
ground state
(36).
This will give rise to temperature independent bands since the transitions occur from the ground state to sub-levels of the first excited state(36).
Marechal and Witkowski proposed a mechanism of coupling of X-H-Y stretching modes with ~ (X-H) and from the equations describing the coupling they reproduced stick diagrams of the spectrum of acetic acid and imidazole, which were in good agreement with experimentaldata (43). The isotopic behaviour was also studied and found to be in good
agreement with the published spectra of D-acetic acid and imidazole-D.
They did not, however, discuss the temperature behaviour of the spectra (43~
The theoretical calculations on dimeric acetic acid were complicated by the presence of two hydrogen atoms which cannot be treated independently. They also emphasised that overtones and combination bands falling in the region
of ~OH would be enhanced in intensity by Fermi resonance with ~OH. Marechal and Witkowski reported a calculation on imidazole and suggested a similar mechanism for the band breadth of ~NH (43). This mechanism may account for the failure of earlier workers to find a simple relationship between vNH
and low frequency H-bond vibrations in imidazole and purines (44, 45).
Marechal and Witkowski emphasised again that overtone and combination bands will complicate the region of
VNH
in imidazole.In many systems, particularly HF 2-, the structure of\lXII is smooth even at low temperature
(36).
Stepanov suggested a theory, called thePredissociated theory, where a continuum of energy levels were produced fram overlap of different 'VXH~Y energy levels of ground and first excited states of the proton
(36).
Whether such a mechanism operates, however, is still an open question(36).
Salthouse and Waddington have recently suggested a, temperature
independent mechanism which accounts for the smooth contour of VFH in KHF2(46).
8
-splits the energy levels.~a t~e sarnemanner as dipole dipole iRteraetieflS eauses eRergy 10\"01 splittiflp:;aRd baRd breaEieRiRgin ::lelia I5tate~a<iIt
signals. The splitting is dependent on the distance separating HF2- units and because of the large number of near neighbo~rs the overal effect is a near continuum of energy levels. This theory was tested by isolating HF2 in
alkali halide host lattices. Narrow bands were observed for
vNl
and6HF which sharpened further at-196°C.
Sharp bands were also observed for DF2- and in the spectrum of4dilute isotopic mixture of HF2-(~6, 61).
A mechanism for band broadening in n-decanol was suggested which was similar to the one proposed for HF2-(~7). Low temperature polarised IR spectra of dilute isotopic mixtures of n-decanol indicated that~OH
in the chain structure was canposed of two bands, viz. in-phase and out-of-phase motions of the hydrogen atom. It was suggested that the in-phase motion was broader than the olt-of-phase motion because of interactions of
the hydrogen motion along the chain in the former. Isotopic dilution
removed the coupling and hence sharp bands were observed for both vibrations
(~7) •
Although neighbo~ring group interactions seems a plausible mechanism in HF2 and in n-decanol, it cannot be regarded, at present, as being the dominant mechandsm in all systems (45). For example, the breadth of ~ NIl in purines and imida?ole does not sharpen appreciably with isotopic dilution
(~, ~5).
However, the one thing that is clear is that all mechanisms can9
-4. HydroNen Dihalides
The most thoroughly understood anionic H-bond is HF2-. Evidence based on the techniques tabulated below suggest that the proton is residing in a symmetric single potential energy well which has a small amount of quartic character (49).
Technioue
IR spectrum )
) spectrum) ~ Polarised
m
Raman Spectrum Crystal Entropyl't,JR (solid phase)
Neutron Diffraction Inelastic Neutron Scattering (cold)
Information obtained
Assignments consistent with DOC) h
o
Zero entropy at 0 K
Absence of proton tunneling (KHF2) Root mean square amplitude of vibrations of H and D
Absence of transitions associated.
with doub Ie minimum in KHF2
ref. (50) (51) (52) (7) (53) (29, 35) (54)
The distinction between cases 3 and 4 (fig. 1,2) was made on the basis of neutron diffraction and IR data (29). From neutron diffraction data the mean square amplituda of vibration of Hand D alone was calculated and
compared with the value obtained from
m
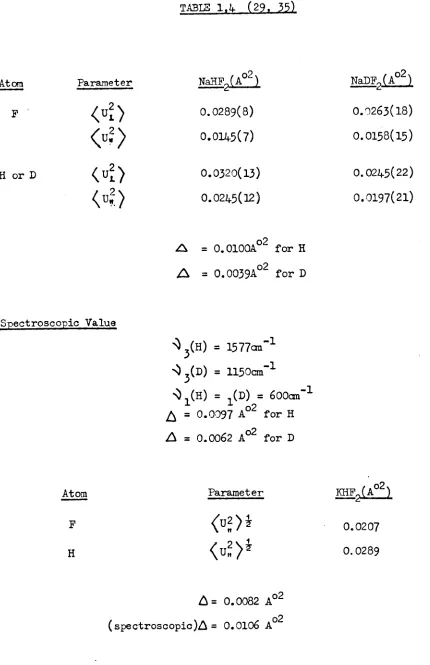
data assuming a potential energy well similar to case 4, (fig. 1,2.) (29). Ibers and McGaw repeated thecalculation assuming H and D were off centre in a symmetric double minimum potential energy well (29). It was concluded from a comparison ofAfor cases 3 and 4 with A from neutron diffraction that case 4 was more realistic (29). Ibers repeated the calculation ..for KHF2 using the same equations as shown below, and arrived at a similar conclusion (35). Further details are shown in table 1,4.
~ =
<u~)H - <u~>F=
(b/16n2mF) [ (2~ -VIIH ~
3) -(l/v
1)]where~J=
oVm
~,=
V(m-F)~ =
mean square amplitude of vibration of H or D alone mF,nn=
mass of F and H"respectivelyTABLE 1,~ (29. 35)
Atom Parameter NaHF2(A02) NaDF2(A02)
F
<ui)
0.0289(8) 0.0263(18)<u~>
0.0145(7) 0.0158(15)H or D
( ui)
0.0320(13) O.O2~5(22)\ u;)
0.O2~5(12) 0.0197(21)A
=
0.010OA02 for HA
=
0.0039A02 for DSpectroscopic Value
~ 3(H)
=
157700-1~ 3(D)
=
1150cm-1~ 1 (H) = 1 (D) = 6OOan-1 02
~ =
0.0097 A for Hf).
=
0.0062 A02 for D~ Parameter llliF2(A 02)
F
<u~)!
0.0207H
<u~)!
0.028910
-The analogous compounds for the remainder of group 7 have only been prepared comparatively recently (see table 1.1). Waddington isolated Me
4
NHC12 in 1?58 and its IR spectrum was ~ssigned by comparison with HF2-(10). However, Evans and Lo have more recently examined the IRspectrum of HC12 - with different cations and ccncluded that the symmetry of HC12 - was dependent on the cation used (55)-. NI'~ work on Me4NHC12 and
Et4NHC12 suggested that HC12- was asymmetric in the former and symmetric in
the latter (56, 57), which agreed with their IR work (55). In 1967, Nibler and Pimentel suggested that in CSHC12, which is stable at -80oC, HC12-possessed C symmetry
(9).
The HC12- ion is still, therefore, a subjectoov
of controversy. A neutron diffraction study would contribute a great deal in determining its structure but, Unfortunately, the hygroscopic nature of the compounds render diffraction and polarised IR work very difficult. Neutron diffraction data is, however, now available on a compound formulated as
1 + - -( )
CsC12
3H
30 HC12 which was thought to contain HC12 58-60. Schroeder and Ibers confirmed the presence of HC12- and suggested that a mirror plane exists through the hydrogen atom which reflects one chlorine into the other (58). They were unable, however, to record an IR spectrum (58)~Neutron inelastic scattering and further NQR experiments may, however, throw light on the controversy centred on HC12- (61).
5. Acid Salts of Monobasic Acids
Acid salts of monobasic carboxylic acids have associated with them a short 0--0 bond length in the range 2.4Ao - 2.5Ao (table 1,5.). Coulson has suggested that in H-bonds shorter than 2.45Ao the hydrogen atom will. reside ina symmetric single potential energy well (62). Speakman
TABIE I, 5.
Acid Salt s of Monobasic Carboxylic Acids Type A.
H-bond Syrmnetry O_OAo ref.
KH Bisphenylacetate C. 2.445 (66, 67, 68)
~
KH Di-p-hydroxybenzoate C. 2.458+0.006 (85,86)
hydrate ~
KH Dibenzoate C. 2.51 (87)
~
NaB Diacetate C2 2.4333 (88)
RbHDi-o-nitrobenzoate C. 2.43+ol01 (64)
~
NH~ Dicinamate C. .2.51+0.03 (89)
~
K(or NH4, Rb) H Di-p-
c.
2.457+0.013 (90)~
. ch1orobenzoate..
KH Di-trifluoroacetate C. 2.435 (91)
a
csa
Di-trifluoroacetate C. 2.38.:!:,0.03 (91)~
RbH Diaspirinate Ci 2.48+0.02 (92)
KH Diaspirinate C.a 2.455+0.005 (93)
KH Diaspirinate C . 2.448 (70)
.~
KH Dianisate C2 2.476 (94)
Type B.
KH Di-p-nitrobenzoate Cl 2.49 (64)
RbH Bisglycollate Cs 2.53 (95)
KH Diformate Cl 2.45 (65)
NH~ Disalicylate hydrate range from (96)
11
-Speakman suggested that in type A salt sI where the carboxylate groups are crystallographicaUy identical, the proton can be considered as being symmetrically placed between the two oxygens. Also, the R-002 groups are intermediate in character between the carboxylate and catrboxyl group, which is born out in the parameters detennined from x-ray diffraction (63).
Type B salts, which also have short 0--0 distances, are representative of those anions where the two carboxylate groups ara. crystallographica1ly distinct and also different in their dimensions (64). A recent example is potassium hydrogen diformate, but no details were available on the position of the hydrogen atom (65).
Ha~i and Novak have pointed out that the distinction between a symmetric H-bond and a case where the hydrogen atom is evenly distributed between two
positions of minimum potential energy cannot be made by diffraction techniques alone (30). HaaZi suggested that spectroscopic data is much better suited
for this purpose (30). However, in view of the work of Ibers et a1 on HF2-even spectroscopic data is not sufficient at present, though it is still probably the best guide (?9).
A typical example of a type A salt is potassium hydrogen bisphenylacetate, KHP2• X-ray diffraction (66) and neutron diffraction (67, 68) suggest that
the hydrogen atom is situated midway between the two oxygen atoms and the symmetry of the anion, as implied by the space group C2/ , is C .• Its IR
s J.
spectrum, characteristic of type A salts, has no band above 180Ocm-l which
12
-in-phase motion will be IR inactive and Raman active. The effect of this will be that the spectrum will not be a superposition of the acid and base spectrum. The short H-bond length of 2.44Ao (66) suggests, from
frequency-bond length relationships, that ~OH should be around 1700cm -1 (38). Since only one strong band, i.e. a very broad .vC=O, was observed in this region Haa.Zi and Novak suggested that ~C=O and ~OH are strongly coupled together (30). On d.euteration ~C=O shifted to 16SOcm -1 and a n.ew band appeared at 132Ocm-1 which was assigned to an uncoup'l.edv Olr (30).
The location of the two bending vibrations presented a problem because of the extreme breadth and complexity in the region 1500 - 60Ocm-1 (30). However, Ha~i and Novak assigned the in-plane bend to a band at 1270cm-l which disappeared on deuteration, and the out-of-phase bend was associated with the extrema breadth in the region of 90Ocm-l• They recognised the
possibility that the potential energy surface in which the proton is residing may be an odd one, and in 1966 they suggested that ~OH may be as low as
100Ocm-1, even though this contradicted their earlier assignments (69). Recent neutron diffraction data on potassium hydrogen diaspirinate has indicated a very high root mean square amplitude of thermal vibration (~.19Ao) along the H-bond axis (70). This is to be compared with the value of O.lAo found in NaHF2(29). Based on the same calculation as Thers and McGaw used for HF2 - (29), Hamilton and co-workers suggested that ~ OH may be
less than 100Ocm-l (70). They also suggested that the thermal motion
perpendioular to the bond axis was much smaller than along the bond axis and the values of O.09Ao and 0.03Ao would give rise to a bending freque~qy in the
-1
region of 2000cm • They ooncluded by saying that the potential energy well along the bond axis was essentially flat with the proton exeouting extreme~ anharmonf,o motion (70).·
13
-is strong evidence for proton tunneling, a strongand narrow signal was
observed, whereas in KH.P2 and potassium hydrogen maleate (KHM) a weak signal was observed which was very easily saturated (71, 72). From this Blinc and Haa.Z'iconcluded that no proton tunneling exists in KHP2 or KHM and that they
were ~etric H-bonded species.
Although acid salts of type A hydrogen dicarboxylates are suspected as having a symmetric H-bond with the proton in a sing~ potential energy well a full explanation of their IR spectrum is still required. Ha~ihas
tackled the problem by examining the IR spectrum of a series of H-bonded adducts with different donor and acceptor strengths (69, 73, 74). The crystalline adducts exa~inedwere composed of phosphine, arsine and amine oxides and sulphoxides with strong acids such as HN03 and hydrogen halides (73). The liquid H-bonded adducts constituted halogenated acetic acids
with sulphoxides, phosphine oxides and other bases (74). By varying the acid and base strength in the H-bonded adducts evidence of proton transfer to the base was found in some cases, ego pyridine-n-oxide with hydrogen halides (73). Some crystalline adducts gave spectra similar to those observed for type A
salts, eg. (O<-picoline oxide)2 HBr. In the liquid adducts they observed similar features with evidence for proton transfer in some cases and speotra similar to type A salts in others (74). It was noted that spectra similar to those for type A salts were obtained when the acid and base strengths of the donor and acceptor groups were approximately equal. It was suggested, therefore, that the broad absorption centred near 130Ocm-1, which was not sensitive to change of state, was associated with the asymmetric stretch of the hydrogen atom (74). Also, the low isotopic shift observed for this band in the liquid adducts is a clear argument against a genuine symmetric
:u,.
-can, however, distort the anion thereby rendering the H-bond asymmetric (40). An exception to this may be potassium hydrogen chloromaleate, which has a short intramolecular H-bond (2.38°A), where neutron diffraction data
suggests that the hydrogen atom is midway between two non equivalent and chemically distinct carboxyl groups (76)
6.
Potassium Dihydro~en Phosphate.Proton tunne ling was invoked to explain the
m
spectrum of potassium dihydrogen phosphate (33). A neutron diffraction study was also interpreted in tenns of a double minimum potential well (77,78). Blinc and Ha~iinterpreted the doublet structure of..:)OHon the basis of a splitting of the ground and first excited states as a result of a low potential energy barrier:
Fig. 1,6
IR active bands (a) Raman active bands (b) The existence of a low frequency band (100 cm-I) was assigned to the
0-1 transition, indicated in diagram (a), and was suggested as evidence for a splitting of the ground state energy levels (79). However, Hill and Ichiki in 1968, on the basis of polarised IR studies, suggested that the
two bands at 2700an-l (0-3) and 2300(1-2) ~ KH2
ro
4 were due to coupled proton motions in the P04 units (34). They suggested that, although proton tunneling may occur in this compound, the ~pe of spectrum obtained does not require the existence of tunneling. The explanation of Hill and Ichiki seems, there-fore, to support the earlier view that if the ground state is split by10acm-l, as suggested by HadZi and Blinc, then clearly the IR spectrum should
be temperature d.epend.ent(.~.Thispoint is worth emphasising as if the
15
-and in the table belo.v. The result will be that transition 0-3 will give
rise to the most intense band and the highest in frequency. The numbers in
the columns represent the ratio NO/Niwhere No, Niare the populations of
state 0 and 1 respectively, and the population of each state is given by
NOexp( -EjKT) •
Splitting of ground state Temnerature
lOOcm-1 100m-1 lcm-1
1.62 1.49 1.05
4.26 1.56 1.14
6
4.26 1.56
1.8xlO
7.
ChromousAcid (3)Neutron diffraction studies on HCr02 and DCr02 have revealed that the
O-D-Obond in DCr02 is not centrosymmetric and that it is best represented
as a symmetric double minimumpotential case
C3,
32)• In HCr02, on the other hand, the proton is essentially centred at the mid, point between the twooxygen atoms (3,32). In HCr02 Hamilton and lbers suggested tha.t, although
the symmetry of the O~-O bond could not be determined unambiguously, the
evidence in favour of a centrosymmetric H-bond was as good as in a:ny of the
type A salts (3). Another notable feature of this system was the increase
in the O~-O distance (O.06Ao) on substituting deuterium for the hydrogen (3).
FromNMRdata on HCrO2 lbers, Holm and Adamsconcluded tha t the vibrational
amplitude of the hydrogen atom normal to the bond was greater than the
vibrational amplitude along the bond (81). This point was also evident from
the neutron diffraction study an HCr02• The thermal parameters of the
deuterium atom inDCr02were not significantly different from zero (3).
From NMRdata lbers, Holm and Adamsconcluded that although they could not
distinguish between a symmetric or asymmetrio OHObond inHCr02 they could
eliminate a model based on rapid proton tunneling between two equilibrium
16
-The IR spectrum of the HCr02 system shows anomalous isotopic behaviour and the assignments are shown below (82):
HCr02 isotopic shift DCr02
165Ocm-l 191
7
cm-1j
0\)OH(D) ~OD
1594cm -1
S OH(D) 1202cm-1 1.44- 836cm-1
Snyder and Ibers suggested that the IR data could not be accounted for on the basis of the same potential energy function in HCr02 and DCr02 (83) • Recent inelastic neutron scattering experiments on HCr02 have shown the existence of low frequency bands which can not be explained on the basis of a symmetric hydrogen bond (84). More recent theoretical calculations on the the HCr02 system have shown that it is not necessary to invoke different potential energy wells in HCr02 and JX:r02 in order to explain their IR spectrum (120). The a1terna tive explanation advanced was based on a
asymmetric double minimum potential energy well with the first excited state close to the top of the barrier (120). Such a model gives rise to low
isotopic shifts, and will be discussed in more detail in chapter four. The intention of the work recorded in this thesis was to examine spectroscopical~ a range of H-bonded anions built on acetic acid and its halogenated derivatives. The first class examined (chapter three) represent an extension of the number of XHY:- type ariioriswhere X- is a halide ion and Y is a carboxylate group. Finally in chapbeis four and five type A and type B hydrogen dicarboxylate salts have been examined using a variety of
CHAPTER TWO
-
17-Cha1')tertwo
EXPERnlENT AL TECHNIQUES
2,1. The Vactrum System
The most elegant technique for preparations which involve a nonaqueous solvent is by the use of an efficient vacuum system. FUrthermore, the use of a vacuum system minimises trace amounts of water vapour, a potential danger to the purity of hygroscopic compounds. The vacuum system employed is of the standard type used in this laboratory and is shown diagramatica1ly in fig.2,1.
The vacuum system was constructed of pyrex glass and was assembled onto a metal framework by means of clamps and bosses. The system was evacuated with a two staC3emercury diffusion pump which was backed by
a.
rota~ oil pump. A provision for preventing volatile waste material from contaminating the oil in the pump and also as a safeguard against" suck back from the oil pump was maintained in the use of a "muck" trap cooled in liquid nitrogen.Compounds were connected and removed from the system at various p"lass points on the line by apparatus fitted with standard "Quickfit" ground cones and sockets. When a compound was heated on an oil bath, tin foil was
wrapped round the joints to prevent the grease from overheating and flowing onto the compound. All the taps were greased with Apiezon-N-grease and Picein wax was used to seal sections of the system. This enabled the system to be dismantled easily after breakages and also for general cleaning of the system.
Large flasks ranging from five litre to twenty litre were connected to a section of the line for storage of large quantities of volatile
materials, e.g. hydrogen chloride and acetic acid. They were arranged so that theip contents could be used at any time and that the amount of gas inside the flask could be replenished as its quantity diminished.
18
-Figure 2,1.
LL .5:
ca
s:
Cl. (.)
E Cl
~ .= '-
c 1UQ)
.2 c i
o E
~ .;; 0
- (.) C - ca ca c..t~
C\I
19
-constant use during the course of the work and a selection is listed below: Table 2,2
Cold Bath Temperature (97)
_84°C
-95
0C-1960C
Acetone-dryice-slu~ TOluene slush Liquid nitrogen
Volatile materials were condensed in traps using liquid nitrogen as the refrigerant. Cold baths were also used extensively for purirying volatile materials whereby the appropriate choice of cold bath served as a
fractionatin~ device. This process was carried out in a special part of the line with cold baths which were arranged so that any volatile material on passing through the trap would be condensed and maintained at the
temperature of the refrigerant.
Pressure measurements were carried out by two systems: The first method was a mercu~ manometer which could measure the pressure throughout the system and was read by means of a travelling microscope. This
man-ometer was also used as a safety valve in the preparation of large <;pantities of volatile materials and guarded against the pressure exceeding one
atmosphere. The second method was a spiral rau~e used in conjunction with two wide bore mercury manometers. The deflection of the mirror in the
o
guage was about 45 per atmosphere pressure, and the pressure was measured by a null point operation using the wide bore mercury manometer.
The various parts of the line, in particular the large storage flasks and connecting tubes, were calibrated for volume by observing the pressure changes on expanding air into the system from a molecular weight bulb of known volume, fig. 2,3(a), and assuming ideal gas behaviour to apply.
2,2. The Dry Box
-
2J-the use of an efficient dry box. The dry box, which was of a standard type (Gallenkamp liIA-150),was kept dry by means of two crystallising dishes containing P205. Moisture inside, resulting from small leaks, was reduced to a minimum by stirring the drying agent at the beginning of each day and also by replacing the drying agents periodically with a fresh supply. The air in the dry box was dried quickly by recycling the air through a column of silica gel mixed with molecular sieve. An air compresser connected to the dry box performed this operation. This rrethod was particularly useful after volatile materials had been handled in the dry box.
2,3. Analytical Methods. (a) Weight Analysis
A considerable nurriberof the compounds used in this work were
prepared in a reaction cell which is shown diagramatically in fig. 2,3 (b). A good guide to the stoichiometry of the compounds prepared was obtained by the technique of weight analysis (21). This entailed weighing out the
evacuated reaction cell followed by reweighing the evacuated cell containing the dry starting material. An excess of the solvent was then condensed onto the compound in the reaction cell, care being taken to ensure that the
solvent did not come into contact with the grease an the B.24 joint. After allowing the temperature to reach room temperature, the excess solvent was pumped away and the reaction cell was reweighed. The process of pumping and reweighing was continued until no further decrease in weight was observed or, in the case of weak H-bonded species, until the desired molar ratio. was reached. It was important in all the above weighings that the grease on the B.14 joint was removed before each weighing. This was done by wiping the
-
21-Figure 2,3.
(a) Molecular Weight Bulb
. ,;
Cl)
•
C\J
•.
-u,
22 -Cb) Chemical Analysis
Chemical methods of analysis were carried out on both the anion and the cation to determine the percentage by weight of each in the compound. Cations ranging from tetramethyJonium (Me4N+) to tetra-n-bu.tylarnmonium (n-Bu
4
N+) were dete~ined by gravimetric analysis using sodium tetraphenylbor-ate as the precipitating reagent. All the compounds were dissolved inwater and any halogen present was determined as halide ion by Volhards
method (98). The percentage by weight of carboxylic acids were determined by acid-base titrations with standard sodium hydroxide.
(c) Elemental Analysis
Elemental analysis was not carried out on compounds which were
likely to decompose appreciably with time or which were particularly sensitive to air. The compounds which were examined by this nethod were type A and type B hydrogen dicarboxylate salts. The cation determina.tion was done spectrophotometrically and the anion elements by combustion techniques. These services were provided by Bernhadt Ltd. of Munich in Germany.
2.4. Preparation of Starting Materials.
(a) Tetra-n-butylammonium Chloride
Tetra-n-butylammonium iodide, obtained from British Drug Houses, was dissolved in a small volume of speotroscopic methanol and an excess of a freshly prepared silver chloride suspension in methanol was added. The solution was allowed to stand in the dark for about an hour in order that c~plete exchange had occurred. The silver iodide precipitate was then filtered off and the filtrate was evaporated down until an orange brown 6il remained. The oil was dissolved in redistilled benzene. The benzene was distilled off, and the process of dissolution and distillation repeated twice more. The brownish solid was washed several times with dry ether and
gradually the compound became white. The last traces of ether were removed
traces of water, methanol or ether and was similar to a spectrum of n-Bu
4
NI.Cb) Carboxylic Acids
The carboxylic acids employed were Anala R grade where possible and those which were volatile enough were purified further by distillation on the vacuum line, followed by storing them in fractionating traps. Prior to this operation, the liquid carboxylic acids were dried over molecular sieve. The purity of the volatile acids were checked by gas and liquid phase IR spectra. The results were found to be in good agreement with published spectra. Those acids which were solid at room temperature were pumped ~ on the vacuum line and their IR spectra were checked with the literature and found to be in agreement. The melting points were also found to be in
agreement with the literature values. (c) Deutero Carbo;ylic Acids
Acids were deuterated in the hydroxyl position by adding the
stoichiometric quantity of deuterium oxide, obtained from Novsk and Hydro Elektrisch, to the anhydride of the acid. The process was carried out in
a reaction cell which was warmed to accelerate the reaction. The deutero acid was then frozen down in liquid nitrogen and degassed on the vacuum line. They were finally stored in a section of the fnctionatino; chain which was reserved for deutero acids. An IR spectrum was examined to determine the amount of deutero acid present. Deutero samples of acetic and trifluoroacetic acids were prepared by this method.
In the case of dichloromaleic acid, which exists as a solid, the deutero acid was prepared by adding an excess of D20 to the anhydride followed by pumping to remove the excess D20. The anhydride was obtained from Ralph N. EmanuaL Ltd.
Deuteroformic acid was prepared in the apparatus shown in fig. 2.4.
-
24-Figure 2,4.
·'
v
.
~
N
Cl
._
u,
-
25-and was an 85% solution in D20. The deuteroformic acid liberated was
pumped away and collected in a liquid nitrogen trap. Heating was necessary to decompose any H-bonded species formed with sodium formate. The acid was dried by exposing it to anhydrous copper sulphate followed by vacuum
distillation (99). Its IR spectrum was found to be in good agreement with published spectra.
( d) Simnle Salts!
Carboxyla te salts of Group 1 metals were prepared by adding the
stoichiometric amount of acid to the carbonate dissolved in a small amount c£
water. After effervescence had ceased the water was pumped away on the vacuum line. .An IR spectrum was recorded to check the purity of the
compound. In some cases, ego halogenated carboxylates, prolonged pumping on an oil bath at 1100C was necessary to remove the last traces of water.
(e) Solvents
~~L__
~E~f~s~~~~~_~f_2~!~~!~~
Anala R grade chloroform, obtained from Hopkin and Williams, contains about
~/o
ethanol and was removed by the following procedure:To Anala R chloroform (50Qnl) contaired in a separating funnel
(ioooa) a small quantity of concentrated sulphuric acid (lOrnl)was added. After shaking the solution for about ten minutes the hea'tier layer of
sulphuric acid was separated off leaving the chloroform behind in the funnel. This process was repeated about five times by i\hich time all the ethanol had been removed. Distilled water (25Qnl) was then added to the chloroform and the solution was shaken for about five minutes. The chloroform layer was separated off and the process was repeated with a fresh supply of water. The procedure was continued until the chloroform was neutral to phenolphthalein. The chloroform was final~ stored in a dark bottle over molecular sieve.
28
-~~~2
__
~~~~~!~~~_E~~~~~~~~
This compound was obtained from Hopkin and Williams and was stored over molecular sieve to remove any water present.
2,
5.
Low Temperature Infrared CellsThe IR spectrum of most of the species prepared in this work were recorded at both room and liquid nitrogen temperatures. Very late on in the course of the work one compound was exarninedat the temperature of liquid helium. Both these cells were constructed entirely in pyrex glass by Mr. K. Holden.
!_(~2
__
~~S~~~_~~~E~g~~_!~~~~~_g~!!
A diagram of this cell is shown in fig.
2.5.
The cell is made up of three sections. The first, part A, is essentially a silvered dewar with a pyrex-kovar seal at its base. A copper rod about three inches long inside the liquid nitrogen section of the dewar served to speed up the rate of cooling of the copper block, C. The bottom part of the cell, B, contained a pair of CsI plates piceined onto the flanged portholes in B. Part C is a copper block with a screw thread connecting it to the copper part of A. A pair of CsI plates were placed in C and contained the mull of the material under investigation. The cell was evacuated by means of an outlet in B which was conre cted to a tap by means of a cone and socket joint. Finally the copper block C was arranged so that its centre coincided with the centre of the windows on the outside of B.~2l--~~~~~~-~!-~£~~~~~~~
Once the cell had been set up and all taps and joints had been
27
-Figure 2, 5.
I·'·~· .
..
B
A
A
• ·",t··
0'
28
-Figure 2,6.
E
.::J Q)
-0:::
._ Q).
u.
-~ -~
~============
._ 0
-•
•"-."
'.'
c.
. 'E
D::J.0...
-II
. I
(0
,
.
N
.-LL
c
Q)
-c
g
-::J ....
eT·~
Q)=ZU
29
-produced by the high voltage discharge. Li~id nitrogen was then quickly poured in up to the top of the dewar. The initial boil off of nitrogen was high, consequently the contents of the dewar had to be topped up soon
after the initial one. This was necessary to prevent the nitrogen level from falling too low and allowing ice to form in the region of the copper rod thus giving rise to bad thermal conductivity between the copper and the nitrogen. Once the boil off of nitrogen had reached a steady' state, the
system was left for about thirty minutes in order that the plates inside the block had reached thermal equilibrium. The dewar was topped up during this
period whenever the level dropped too low. Measurement of the temperature of the plates by a thermocouple showed that the plates were at the
tempelature of liquid nitrogen (100).
Spectra were recorded by isolating the cell from the pumping system and clamping it in the region of the sample beam of the spectrometer. Accidents as a result of the cell slipping were prevented by resting the cellon a cork ring. Once the cell was in position, slight adjustments were made to ensure that the alignment of the cell gave maximum optical transparency. A polythene sheet was used to enclose the system from water vapour and
the enclosure was finally purged with dry air. Slow scans were then necessary to obtain accurate pen response.
a(~L-_~~S~~~
Helium Cell---The liquid helium cell is shown diagramatica1ly in fig. 2,7. Working at the temperature of liquid helium demands precision work in the construc-tion of the glassware. Also, in order that the helium remains liquid for any length of time, it was necessary to have the liquid helium dewar inside another dewar containing liquid nitrogen. These requirements, along with the minimum heat losses, required that the overall length of the cell was l18.5cm.
30
-Figure 2, 7
11'·:-I
I
u.. ,I I,
~·I
,!I:
T
I' II~c ..
I
T
IS-c"\
.
1···.·: I
31
-nitrogen dewar, which supported the weight of the liquid helium dewar at the flanged joint, had a vacuum jacket on the outside. The liquid helium dewar had a Kovar-pyrex seal which was connected to a copper block containing a sample of the compound under investigation. The copper rod extended six inches into the liquid helium dewar. A metal baffle was situated about six inches above the liquid helium level. At the top of the dewar a brass plate was piceined onto the glass so that the helium was not exposed to the
atmosphere except for two holes in the plate, which were used in the transfer operation. The liquid nitrogen dewar encased the whole of the bottom part of the system except for a pair of CsI plates which were piceinedonto the portholes in the glass.
g(~2-_~~~~~_~f_QE~E~~!~~
The liquid Helium cell rested on a tripod in the sample area of a Perkin Elmer 621 spectrometer. The tripod had adjustable legs so that the cell could be aligned in the beam and adjusted for maximum optical trans-parency. A polythene sheet was wrapped round the bottom of the cell and the enclosure was purged with dry air. The system was evacuated through a B.19)
joint on the side of the cell. This operation had to be performed very slowly at first in order to minimise the risk of implosion. Thirty minutes pumping on the rotary oil pump was sufficient for the mercury diffusion pump to take over. This pumping was continued for about two hour-a,in which time a room temperature spectrum was recorded. The helium section of the dewar was also evacuated to keep the compartment dry.
Liquid nitrogen was then poured into the cell at the side of the dewar shown in the diagram. The dewar was filled up to the top with nitrogen and the level could be seen through an unsilvered strip of glass which extended along the length of the dewar. A source of light was put on the opposite side of the dewar to illuminate the level of the nitrogen. Once the level of
32
-the cell was isolated from -the pumping system. The copper block was conse-quently cooled by radiation from the liquid nitrogen which surrounded
it. The system was then left for about two hours. The level of the nitrogen remained essentially unchanged during this period of time, and could be left overnight if necessa~. A li~id nitrogen spectrum was recorded during this time, followed by further pumping of the system.
g{~2
__
!~~~~!:~_~!_~!~~~~_~~!!~~
The transfer of liquid helium could not be performed by one person and so Mr. K. Holden and Mr. C. Worland assisted in the operations. The vacuum inside the liquid helium compartment was released by allowing a flow of gaseous helium to be sucked in from a helium cylinder. A long piece of rubber tubing was used so that the lower part of the cell near the copper rod was under a helium atmosphere. A rapid flow of helium was necessa~ to expel all traces of air and was continued until just before the transfer operation. This operation was important as any nitrogen or water vapour present would be frozen down on the copper rod once liquid helium was in the dewar. This would result in poor thermal conductivi~ between the copper rod and the
liquid helium and also in a rapid boil off of the helium.
The transfer tube is shown diagramatically in fig. 2,8 and was made of stainless steel. A vacuum jacket served to reduce heat losses during the transfer operation. The system was rigid except for an extension tube on one limb which was connected by means of a small piece of rubber tubing. This extension was necessary so that the liquid helium could be poured directly onto the copper rod in the liquid helium cell. Immediate~ before the transfer operation, the transfer tube was flushed with warm helium.
The dewar containing the liquid helium was accurately placed three feet from the heli~ cell so that the necks of each were at about the same hei~ht.
33
-Figure 2,8
-
-til'
Q)
(J
N Q)
::I:
"0 "0
0
~ :::J
"j
C'{
U
!
..J ,
0
,
co
•
C\J
• CJ)=
._
u,
34
-solidify once it was exposed to cold gaseous helium. As soon as the tube was in position, the flow of helium from the cylinder was stopped and the transfer tube was fixed tightly in position by means of rubber bungs. As the pressure built up inside the liquid helium dewar, as a result of contact with the stainless Seel tubing, the rubber bladder inflated. The transfer
of helium was then assisted by squeezing the bladder. Initially the helium was gaseous because of heat conduction by the transfer tube, and it
provided a means of expelling the last traces of air in the cell and also for gradually cooling the glass. During the transfer operation, the outlet tube which extended from the top of the helium cell to a window was checked to see
if helium was caning out. If it was not, then a solid air blockage was suspected. When this occurred the system was dismantled and ,the whole
transfer operation was started again. At any stage during the operation, if the bladder became too large, then the pressure in the system was reauced by means of a valve near the neck of the helium dewar.
After about fifteen minutes, liquid helium began to syphon over into the liquid helium cell. The helium level rose very quickly and the level could be seen through the unsilvered strip of glass. The transfer of the helium was stopped once the level reached a two litre mark shown on the side of the cell. Additional heat losses by conduction were prevented by removing the transfer tube after the operation. This again required speed and was
followed by stoppering the hole where the transfer tube had been. The long piece of tubing from the outlet was replaced by a pressure valve. Greased taps could not be used near the top of the dewar as the rubber tubing by this stage, was very hard. Also in the removal operation, the extension on the transfer tube had to be cut at the rubber connection for speed in the removal operation.
35
-recorded once the level of the helium remained steady.
The system was left for about two days before it was certain that all the helium was gone. This was necessa~ as ifany air was trapped
mn
the liquid helium, then this could result in an explosion caused by coJtriction of the he lium.2, 6. Spectrometers.
Perkin Elmer models 137, 237, 337 and 457 were used for ro~tine work and the 621 model was employed for the greater part of the work. The range of each model is shown below:
621 4000 - 200cm-l.
337 4000 - 400cm-1
237 4000 - 625cm-1
137 4000 - 650cm-1
457 4000 - 250cm-1
All the spectrometers had the same dimensions in the sample area and so low temperature spectra could be recorded on each instrument.
Far infrared spectra were recorded with a RIIC-720 far infrared interferometer at Leicester University which was kindly made available by
Dr. D. M. Adams.
Raman Spectra were recorded with a Ca~ 81 Spectrometer at Imperial College, with the kind help of Dr. D. Evans.
Inelastic Neutron Scattering work was performed on a Dido G.H. cold neutron time-of-f1ight spectrometer at Harwell with the kind help of
Dr. G. C. Stirling.
t~L__
~~~!~~~_~:~~~!~_~~~~~~~~~_~~~~~~~~~~E
36
-resonance experiments, working at a constant frequency of 60 Mc/s. All
o
spectra were recorded at 33 C, the thermostat temperature between the pole pieces of the permanent magnet.
t~~
__
~~~_~~~!~~~_2~~~E~~~_~~~~~~~~~_~~~~~~~~~~
A super regenerative oscillator provided the frequency scan in the spectrometer emplqyed. The resonance condition was detected by a phase sensi-tive detector and Zeeman modulation together with side band suppression. The range of the spectrometer was 5 - 60 Mc/sJand 350I resonance in the powder
samples were observed in the range 30 - 40 Mc/s. The spectrometer is now marketed by Decca Ltd. Facilities were provided by Dr. J. A. S. Smith and
CHAPTER THREE
37
-Cha pter Three
Asymmetric Hydrogen Bonded Anions
Introduction
Asymmetric H-bonded anions, XHY , are defined as those cases where
-
-the proton is situated between two chemically different anions, X and Y • This definition serves to relate the anions discussed in this chapter with
type B hydrogen dicarboxyla te anions where the asymmetry arises from the crystallographic nonequivalence of the two carboxylate groups. Type B salts will, however. be discussed in detail in chapter four. In the definition, no mention was made to the proton position in relation to the groups bonded to it. The latter will be discussed in terms of the shape of the potenti8ll energy wells shown in chapter 1.
FUller pointed out that the chemical nature of the donor and acceptor groups determines the shape of the potential energy well in H-bonded species (31). Ubbelohde and Gallagher developed the idea of acid-base equilibria. (101), which has been emphasised more recently by HadZi
(75).
The acid-base idea can be explained qualitately by considering any H-bonded species, M-B, in termsof the pK values of the acids Aa and BH~. A H-bond with the proton situated
a
in a symmetric single minimum potential energy well mid-way between A- and B is possible when the pKa values of BH+ and .AH are identical and providing
the overal H-bond length is short
(75,
101). Deviations from the latter, as a result of the ground state levels of the proton (proton levels) notcoinciding, will give rise to an asymmetric potential well of the type discussed in Chapter 1. Since the probabili~ of identical pK values is
a
small, the difference in the proton levels will be the dOminating factor in determining the shape of the well
(69, 75).
Crystal packing and H-bond length are, therefore, secondary factors in the systems discussed in this chapter(69, 75).
Since pK values cannot be measured in the solid phase, recourse' must
a
- 38
of the potential well since a common standard is necessary. Hadti overcame some of these difficulties by comparing the acceptor strength of different bases
m
methanol, using the shift of ~OH from pure methanol as a measureof the basic strength,
(69).
H-bond strength was defined as the extent to which p~oton donor-proton acceptor interaction occurs, as measured by theshift of ~OH from the non-Hs-bonded state, and was not used strictly in a thermodynamic sense (74). A study of a wide range of liquid and crystalline H-bonded adducts suggested that the H-bond strength is dependent on the acid
and base strengths
(69,
73, 74) •.,
Hadzi studied H-bonded adducts of bases such as phosphine oxide and pyridine-N-oxide with acids such as HN03 and C13CCOZH (73, 74). Crystalline adducts were obtained
m
many cases (73). The adducts were divided into two'groups
(69).
The first group were characterised by a trio of bands between-1 -1
1800cm and 3000cm as exemplified by the three ch1oroacetic acids with
,
bases such as su1phoxides and' phosphine oxides. The second group constituted stronger bases such as triphenylarsine oxide wi th C13CCO~. The latter groip
gave spectra with broad absorption be1mv 2000cm-1 which resembled spectra
obtained from type A hydrogen dicarboxylate salts. The origin of the trio bands in group one adducts was discussed and the conclusion reached was that one
of the bands represented ~OH while the other two were probably overtones of the two bending vibrations, enhanced in intensi~ by Fermi resonance with
•
VOH (69,
74). By va~ing the acid and base strengths, and consequent~ thedifference between the proton levels, the spectral features remained the same except for changes in the relative intensities of the trio of bands. The latter was attributed to the gradual shift of ~OH to lower frequency as the H-bond strength increased, thus altering the extent of Fermi resonance The possibility of formation of a ~mmetric potential well is reached when the proton levels are close, hence the broad absorption below 2000cm-1
(69).
The latter was observed in adducts of C13CCO H with strong bases and will be
. 2
39
-Assignments of the IR spectrum of adducts of HBr and Hel with
pyridine oxide indicated that~BrH was higher in frequency than~Clli (73).
Ha&ri suggested that proton transfer to the p,yridine oxide occurs in both adducts. This emphasises that if proton transfer occurs in a H-bonded adduct
then vibrational frequencies of the latter will differ considerably from that
expected from analogous vibrations in the original acid and base. This is
exemplified, also by the adduct of HN03with phosphine oxide where bands
were found at frequencies si~ilar to that of HN03" Proton transfer, on the
oth~ hand, would have resulted in bands characteristic of N03- (73).
Since an understanding of the spectra of H-bonded species have been
obtained from a knowledge of acid-base strengths, the work recorded in this chapter will be discussed on a similar basis. However, before the new work
is presented, the work leading to the study of the new H-bonded anions is
outlined.
In 1964 Salthouse and Waddington reported HCmr- and HClI- as the
first examples of asymmetric H-bonded anions (15). Assd.gnrrerrts (table 3,1)
were based on a linear triatomic model giving rise to the four IR active
vibrations shownbelow:
\x
)T-
-y7
~lX HT- - - - y
degenerate bend ~ 2
X H - -y
+
fx
7-
-f;-
~3Evans and La, in 1966, studied the
m
and Ramanspectrum of HCmr-with different cations (102). Although the precise band positions weredifficult to locate exactly, they suggested that the cation influenced the
H-bond strength, and in all cases the proton was residing in an asymmetric
potential well (see table 3,1.)
T"'lBIE3. 1
!~~~~~5~~~_~~~_~~!~~~~~~_~!22
Anion (-) Cation (+) ~3 IS(~) ~2 IS ~1
HClEr Bu4N
1700}
lo31
1100~1.34
DelBr Bu4N 1300 )
HCli BUJ!l 2000-2050) 990)
~1.35 t1.39
Dell Bu4N 1500 730
~!~~-~~~-~~-(~L_!Q~L
HJ~Cl Et4N 2710 843 275
Hfl3r Et4N 2900 740 220
HFI Et4N 3145 635 180
HClBr Me N 1890 1036 145
1+
HClBr Et4N 157
J
1165) 1701.21
:-~48~1.37
DClBr Et4N 13 165
HClBr Pr4N
1550l
1145) 1721.24 ~1.37
DClBr Pr4N 1250 838 165
HClBr Bu4N
173°l
1.28llOOl
1.38DClBr Bu4N 1350 800
HClBr Ft4N 1650) 1148) 165
~1.22 ~1.38
DClBr Ft4N 1350 830
HClBr (Me)3C16H3! 1880 1070 155
~~~!~~-~~-~~~~~~!_(2L
HCli Cs 2200~
485~
1.34- 1.39
Dell