ORIGINAL RESEARCH
BRAIN
Correlation of MRI-Derived Apparent Diffusion Coefficients in
Newly Diagnosed Gliomas with [
18
F]-Fluoro-L-Dopa PET:
What Are We Really Measuring with Minimum ADC?
S. Rose, M. Fay, P. Thomas, P. Bourgeat, N. Dowson, O. Salvado, Y. Gal, A. Coulthard, and S. Crozier
ABSTRACT
BACKGROUND AND PURPOSE:There is significant interest in whether diffusion-weighted MR imaging indices, such as the minimum apparent diffusion coefficient, may be useful clinically for preoperative tumor grading and treatment planning. To help establish the pathologic correlate of minimum ADC, we undertook a study investigating the relationship between minimum ADC and maximum FDOPA PET uptake in patients with newly diagnosed glioblastoma multiforme.
MATERIALS AND METHODS: MR imaging and FDOPA PET data were acquired preoperatively from 15 patients who were subsequently diagnosed with high-grade brain tumor (WHO grade III or IV) by histopathologic analysis. ADC and SUVR normalized FDOPA PET maps were registered to the corresponding CE MR imaging. Regions of minimum ADC within the FDOPA-defined tumor volume were anatomically correlated with areas of maximum FDOPA SUVR uptake.
RESULTS:Minimal anatomic overlap was found between regions exhibiting minimum ADC (a putative marker of tumor cellularity) and maximum FDOPA SUVR uptake (a marker of tumor infiltration and proliferation). FDOPA SUVR measures for tumoral regions exhibiting minimum ADC (1.36⫾0.22) were significantly reduced compared with those with maximum FDOPA uptake (2.45⫾0.88,P⫽.0001).
CONCLUSIONS: There was a poor correlation between minimum ADC and the most viable/aggressive component of high-grade gliomas. This study suggests that other factors, such as tissue compression and ischemia, may be contributing to restricted diffusion in GBM. Caution should be exercised in the clinical use of minimum ADC as a marker of tumor grade and the use of this index for guiding tumor biopsies preoperatively.
ABBREVIATIONS:CE⫽contrast-enhanced; FDOPA⫽3,4-dihydroxy-6-[18
F]-fluoro-L-phenylalanine; GBM⫽glioblastoma multiforme; SUVR⫽standardized uptake value ratio; WHO⫽World Health Organization
D
espite the recent advances in neurosurgical resection tech-niques and adjuvant therapies, the median survival for pa-tients diagnosed with glioblastoma multiforme remains poor at ⬍15 months.1This devastating outcome can be attributed to 2 major factors: 1) the limitation of currently used diagnosticim-aging, in particular MR imaging technology, to provide clinically relevant information about tumor proliferation and physiology; and 2) the failure of current therapies for targeting extremely invasive proliferating tumor cells, in many cases anatomically iso-lated from the main tumor mass. Routine contrast-enhanced MR imaging plays a pivotal role in the planning of treatment strate-gies. However, CE MR imaging only detects dysfunction of the blood-brain barrier, which, in many cases, may not correspond with tumor proliferation or other molecular events.2 Many of these limitations have been overcome by using PET molecular imaging technology with amino acid– based tumor cell tracers, such as methyl-11C-L-methionine3 and 3,4-dihydroxy-6-[18 F]-fluoro-L-phenylalanine.4,5Such tracers have been shown to be superior in the diagnostic assessment of patients with brain tumor compared with CE MR imaging and 2-deoxy-2-[18 F]fluorode-oxyglucose PET.4,6
Due to the invasiveness and logistic constraints associated with routine clinical PET imaging, significant interest has been directed toward the clinical development of diffusion-weighted
Received February 21, 20102; accepted after revision July 6.
From the Centre for Clinical Research (S.R.), Centre for Medical Diagnostic Tech-nologies in Queensland (Y.G., S.C.), and Discipline of Medical Imaging (A.C.), Univer-sity of Queensland, St Lucia, Brisbane, Australia; and Department of Radiation On-cology (M.F.), Queensland PET Service (P.T.), Australian e-Health Research Centre (P.B., O.S., S.R.), Commonwealth Scientific and Industrial Research Organization; and Department of Medical Imaging (A.C.), Royal Brisbane and Women’s Hospital, Herston, Brisbane, Australia.
This work was funded by the National Health and Medical Research Council (grant 631567) and a Queensland Government National and International Alliances Re-search Program grant.
Please address correspondence to Stephen Rose, PhD, Centre for Clinical Re-search, Royal Brisbane and Women’s Hospital, Brisbane 4029, Australia; e-mail: [email protected]
MR imaging indices, such as the apparent diffusion coefficient, for preoperative tumor grading and treatment planning.7Because ADC provides quantitative information about tumor physiology on a macroscopic scale, the technique shows promise for aiding image-guided therapy, especially within biologically heteroge-neous tumors such as GBM. However, the clinical utility of the technique for assessing tumor grade has yet to be established. Numerous studies have reported mixed findings regarding the use of ADC to measure tumor grade.8-11The rationale behind the use of ADC indices is based on the premise that tumor cellularity is inversely related to the ADC (ie, tumoral regions with low, some-times termed “minimum,” ADC correspond to areas of high cel-lularity).7One study has shown a significant correlation between minimum ADC and a measure of proliferation index (Ki– 67) for astrocytic tumors in general; however, this correlation was not significant for GBM alone.12Because no study has yet performed minimum ADC–image-guided biopsy for histologic confirma-tion, this assumption remains highly speculative. Despite this constraint, a significant correlation has been established between the minimum ADC and reduced patient survival.9,13
A recent study aimed at investigating the relationship between minimum ADC and FDG-PET reported correlations between re-gions of low ADC and enhanced FDG uptake in patients with GBM.13However, the clinical interpretation of FDG uptake in primary brain tumors is complex due to high background glucose metabolism, especially within the cortex, and false-positive up-take associated with inflammatory and granulomatous disease.14 To help establish the pathologic correlate of minimum ADC, we undertook a preliminary study investigating the relationship be-tween minimum ADC and FDOPA PET uptake in patients with newly diagnosed GBM. Recent studies have shown that FDOPA has similar tumor uptake compared with methyl-11 C-L-methio-nine, resulting in a significant improvement in diagnostic accu-racy compared with FDG-PET in evaluating both low- and high-grade tumors.4,15Furthermore the kinetic modeling of FDOPA uptake has been shown to be useful for establishing tumor grade16 and has recently been shown to correlate with tumor Ki-67 pro-liferation indices in newly diagnosed gliomas.17Our underlying hypothesis is that if minimum ADC corresponds to regions of high tumor cellularity, then tumoral regions of low ADC should overlap considerably areas of high FDOPA uptake.
MATERIALS AND METHODS
The institutional review board approved the study and written informed consent was obtained from each participant.
Patients
Data from 15 patients (10 men; age range, 47– 85 years) with histopathologically confirmed high-grade brain tumor (WHO grade III or IV) were used in this study. These patients were en-rolled in a larger study aimed at developing FDOPA PET–MR imaging fusion-guided therapy for patients with primary brain tumors.
Imaging Protocols
Both the MR imaging and FDOPA PET studies were performed within 48 hours before tumor resection. MR imaging scans were
performed by using a 3T Tim Trio scanner (Siemens, Erlangen, Germany). Routine diagnostic scans were supplemented with standard T1-weighted MR imaging scans (1-mm isotropic reso-lution) acquired before and after administration of contrast agent (0.1 mmol/kg of body weight, gadodiamide; Amersham Health, Oslo, Norway). Diffusion images were acquired by using high-angular-resolution diffusion imaging with the following parame-ters: 60 axial sections; FOV, 30⫻30 cm; TR/TE, 9200/112 ms; 2.5-mm section thickness; acquisition matrix, 128⫻128 with a 2.3 mm in-plane image resolution; acceleration factor of 2; and maximum diffusion-encoding gradient strength of b ⫽ 3000 s/mm⫺2.
Sixty-five diffusion-weighted images were acquired at each lo-cation consisting of 1 low- (b ⫽ 0) and 64 high-diffusion-weighted images. The acquisition time for the diffusion dataset was 9.67 minutes. A field map for the diffusion data was acquired by using two 3D gradient recalled-echo images (TE1/TE2, 4.76/ 7.22 ms) to assist the correction for distortion due to susceptibil-ity-induced inhomogeneity. This acquisition protocol was se-lected to enable the study of tumor infiltration along white matter tracts by using tractography-based analysis techniques. FDOPA preparation took place in a radiochemistry laboratory by using a previously reported synthesis.18PET imaging was performed by using a Gemini GXL scanner (Philips, Best, the Netherlands). An FDOPA activity of 151 MBq on average was administered intra-venously (range, 138 –164 MBq). A low-dose transmission CT scan was performed followed by a 75-minute list mode acquisi-tion. The images were reconstructed by using ordered subset ex-pectation maximization,19with corrections for attenuation and scatter.20The final volume had a matrix size of 128⫻128, con-sisting of 90 planes of 2⫻2⫻2 mm3voxels.
Diffusion Processing
FDOPA PET Processing and ADC Image Fusion
The FDOPA images were rigidly registered to the CE MR imaging by using a block matching approach with 6df.26Normalization of the FDOPA scans was then performed by using the standardized uptake value ratio method, whereby each voxel was divided by the mean uptake in the cerebellum, a region that shows only nonspe-cific tracer uptake.4The cerebellum was manually defined on the FDOPA maps. To register the FDOPA and ADC maps, we rigidly alignedb⫽0 images acquired as part of the High Angular Reso-lution Diffusion Imaging sequence to the coregistered CE MR imaging, by using the FSL Linear Image Registration Tool and 6
df, using mutual information.
Generation of Minimum ADC and Maximum FDOPA SUVR Regions
There is no widely accepted method to delineate tumor margins on the basis of FDOPA threshold levels, though the use of the percentage of maximum SUVR based on the tumor background ratio has been suggested.27Techniques based on the use of a single global threshold are not suitable for FDOPA images due to possi-ble uptake within noncancerous tissue (striatum) close to the tu-mor and inhomogeneous tracer uptake within the whole tutu-mor volume. In this study, an experienced nuclear medicine physician (P.T.) manually defined the tumor boundary by using the fused CE MR imaging and FDOPA maps. Regions of interest on the ADC maps, outside of the FDOPA-defined tumor volume, were manually placed to identify ADC measures in normal tissue. This placement was performed, when possible, on several serial axial sections containing no FDOPA uptake (ie, infiltrating tumor). Reference to coregistered CE MR imaging and T2-weighted scans was also considered to avoid including tissue exhibiting signifi-cant compression effects due to excessive tumor growth. The mean (SD) volume of normal tissue was 172⫾54 mL. Regions of minimum ADC within the FDOPA-defined tumor volume were generated by applying a threshold of 450⫻10⫺6mm2/s (ie, 3 SDs lower than the mean ADC values derived for normal parenchymal tissue). Regions of maximum FDOPA uptake within the tumor volume were defined by voxels with the 20% highest SUVR.17
Mean FDOPA SUVR indices were generated for the tumoral gions exhibiting minimum ADC. Mean ADC values within re-gions corresponding to maximum FDOPA SUVR were also calculated.
To evaluate the voxelwise anatomic relationship between these regions, binary threshold maps defining minimum ADC and maximum FDOPA SUVR regions were multiplied to generate an overlap map. The volume of this overlapping region was ex-pressed as a percentage of the minimum ADC and maximum FDOPA tumor volumes. Significant differences between mean ADC and FDOPA indices were determined by using a Mann-WhitneyUtest (Statistical Package for the Social Sciences soft-ware, Version 19; SPSS, Chicago, Illinois).
RESULTS
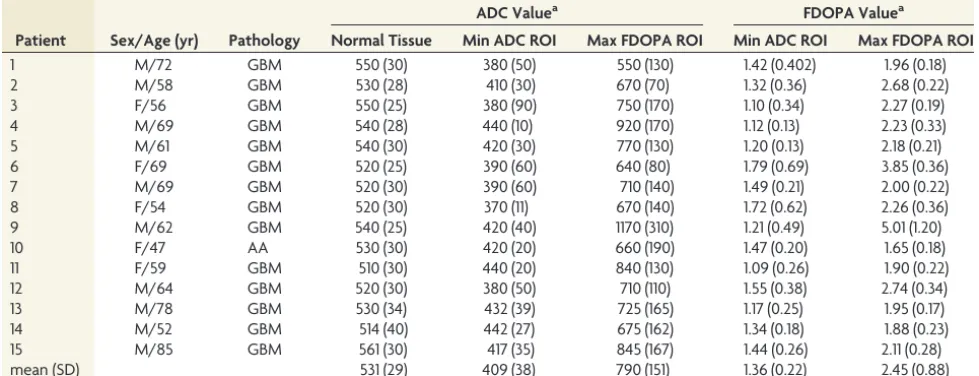
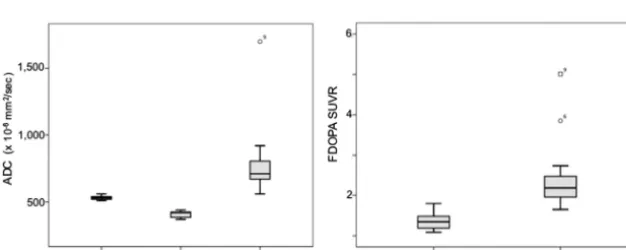
[image:3.594.53.543.57.245.2]Patient demographics and minimum ADC and maximum FDOPA values are shown in Table 1. Maximum FDOPA SUVR and minimum ADC-defined tumor volumes along with the per-centage of region overlap are shown in Table 2. Box-and-whisker plots highlighting the differences in ADC and FDOPA SUVR measures for these regions are given in Fig 1. There was a consid-erable range in minimum ADC volume across the patient cohort (range, 0.3–29 mL). The maximum FDOPA SUVR tumor vol-umes were significantly larger than the corresponding minimum ADC defined volumes (P⫽.0009). With regard to diffusivity measures, the ADC values for the maximum FDOPA SUVR-de-fined tumor volumes (790⫾151⫻10⫺6mm2/s) were signifi-cantly higher compared with the minimum ADC defined volumes (409⫾38⫻10⫺6mm2/s;P⫽.0007). In addition, the ADC values for the maximum FDOPA SUVR tumor volumes were signifi-cantly higher compared with those measured in normal tissue (531⫾29⫻10⫺6mm2/s;P⫽.0009). FDOPA uptake within the maximum FDOPA SUVR-defined tumor volume (2.45⫾0.88) was significantly higher than that found within the minimum ADC-defined tumor volume (1.36⫾0.22,P⫽.0012). Most im-portant, with regard to overlap between these 2 regions, most patients presented with no or only modest overlap. As highlighted Table 1: Patient demographics, minimum ADC, and maximum FDOPA measures
Patient Sex/Age (yr) Pathology
ADC Valuea FDOPA Valuea
Normal Tissue Min ADC ROI Max FDOPA ROI Min ADC ROI Max FDOPA ROI
1 M/72 GBM 550 (30) 380 (50) 550 (130) 1.42 (0.402) 1.96 (0.18)
2 M/58 GBM 530 (28) 410 (30) 670 (70) 1.32 (0.36) 2.68 (0.22)
3 F/56 GBM 550 (25) 380 (90) 750 (170) 1.10 (0.34) 2.27 (0.19)
4 M/69 GBM 540 (28) 440 (10) 920 (170) 1.12 (0.13) 2.23 (0.33)
5 M/61 GBM 540 (30) 420 (30) 770 (130) 1.20 (0.13) 2.18 (0.21)
6 F/69 GBM 520 (25) 390 (60) 640 (80) 1.79 (0.69) 3.85 (0.36)
7 M/69 GBM 520 (30) 390 (60) 710 (140) 1.49 (0.21) 2.00 (0.22)
8 F/54 GBM 520 (30) 370 (11) 670 (140) 1.72 (0.62) 2.26 (0.36)
9 M/62 GBM 540 (25) 420 (40) 1170 (310) 1.21 (0.49) 5.01 (1.20)
10 F/47 AA 530 (30) 420 (20) 660 (190) 1.47 (0.20) 1.65 (0.18)
11 F/59 GBM 510 (30) 440 (20) 840 (130) 1.09 (0.26) 1.90 (0.22)
12 M/64 GBM 520 (30) 380 (50) 710 (110) 1.55 (0.38) 2.74 (0.34)
13 M/78 GBM 530 (34) 432 (39) 725 (165) 1.17 (0.25) 1.95 (0.17)
14 M/52 GBM 514 (40) 442 (27) 675 (162) 1.34 (0.18) 1.88 (0.23)
15 M/85 GBM 561 (30) 417 (35) 845 (167) 1.44 (0.26) 2.11 (0.28)
mean (SD) 531 (29) 409 (38) 790 (151) 1.36 (0.22) 2.45 (0.88)
Note:—Min indicates minimum; Max, maximum; AA, anaplastic astrocytoma. a⫻
10⫺6 mm2
in Table 2, the extent of minimum ADC volume with maximum FDOPA SUVR was, at most, 28%, based on the volume of the smallest region, namely the minimum ADC volume. Representa-tive CE MR imaging, ADC, and FDOPA PET maps for patients with large minimum ADC volumes are given in Fig 2.
DISCUSSION
The major finding from this study was the limited anatomic over-lap between tumor regions of minimum ADC and areas exhibit-ing maximum FDOPA SUVR. This result provides evidence that enhanced tumor cellularity may not be the key factor contributing to the restriction of water diffusion in GBM. Such a finding has significant clinical impact because measures of minimum ADC or differences between minimum and maximum ADC have been reported as potential markers of tumor grade,8,9,12 albeit with conflicting views in the literature.10,11,28In addition, although many glioblastomas present with diverse heterogeneous patterns of diffusivity, most do not exhibit large regions of restricted dif-fusion.28In our preliminary study, 13 patients (approximately 86%) had minimum ADC regions of⬍5 mL in volume. However, we used a stringent ADC threshold level (450⫻10⫺6mm/s2), and selection of a higher ADC value would increase the minimum
ADC volume. Because the aim of this study was to investigate the anatomic relationship between areas of minimum ADC (ie, pro-posed regions of high tumor cellularity) with areas of high FDOPA uptake, reducing this threshold would impact the inter-pretation of the findings because larger minimum ADC volumes would most likely contain tissue with varying degrees of tumor infiltration. We selected this threshold level because it falls 3 SDs below the mean ADC derived from normal tissue (531⫾29⫻ 10⫺6mm/s2) and provides a robust strategy for delineating min-imum ADC volumes.
The rationale behind the use of ADC indices is based on the premise that increased tumor cellularity leads to an increase in volume of the intracellular space, which results in restricted water diffusion within the reduced extracellular compartment.7This concept is supported by the finding that some highly cellular tu-mors such as lymphomas also exhibit restricted diffusion.29 How-ever, a study investigating the relationship between minimum ADC and Ki-67 measures, a histologically-based tumor prolifer-ation index, reported no significant correlprolifer-ation in patients with GBM.12
Most interesting, a recent study focusing on investigating the relationship between ADC and dynamic contrast-enhanced MR imaging measures of the volume of the extravascular extracellular space per unit volume (ve) in patients with newly diagnosed glio-mas reported that no correlation was found between ADC and ve.30This study provides additional evidence that tumor regions with reduced diffusion do not necessarily correlate with tissue possessing a reduced extracellular compartment, and it highlights the belief that further work is required to establish the link be-tween minimum ADC and tumor cellularity in newly diagnosed GBM. Despite the lack of imaging and histologic support for the this concept, a number of studies have shown a significant corre-lation between minimum ADC and reduced patient survival.9,13 Understanding ADC measures in primary brain tumors pres-ents a significant challenge because high-grade gliomas contain a continuum of evolving histologic features (WHO classification grades II-IV), with the degree of water diffusivity related to a number of factors such as cellularity, edema, and degenerative changes associated with hemorrhage and cystic or mucinous de-generation along with compression effects within peritumoral tis-sue. Serial preoperative studies in patients31and animal models32 have shown that diffusivity measures are continually evolving,
[image:4.594.53.285.55.232.2]FIG 1. Box-and-whisker plots outlining the distribution (mean and SD) of ADC and FDOPA SUVR measures within the minimum ADC and maximum FDOPA SUVR– defined tumor regions.
Table 2: Tumor volumetric measures
Patient
Max FDOPA Volume (mL)
Min ADC Volume (mL)
Overlap (%)a
Overlap (%)b
1 29.9 29.0 19.3 19.9
2 38.3 0.4 0.2 19.2
3 15.7 4.8 0.2 0.7
4 19.9 0.3 0 0
5 3.1 1.6 0 0
6 18.9 4.6 1.0 4.1
7 12.9 0.4 0.2 6.5
8 33.9 0.9 0.3 11.3
9 21.6 2.3 3.0 28.2
10 60.1 15.0 6.8 27.3
11 44.5 0.5 0 0
12 14.1 2.9 0.52 2.5
13 15.8 3.7 0.42 1.8
14 20.0 0.4 0.2 9.3
15 59.7 1.9 0.4 13.4
Note:—Min indicates minimum; Max, maximum. a
Overlap (ie, minimum ADC volume overlap with maximum FDOPA SUVR) expressed as a percentage of maximum FDOPA SUVR volume.
b
[image:4.594.136.449.580.705.2]with ADC changing from low to elevated levels with progression of pathology.
To address this problem, Holodny et al13investigated the cor-relation between minimum ADC and FDG uptake in a range of glial tumors and found greater overlap between ADC and FDG compared with gadolinium enhancement on MR imaging. This finding is not surprising because contrast enhancement only de-lineates blood-brain barrier dysfunction, not tumor infiltration or proliferation. Possible explanations for the correlations found between enhanced FDG metabolism and ADC in some patients were associated with increased cellularity or, potentially, the pres-ence of ischemic tumoral regions. It is known that increased FDG uptake can also reflect increased glycolysis due to focal ischemia.33 However, significance levels of the correlations were not reported, so it is difficult to judge the robustness of this correlation across the entire patient population in this study.
We found that regions identified with minimum ADC have significantly reduced FDOPA uptake compared with the maxi-mum FDOPA SUVR volume (P⫽.0012), with little or only very
modest overlap even when presented as a fraction of the smallest volume, namely the minimum ADC region. The reduced FDOPA SUVR uptake within regions of minimum ADC (1.36⫾0.22) compared with regions exhibiting maximum FDOPA SUVR up-take (2.45⫾0.88) may also be explained by the presence of isch-emia. At this stage, we do not fully understand all the factors regulating FDOPA uptake within all pathologic tumor regions; however, for the purpose of this study, FDOPA uptake has been shown to significantly correlate with proliferation in newly diag-nosed gliomas.17As previously outlined, most high-grade gliomas present with elevated ADC within the tumor volume.28This ob-servation was consistent in our study. For instance Kang et al8 reported a mean ADC of 829⫾176⫻10⫺6mm2/s within the tumor volume in newly diagnosed gliomas by using the same b-value used in our study. The ADC of normal tissue in our study was 530⫾29⫻10⫺6mm2/s. In this case, the increase in ADC is believed to be associated with edema, early stages of necrosis, liquefaction, and inflammatory processes as a direct result of tu-mor infiltration.28Our finding of elevated FDOPA uptake within these regions (ie, a marker of the presence of metabolically active tumor cells) suggests that such regions could be targets for thera-peutic interventions. Clearly, further studies are required to vali-date such observations.
Another possible explanation for the lack of overlap between regions of minimum ADC and maximum FDOPA SUVR is tissue compression. In an elegant serial study, Lope-Piedrafita et al32 reported the consistent finding of reduced ADC within the tissue immediately surrounding the growing tumor in an animal glioma model. In this study, histologic analysis indicated that within this region, tissue comprised geometrically asymmetric cells with lon-ger dimensions parallel to the surface of the tumor and the shorter axis normal to the border. It was proposed that the rapid growth in this tumor model exerts pressure on surrounding tissue in a direction normal to the surface of the tumor. This pressure changes the average shape of cells in the immediate vicinity of the tumor from spheric to oblate spheroidal. This compression effect decreased with distance away from the major foci of tumor growth. Such histologic findings would induce a restriction in diffusivity because the compressed cells would effectively have increased cellularity with more membranes per unit volume. Such a concept, if applied in clinical populations, would also help ex-plain the relationship between reduced ADC and poor patient survival, because rapidly expanding (higher grade) tumors are, in many cases, less responsive to treatment. Our finding of mini-mum overlap between regions of minimini-mum ADC and maximini-mum FDOPA SUVR also supports this mechanism.
Clearly further studies are required to elucidate the pathologic correlates of reduced ADC in GBM. Our findings infer that re-gions of minimum ADC may primarily be associated with tumor ischemia and/or tissue-compression effects. Where overlap does occur in some patients, minimum ADC most likely infers in-creased tumor cellularity. Further studies using specific ischemia tracers such as18F-fluoromisonidazole would help differentiate the effects of ischemia and tissue compression. A measure of tu-mor perfusion would also help to establish pathologic correlates of minimum ADC. Restricted diffusion has been reported in many studies after successful therapy and is believed to reflect FIG 2. Representative FDOPA–MR imaging fused images for patients
[image:5.594.53.285.45.420.2]early efficacious treatment.34-36However, in the post-therapy sce-nario, it is important to note that different pathologic events, induced by the beneficial effects of a chemotherapeutic agent or radiation therapy, will drive cellular mechanisms, resulting in re-duced ADC measures. In this study, we focused on investigating restricted diffusion before treatment.
There are a number of limitations with this study: the small number of patients and the lack of histologic data biopsied from regions with minimum ADC. However, acquiring image-guided biopsies before tumor resection is logistically difficult and not normally performed in patients with newly diagnosed high-grade gliomas. For this reason, we have used a PET-based metabolic marker of tumor proliferation. Clearly, additional PET scans us-ing ischemia-specific tracers are also required to fully elucidate the pathologic correlates of restricted diffusivity in GBM. In this study, we used high b-values and a high angular resolution diffu-sion imaging acquisition protocol to derive ADC measures. This imaging protocol was used to investigate tumor infiltration along white matter pathways by using tractography. Similar to previous reports, our ADC measures were decreased compared with ADC measures derived by using conventional b-values of 1000 s/mm2 with the diffusion signal dominated by the slow diffusion compo-nent.37Use of this diffusion parameter would have little impact on our results because a recent study has shown the added value of using b-value diffusion imaging for differentiating high-from low-grade gliomas.8Most important, within our diffusion image-processing pipeline, we attempted to reduce artifacts in-duced by physiologic noise and head motion.
CONCLUSIONS
We have shown minimal anatomic correlation between regions exhibiting minimum ADC (a putative marker of tumor cellular-ity) and maximum FDOPA SUVR uptake (a marker of tumor proliferation). This mismatch supports the concept that restricted diffusion within tumoral regions maybe associated with tissue compression effects and/or possibly the presence of ischemia. Where overlap occurs, enhanced tumor cellularity is most likely to be the major contributing factor. The findings from this study have significant impact on the clinical use of minimum ADC alone as a marker of tumor grade. Combining a metabolic PET proliferation marker with minimum ADC measure may provide a more robust method for guiding tumor biopsies preoperatively.
Disclosures: Stephen Rose—RELATED:Grant: National Health and Medical Research Council,*Comments: I am the principal investigator of a grant that was awarded by the NHMRC to develop novel MRI-PET fusion technology for neuro-oncology ap-plications,UNRELATED:Grants/Grants Pending: National Health and Medical Re-search Council.* Michael Fay—UNRELATED:Other: Abbott Pharmaceuticals Brain Metastases Trial development meeting (London, 2011), transportation to meeting and accommodation only. Paul Thomas—RELATED:Grant: National Health and Medical Research Council,*Comments: The Australian public health research funding body provided the grant for this research. The funding received by our institution was to cover the cost of the imaging performed for this study.Patents: Patent Office,*
Comments: Consideration is being given for an application to patent a method of analyzing PET and MR imaging data for serial comparison. This work was undertaken as part of this research project but is completely unrelated to the work presented in this article. Pierrick Bourgeat—RELATED:Grant: Queensland Government Smart-State Grant,*Comments: grant to develop a new method to help treatment of brain tumors,UNRELATED:Employment:Commonwealth Scientific and Industrial Re-search Organization (CSIRO). Nicholas Dowson—RELATED:Grant: Queensland Smart-State Grant (QSS),* National Health and Medical Research Council,* Com-ments: QSS expired 1 year ago. Olivier Salvado—RELATED:Grant: QSS,* National
Health and Medical Research Council,*Comments: QSS expired 1 year ago, UNRE-LATED:Other: GE Healthcare,*Comments: involved in a contract with GE Health-care unrelated to this work. Yaniv Gal—RELATED:Grant: National Health and Med-ical Research Council (Australia),Comments: The NHMRC grant money is paying my salary. Stuart Crozier—RELATED: Grant: National Health and Medical Research Council federal project grant,*Comments: Standard National Institutes of Health– equivalent grant,UNRELATED:Grants/Grants Pending: National Health and Medical Research Council grant.* *Money paid to the institution.
REFERENCES
1. DeAngelis LM.Brain tumors.N Engl J Med2001;344:114 –23 2. Johnson PC, Hunt SJ, Drayer BP.Human cerebral gliomas:
correla-tion of postmortem MR imaging and neuropathologic findings. Ra-diology1989;170:211–17
3. Jacobs AH, Thomas A, Kracht LW, et al.18F-fluorothymidine and 11C-methymethionine as markers of increased transport and
pro-liferation in brain tumors.J Nucl Med2005;46:1948 –58
4. Chen W, Silverman DH, Delaloye S, et al.18F-FDOPA PET imaging
of brain tumors: comparison study with18F-FDG PET and
evalua-tion of diagnostic accuracy.J Nucl Med2006;47:904 –11
5. Ledezma CJ, Chen W, Sai V, et al.18F-FDOPA PET/MRI fusion in
patients with primary/recurrent gliomas: initial experience.Eur J Radiol2009;71:242– 48
6. Kim S, Chung JK, Im SH, et al.11C-methionine PET as a prognostic marker in patients with glioma: comparison with 18F-FDG PET.
Eur J Nucl Med Mol Imaging2005;32:52–59
7. Cha S.Update on brain tumor imaging: from anatomy to physiol-ogy.AJNR Am J Neuroradiol2006;27:475– 87
8. Kang Y, Choi SH, Kim YJ, et al.Gliomas: histogram analysis of ap-parent diffusion coefficient maps with standard- or high-b-value diffusion-weighted MR imaging: correlation with tumor grade. Ra-diology2011;261:882–90
9. Murakami R, Hiarir T, Sugahara T, et al.Grading astrocytic tumors by using apparent diffusion coefficient parameters: superiority of a one- versus two-parameter pilot method. Radiology
2009;251:838 – 45
10. Zonari P, Baraldi P, Crisi G, et al.Multimodal MRI in the character-ization of glial neoplasms: the combined role of single-voxel MR spectroscopy, diffusion imaging and echo-planer perfusion imag-ing.Neuroradiology2007;49:795– 803
11. Catalaa I, Henry R, Dillion WP, et al.Perfusion, diffusion and spec-troscopy values in newly diagnosed cerebral gliomas.NMR Biomed
2006;19:463–75
12. Higano S, Yun X, Kumabe T, et al.Malignant astrocytic tumors: clinical importance of apparent diffusion coefficient in prediction of grade and prognosis.Radiology2006;241:839 – 46
13. Holodny AI, Makeyev S, Beattie BJ, et al.Apparent diffusion coeffi-cient of glial neoplasms: correlation with fluorodeoxyglucose-posi-tion-emission tomography and gadolinium-enhanced MR imag-ing.AJNR Am J Neuroradiol2010;31:1042– 48
14. Ricci PE, Karis JP, Heiserman JE, et al.Differentiating recurrent tumor from radiation necrosis: time for re-evaluation of position emission tomography.AJNR Am J Neuroradiol1998;19:407–13 15. Becherer A, Karanikas G, Szabo M, et al.Brain tumor imaging with
PET: a comparison between [18F]fluorodopa and [11C]methio-nine.Eur J Nucl Med Mol Imaging2003;30:1561– 67
16. Schiepers C, Chen W, Cloughesy T, et al.18F-FDOPA kinetics in brain tumors.J Nucl Med2007;48:1651– 61
17. Fueger BJ, Czernin J, Cloughesy T, et al.Correlation of 6 –18F-fluoro-L-dopa PET with proliferation and tumor grade on newly diagnosed and recurrent gliomas.J Nucl Med2010;51:1532–38 18. Namavari M, Bishop A, Satyamurthy N, et al.Regioselective
radio-fluorodestannylation with [18F]F2 and [18F]Ch3COOF: a high yield synthesis of 6-[18F]fluoro-L-dopa.Int J Rad Appl Instrum A
1992;43:989 –96
19. Nuyts J, Michel C, Dupont P.Maximum-likelihood expectation-maximization reconstruction of sinograms with arbitrary noise distribution using NEC-transformations.IEEE Trans Med Imaging
20. Kinahan PE, Townsend DW, Beyer T, et al.Attenuation correction for a combined 3D PET/CT scanner.Med Phys1998;25:2046 –53 21. Rose SE, Pannek K, Bell C, et al.Direct evidence of intra- and
inter-hemispheric corticomotor network degeneration in amyotrophic lateral sclerosis: an automated MRI structural connectivity study.
Neuroimage2012;59:2661– 69
22. Bai Y, Alexander DC.Model-based registration to correct for mo-tion between acquisimo-tions in diffusion MR imaging.In:IEEE Inter-national Symposium on Biomedical Imaging: From Nano to Macro,
London, UK. 2008;1– 4:947–50
23. Rohde GK, Barnett AS, Basser PJ, et al.Comprehensive approach for correction of motion and distortion in diffusion-weighted MRI.
Magn Reson Med2004;51:103–14
24. Morris D, Nossin-Manor R, Taylor MJ, et al.Preterm neonatal dif-fusion processing using detection and replacement of outliers prior to resampling.Magn Reson Med2011;66:92–101
25. Tournier JD, Calamante F, Connelly A.Robust determination of the fiber orientation distribution in diffusion MRI: non-negativity constrained super-resolved spherical deconvolution.Neuroimage
2007;35:1459 –72
26. Ourselin S, Roche A, Subsol G, et al.Reconstructing a 3D structure from serial histological sections. Image and Vision Computing
2001;19:25–31
27. Vees H, Senthamizhchelvan S, Miralbell R, et al.Assessment of vari-ous strategies for 18F-FET PET-guided delineation of target vol-umes in high-grade glioma patients.Eur J Nucl Med Mol Imaging
2009;36:182–93
28. Hakyemez B, Erdogan C, Yildirim N, et al.Glioblastoma multiforme with atypical diffusion-weighted MR findings. Br J Radiol
2005;78:989 –92
29. Stadnik TW, Chaskis C, Mihotte A, et al.Diffusion-weighted MR imaging of intracerebral masses: comparison with conventional
MR imaging and histological findings. AJNR Am J Neuroradiol
2001;22:969 –76
30. Mills SJ, Soh C, Rose CJ, et al.Candidate biomarkers of extravascu-lar extracelluextravascu-lar space: q direct comparison of apparent diffusion coefficient and dynamic contrast-enhanced MRI imaging— de-rived measurement of the volume of the extravascular extracellular space in glioblastoma multiforme. AJNR Am J Neuroradiol
2010;31:549 –53
31. Baehring JM, Bi WL, Bannykh S, et al.Diffusion MRI in the early diagnosis of malignant glioma.J Neurooncol2007;82:221–25 32. Lope-Piedrafita S, Garcia-Martin ML, Galons JP, et al.Longitudinal
diffusion tensor imaging in a rat brain glioma model.NMR Biomed
2008;21:799 – 808
33. Rajendran JG, Mankoff DA, O’Sullivan F, et al.Hypoxia and glucose metabolism in malignant tumors: evaluation by [18F]fluoromi-sonidazole and [18F]fluorodeoxyglucose positron emission to-mography imaging.Clin Cancer Res2004;10:2245–52
34. Gupta A, Young RJ, Karimi S, et al.Isolated diffusion restriction preceded the development of enhancing tumor in a subset of pa-tients with glioblastoma.AJNR Am J Neuroradiol2011;32:1301– 06 35. Ellingson BM, Cloughesy TF, Lai A, et al.Graded functional
diffu-sion map-defined characteristics of apparent diffudiffu-sion coefficients predict overall survival in recurrent glioblastoma treated with bev-acizumab.Neuro Oncol2011;13:1151– 61