ANALYSIS OF WATER QUALITY AND FLOW DATA FOR
THE ADDINGTON CATCHMENT (2015-2016)
Research Report 2017-03
Civil & Natural Resources Engineering
March 2017
ENGINEERING
Aisling O’ Sullivan
Thomas A. Cochrane
Analysis of Water Quality and Flow Data for the
Addington Catchment (2015-2016)
Aisling O’ Sullivan
Thomas A. Cochrane
Department of Civil and Natural Resources Engineering Hydrological and Ecological Engineering Group
Report prepared for Environment Canterbury Reviewed by Michele Stevenson
2
ABSTRACT
Addington Brook is a stormwater-influenced Christchurch waterway. Substantial instream surface water quality monitoring has shown elevated solids, metal and nutrient concentrations along the brook, which is thought to
be a major contributor of these pollutants to the Avon River/Ōtākaro system and downstream estuary.
3
Table of Contents
Abstract………..2
1. Introduction ... 4
2. Materials and Methods ... 4
3. Results and Discussion ... 6
3.1. Rainfall and water flow ... 6
3.2. Longitudinal analysis of pollutant concentrations compared to the relevant guidelines and previous sampling data. ... 13
3.2.1. Total suspended solids (TSS) ... 13
3.2.2. Dissolved Metals - Zinc (Zn), Copper (Cu) and lead (Pb) ... 16
3.2.3. Nutrients ... 19
3.3. Pollutant retention by the Matipo Ponds System ... 23
3.3.1. Nutrient (Phosphorus and Nitrogen species) and Solids ... 23
3.3.2. Dissolved metal (zinc, copper, lead) concentrations ... 27
3.4. Pollutant Loads – Downstream Riccarton Ave Sampling Location ... 32
3.5. Pollutant Loads – Modelled versus measured at Riccarton Ave ... 40
4. Summary ... 43
4.1. Key findings ... 43
4.2. Recommended further work ... 44
5. Acknowledgements ... 45
6. References ... 45
4
1. Introduction
Impermeable urban surfaces such as roads, carparks and roofs contribute pollutants via untreated stormwater runoff to urban waterways, causing a wide range of adverse effects on the aquatic ecosystem. Total suspended sediment (TSS), metals such as copper (Cu) and zinc (Zn), and nutrients, have been identified as the key pollutants of concern in urban waterways. Addington Brook is a stormwater-influenced stream that feeds into
the Avon River/Ōtākaro near the Christchurch Hospital. Substantial instream surface water quality monitoring
has shown elevated solids, metal and nutrient concentrations along the brook, which is thought to be a major
contributor of these pollutants to the Avon River/Ōtākaro system and downstream estuary. Detailed modelling
and investigation of the sources and character of solids and metals within this catchment has recently been reported (Charters, 2016) while comprehensive long-term surface water quality monitoring for many Christchurch waterways, including parts of the Addington Brook, are also reported in Margetts and Marshall (2015, 2016).
This study analysed wet weather water quality (and some flow data) of the Addington Brook at different sites along a ~3 km pathway to evaluate longitudinal spatial patterns within the catchment. The performance of the KiwiRail Stormwater Ponds within the catchment, to treat key pollutants, was also assessed and compared with performance data reported in 2009. Pollutant loads were assessed at one of the sites by comparing measured and modelled data. The Modelled Estimates of Discharges for Urban Stormwater Assessment (MEDUSA) contaminant load process model (Fraga et al., 2016) was employed for the modelling (Charters, 2016).
2. Materials and Methods
5
Addington catchment. The Riccarton Ave site is located furthermost downstream in Hagley Park, just before it
enters the Avon River/Ōtākaro. Between the Deans Ave and Riccarton Ave sites there are inputs from a number
of stormwater pipes draining commercial/residential land, as well as runoff from sports fields in Hagley Park.
Rainfall data were derived from records provided by the National Institute for Water and Atmospheric Research (NIWA), while water level was recorded by ECan for all sites along with flow at Riccarton Ave. Automatic samplers were employed by ECan for the sampling. Between 3 and 6 samples were taken for water quality analyses during each of the four events. The priority pollutants of focus to investigate were total suspended solids, dissolved metals and nutrient species. Comparison of pollutant concentrations between the overall inflow (Matipo US Pond) and outflow (Matipo DS Pond) was made based on samples taken approximately 5-9 minutes apart (e.g. Table A1, Appendix A). EOS Ecology (2011) suggested that hydraulic retention time in the first flush wetland basin was a matter of minutes and comparison of their pond treatment efficiencies were also based on approximately the same time intervals between inflow and outflow.
6
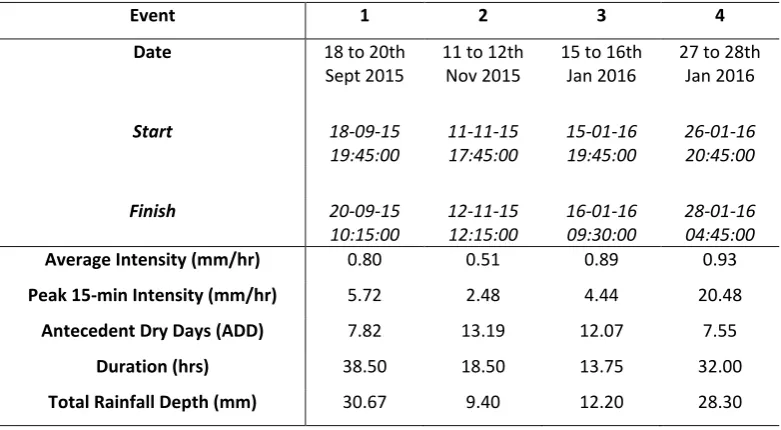
Table 1. Summary rainfall parameters for the monitored storm events. Where rainfall at the start of an event was <0.1 mm in a 5-min. interval, it was considered not an event.
3. Results and Discussion
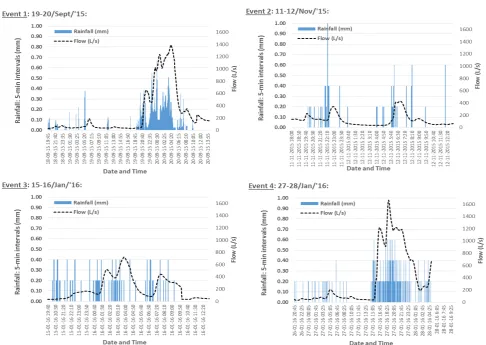
3.1. Rainfall and water flow
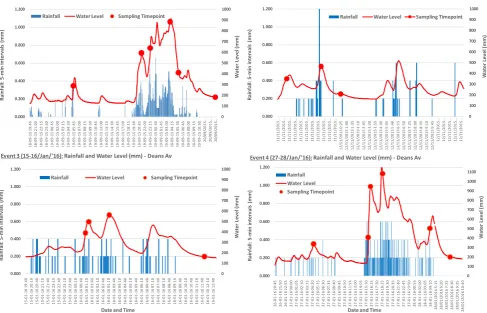
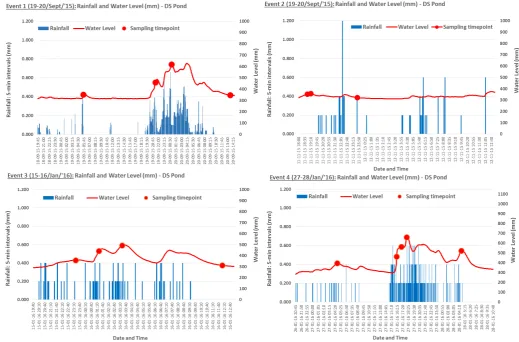
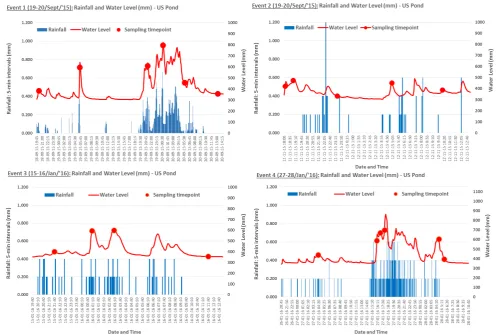
The relationships between rainfall depth (1st y-axis) and in-stream water level (2nd y-axis) for all sampling sites and events are summarized in Figures 2-5, which also show the water quality sampling times.
At the start of a rain event, concentrations of particulate (and hence total) pollutants are often the highest as they are washed off impervious surfaces. Water sampled later in an event is usually lower in pollutant concentrations since the majority of particulate concentrations have already been washed off. However, for some dissolved pollutants (e.g. metals), concentrations may remain somewhat elevated throughout a wet weather event, depending on their origin (e.g. roof materials, roads etc). Therefore, discrete water sampling throughout a rain event is important as it captures pollutant concentrations during the characteristic rising limb, peak and receding portions of the event. This is only practically possible with an automatic sampler, given the often unpredictable nature of rain and unsocial time at which it occurs. In almost every instance, surface water was sampled throughout the rain event at all characteristic time points (with the exception of event 1 at Riccarton Ave where the peak of the event was not captured), providing important information about the range of concentrations measured throughout each event at each location (Figures 2-5).
Event 1 2 3 4
Date 18 to 20th
Sept 2015 11 to 12th Nov 2015 15 to 16th Jan 2016 27 to 28th Jan 2016
Start 18-09-15
19:45:00 11-11-15 17:45:00 15-01-16 19:45:00 26-01-16 20:45:00
Finish 20-09-15
10:15:00 12-11-15 12:15:00 16-01-16 09:30:00 28-01-16 04:45:00
Average Intensity (mm/hr) 0.80 0.51 0.89 0.93
Peak 15-min Intensity (mm/hr) 5.72 2.48 4.44 20.48
Antecedent Dry Days (ADD) 7.82 13.19 12.07 7.55
Duration (hrs) 38.50 18.50 13.75 32.00
8
Figure 3. Relationship between rainfall depth and in-stream water level for all events atthe Deans Ave site showing sampling times.
0 100 200 300 400 500 600 700 800 900 1000 0.000 0.200 0.400 0.600 0.800 1.000 1.200 18 -0 9-15 1 9: 45 18 -0 9-15 2 1: 00 18 -0 9-15 2 2: 15 18 -0 9-15 2 3: 30 19 -0 9-15 0 0: 45 19 -0 9-15 0 2: 00 19 -0 9-15 0 3: 15 19 -0 9-15 0 4: 30 19 -0 9-15 0 5: 45 19 -0 9-15 0 7: 00 19 -0 9-15 0 8: 15 19 -0 9-15 0 9: 30 19 -0 9-15 1 0: 45 19 -0 9-15 1 2: 00 19 -0 9-15 1 3: 15 19 -0 9-15 1 4: 30 19 -0 9-15 1 5: 45 19 -0 9-15 1 7: 00 19 -0 9-15 1 8: 15 19 -0 9-15 1 9: 30 19 -0 9-15 2 0: 45 19 -0 9-15 2 2: 00 19 -0 9-15 2 3: 15 20 -0 9-15 0 0: 30 20 -0 9-15 0 1: 45 20 -0 9-15 0 3: 00 20 -0 9-15 0 4: 15 20 -0 9-15 0 5: 30 20 -0 9-15 0 6: 45 20 -0 9-15 0 8: 00 20 -0 9-15 0 9: 15 20 -0 9-15 1 0: 30 20 /0 9/ 20 15 … 20 /0 9/ 20 15 … 20 /0 9/ 20 15 … W at er L ev el (m m ) Ra in fa ll: 5 -m in in te rv al s (m m )
Date and Time
Event 1 (19-20/Sept/'15): Rainfall and Water Level (mm) - Deans Av
Rainfall Water Level Sampling Timepoint
0 100 200 300 400 500 600 700 800 900 1000 0.000 0.200 0.400 0.600 0.800 1.000 1.200 15 -0 1-16 1 9: 40 15 -0 1-16 2 0: 10 15 -0 1-16 2 0: 40 15 -0 1-16 2 1: 10 15 -0 1-16 2 1: 40 15 -0 1-16 2 2: 10 15 -0 1-16 2 2: 40 15 -0 1-16 2 3: 10 15 -0 1-16 2 3: 40 16 -0 1-16 0 0: 10 16 -0 1-16 0 0: 40 16 -0 1-16 0 1: 10 16 -0 1-16 0 1: 40 16 -0 1-16 0 2: 10 16 -0 1-16 0 2: 40 16 -0 1-16 0 3: 10 16 -0 1-16 0 3: 40 16 -0 1-16 0 4: 10 16 -0 1-16 0 4: 40 16 -0 1-16 0 5: 10 16 -0 1-16 0 5: 40 16 -0 1-16 0 6: 10 16 -0 1-16 0 6: 40 16 -0 1-16 0 7: 10 16 -0 1-16 0 7: 40 16 -0 1-16 0 8: 10 16 -0 1-16 0 8: 40 16 -0 1-16 0 9: 10 16 -0 1-16 0 9: 40 16 -0 1-16 1 0: 10 16 -0 1-16 1 0: 40 16 -0 1-16 1 1: 10 16 -0 1-16 1 1: 40 16 -0 1-16 1 2: 10 16 -0 1-16 1 2: 40 W at er L ev el (m m ) Ra in fa ll: 5 -m in in te rv al s (m m )
Date and Time
Event 3 (15-16/Jan/'16): Rainfall and Water Level (mm) - Deans Av
Rainfall Water Level Sampling Timepoint
0 100 200 300 400 500 600 700 800 900 1000 1100 0.000 0.200 0.400 0.600 0.800 1.000 1.200 26 -0 1-16 2 0: 45 26 -0 1-16 2 1: 50 26 -0 1-16 2 2: 55 27 -0 1-16 0 0: 00 27 -0 1-16 0 1: 05 27 -0 1-16 0 2: 10 27 -0 1-16 0 3: 15 27 -0 1-16 0 4: 20 27 -0 1-16 0 5: 25 27 -0 1-16 0 6: 30 27 -0 1-16 0 7: 35 27 -0 1-16 0 8: 40 27 -0 1-16 0 9: 45 27 -0 1-16 1 0: 50 27 -0 1-16 1 1: 55 27 -0 1-16 1 3: 00 27 -0 1-16 1 4: 05 27 -0 1-16 1 5: 10 27 -0 1-16 1 6: 15 27 -0 1-16 1 7: 20 27 -0 1-16 1 8: 25 27 -0 1-16 1 9: 30 27 -0 1-16 2 0: 35 27 -0 1-16 2 1: 40 27 -0 1-16 2 2: 45 27 -0 1-16 2 3: 50 28 -0 1-16 0 0: 55 28 -0 1-16 0 2: 00 28 -0 1-16 0 3: 05 28 -0 1-16 0 4: 10 28 /0 1/ 20 16 5 :1 5 28 /0 1/ 20 16 6 :2 0 28 /0 1/ 20 16 7 :2 5 28 /0 1/ 20 16 8 :3 0 28 /0 1/ 20 16 9 :3 5 28 /0 1/ 20 16 1 0: 40 W at er L ev el (m m ) Ra in fa ll: 5 -m in in te rv al s (m m )
Date and Time
Event 4 (27-28/Jan/'16): Rainfall and Water Level (mm) - Deans Av
Rainfall Water Level Sampling Timepoint 0 100 200 300 400 500 600 700 800 900 1000 0.000 0.200 0.400 0.600 0.800 1.000 1.200 11 /1 1/ 20 15 … 11 /1 1/ 20 15 … 11 /1 1/ 20 15 … 11 /1 1/ 20 15 … 11 /1 1/ 20 15 … 11 /1 1/ 20 15 … 11 /1 1/ 20 15 … 11 /1 1/ 20 15 … 11 /1 1/ 20 15 … 11 /1 1/ 20 15 … 11 /1 1/ 20 15 … 12 /1 1/ 20 15 0 :2 5 12 /1 1/ 20 15 1 :0 0 12 /1 1/ 20 15 1 :3 5 12 /1 1/ 20 15 2 :1 0 12 /1 1/ 20 15 2 :4 5 12 /1 1/ 20 15 3 :2 0 12 /1 1/ 20 15 3 :5 5 12 /1 1/ 20 15 4 :3 0 12 /1 1/ 20 15 5 :0 5 12 /1 1/ 20 15 5 :4 0 12 /1 1/ 20 15 6 :1 5 12 /1 1/ 20 15 6 :5 0 12 /1 1/ 20 15 7 :2 5 12 /1 1/ 20 15 8 :0 0 12 /1 1/ 20 15 8 :3 5 12 /1 1/ 20 15 9 :1 0 12 /1 1/ 20 15 9 :4 5 12 /1 1/ 20 15 … 12 /1 1/ 20 15 … 12 /1 1/ 20 15 … 12 /1 1/ 20 15 … 12 /1 1/ 20 15 … W at er L ev el (m m ) Ra in fa ll: 5 -m in in te rv al s (m m )
Event 2 (19-20/Sept/'15): Rainfall and Water Level (mm) - Deans Av
9
10
Overall, all sites responded in similar magnitudes to rainfall with higher water levels measured shortly after rainfall was recorded at the NIWA site, a short distance away. This response is due to stormwater runoff from the catchment conveyed directly into Addington Brook. The water levels of the up-stream (i.e. inflow) and down-stream (i.e. outflow) Matipo pond sites are quite similar, with only a few cm difference between the locations that are probably attributed to local vegetation influences or result from additional flows measured down-stream of the inflow. However, the detention system is mitigating peak inflows to some extent, especially in smaller storm events (e.g. events 2 and 3), as evident by the steady outflow water levels in Figure 4. It would be interesting to consider a pollutant tracking exercise for the pond elements to ascertain their hydraulic retention time, as this time will likely influence the amount of dissolved pollutants (metals and nutrients) that can be removed from diffuse stormwater runoff.
13
3.2. Longitudinal analysis of pollutant concentrations compared to the relevant
guidelines and previous sampling data.
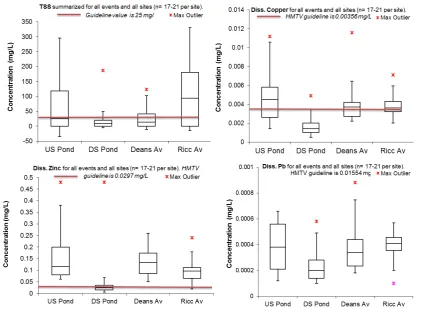
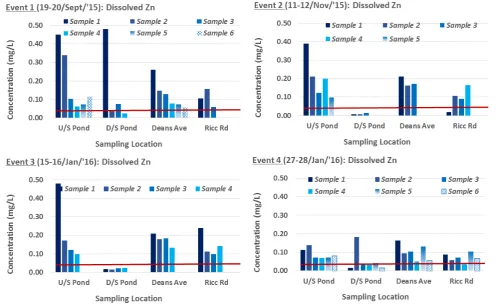
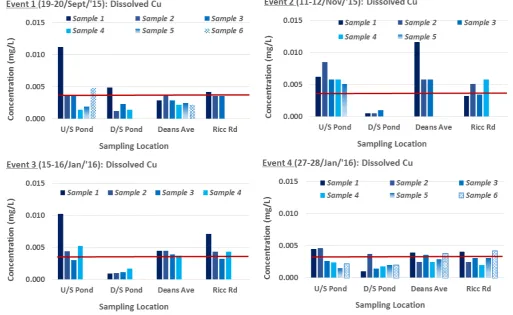
The water quality data for total suspended solids and the key dissolved metals for each site are summarized in Figure 7, while Figure 11 summarizes nutrients in the same way. Note that these median concentrations summarize all samples from all four wet weather events at each site to show longitudinal patterns within the catchment. Concentrations for the key pollutants of interest to ECan in this catchment (TSS, dissolved zinc and copper and ammonium) are then disaggregated and presented for each sampling time-point for each event per sampling site (Figures 8-10, 12) to highlight patterns within and between the wet weather events.
Christchurch City Council (CCC) have monitored instream water quality at the furthest downstream site (Riccarton Ave) sampled in this study (AVON09; Easting 2479427, Northing 5741438; near the brook’s confluence
with the Avon River/Ōtākaro) since 2008 on a monthly basis. Data from this monitoring programme are reported
annually as a requirement of the Council’s interim global stormwater consent (resource consent number CRC090292; Margetts and Marshall, 2016). CCC have also sampled during specific wet events in 2012 and 2014 as reported by Margetts (2013, 2014). These previous sampling data are used for comparison in the discussion below.
3.2.1. Total suspended solids (TSS)
14
15
measured in the 2015-2016 events (Figure 8). These trends in TSS concentrations between sampling sites are consistent across all four wet weather events but there are no clear patterns of concentrations to rainfall conditions since overall largest concentrations were seen in events 2 and 4, which are small and large events, respectively (Figure 8 and Table 1). Charters (2016) measured TSS concentrations between 200-450 mg/L in first-flush samples directly from impervious surfaces near this part of the catchment. Although samples did not represent in-stream mixed concentrations, they also highlight the large sediment load in stormwater runoff. There are significant stormwater pipes entering the brook near the netball courts of South Hagley Park and on the south side of Riccarton Ave, which convey substantial runoff during storm events, along with higher suspended solids loads. Therefore, it would be prudent to focus efforts on targeted sampling and pollutant mitigation at the main discharge points at this end of the brook to reduce the amount of solids entering the Avon
River/Ōtākaro. It would also be beneficial to understand the amount of particulate metals at these points to
enable co-treatment of TSS and particulate metals concurrently. It is possible that sediment may be entering the brook directly in the Hagley Park section where banks are steep and unstable in some reaches.
3.2.2. Dissolved Metals - Zinc (Zn), Copper (Cu) and lead (Pb)
elevated throughout the storm duration and do not clearly decline in the later samples (Figure 9). This may be explained by the fact that dissolved zinc concentrations are known to originate from galvanized roofs and downpipes so as long as rain is in contact with these surfaces, zinc will dissolve from the galvanized material (to various degrees depending on type and condition of galvanized surface) producing elevated dissolved zinc concentrations in stormwater runoff. Charters (2016) recently identified that disproportionally high loads of Zn in the Addington Brook are derived from roof runoff. Given the ubiquitous nature of dissolved zinc in Christchurch urban waterways, it would wise to implement source-control of this highly bioavailable metal, especially given dissolved fractions are much more difficult to remove than particulate fractions. While TSS concentrations are of most concern for the Riccarton Ave location, it appears that dissolved Zn should be targeted further up-stream at the Deans Ave location where its concentration is consistently highest (Figure 7).
Dissolved copper concentrations mainly exceeded the recommended LWRP (hardness-modified) in-stream guideline value of 3.56 µg/L (0.00356 mg/L) in the US Pond at the top of the catchment but concentrations in the pond’s outflow were well below this (Figure 7). In a consistent pattern of increasing pollutant concentrations down-stream, as seen for TSS and dissolved Zn, dissolved copper concentrations substantially increased at Deans Ave and Riccarton Ave although median concentrations for both sites were only 0.004 mg/L and barely above the HMTV guideline value (Figure 7). Concentrations measured by the CCC during wet weather events at Riccarton Ave in the preceding years sampling were similar; 0.0033 (Oct, 2012 – at recession of event), 0.0027 (Nov, 2012 – at recession of event), 0.018 (March, 2014 – at peak of event) and 0.003 (May, 2014 – at recession of event) mg/L (Margetts, 2013 and Margetts, 2014), to those measured in the 2015-2016 events reported in this study of between 0.002-0.007 mg/L (Figure 10). These data indicate that copper is removed in the Matipo ponds and is not a major concern in mixed in-stream water downstream in Addington Brook. However, it should be noted that highly elevated copper concentrations have been measured in mixed surface waters when runoff from copper roofs (and corroded air-conditioning pipes) discharge to it (e.g. O’Sullivan et al., 2012) although it is reported that no copper roofs exist within the Addington catchment Charters (2016).
19
3.2.3. Nutrients
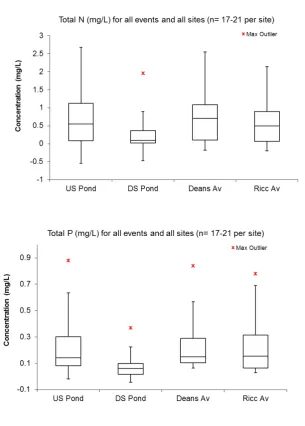
Total nitrogen (TN) and total phosphorus (TP) concentrations measured throughout each event are summarized for each location (Figure 11). Concentrations of TP and TN between sampling locations are generally similar, although in a consistent pattern seen within the catchment for other key pollutants, nutrients are retained within the Matipo pond system with concentrations then increasing down-stream of its outflow from other landuse activities. Concentrations of TN measured by the CCC during wet weather events in Addington Brook in the preceding years were similar; 0.95 (Oct, 2012 – at recession of event), 1.2 (Nov, 2012 – at recession of event), 1.6 (March, 2014 – at peak of event) and 1.5 (May, 2014 – at recession of event) mg/L (Margetts, 2013 and Margetts, 2014), compared with the 2015-2016 events reported in this study of between 1.14-1.70 mg/L (Figure 11). Similarly, concentrations of TP measured by the CCC during wet weather events in Addington Brook in the preceding years were comparable; 0.079 (Oct, 2012 – at recession of event), 0.1 (Nov, 2012 – at recession of event), 0.56 (March, 2014 – at peak of event) and 0.28 (May, 2014 – at recession of event) mg/L (Margetts, 2013 and Margetts, 2014), to those measured in the 2015-2016 events of between 0.08-0.90 mg/L (Figure 11).
A phosphorus source within the catchment could include surfactants conveyed in runoff during wash-down of vehicles (i.e. on impervious hardstand areas). Elevated phosphorus (especially Dissolved Reactive Phosphorus (DRP)) concentrations could lead to eutrophication, with excess algal growth and potential algal blooms especially in slow moving waters.
20
[image:21.595.51.565.244.559.2]21
Figure 11. Summary distribution of total phosphorus and total nitrogen concentrations at each sampling
[image:22.595.59.365.91.518.2]22
[image:23.595.53.572.251.563.2]23
3.3. Pollutant retention by the Matipo Ponds System
The overall performance of the Matipo stormwater pond system to treat pollutants was assessed in detail by examining the speciation of nutrients, metals and solids between the inflow and outflow during each sampling event. Figures 13 (phosphorus, P), 14 (nitrogen, N), 15 (TSS) and 16-17 (metals) present these data. Table 2a summarizes the concentrations and removal efficiencies for these pollutants in 2015-2016 and similarly, Table 2b summarizes the pond’s performance as reported in 2009 by EOS Ecology. Table 3 highlights the significance of the differences between the inflow and outflow concentrations for these pollutants in 2015-2016 (sampling time-points for rainfall, water level and concurrent pollutant concentrations are provided in Appendix A).
Table 3. Statistical results of pollutants in the inflow and outflow of the Matipo ponds (using a paired, 2-tailed t-test) with a probability (p) values of significance asterix-tagged depending on strength of significance; ***p<0.001; **p<0.01 and *p<0.05, n= 17 n/s = not significant.
Pollutant name Pollutant code p value Significance Strength of
Total Phosphorus TP 0.031 *
Dissolved Reactive Phosphorus DRP 0.048 *
Total Nitrogen TN 0.028 *
Total Kjeldahl Nitrogen TKN 0.145 n/s
Ammonium - N NH4 0.507 n/s
Nitrate + Nitrite NO3/NO2 0.967 n/s
Total Suspended Solids TSS 0.010 **
Turbidity Turbidity 0.003 ***
Dissolved Zinc Zn -dissolved 0.025 *
Dissolved Copper Cu - dissolved 0.0001 ***
3.3.1. Nutrient (Phosphorus and Nitrogen species) and Solids
24
Table 2a. Median inflow (In) and outflow (Out) concentrations (mg/L) and removal efficiencies (%Δ) of the KiwiRail Stormwater Ponds (Matipo Street) system 2015-2016 along with key rainfall metrics at the time of sampling, n = 17. – means net pollutant export from the system.
2015-2016 (Spring-Summer)
Event (start) 18/09/’15 11/11/’15 15/01/’16 27/01/’16 Overall
Rainfall intensity
(mm/hr) 0.80 0.51 0.89 0.93 0.85
Rainfall depth
(mm) 30.67 9.40 12.20 28.30 28.3
Event duration
(hrs) 38.50 18.50 13.75 32.00 25.25
25
Table 2b. Median inflow (In) and outflow (Out) concentrations (mg/L) and removal efficiencies (%Δ) of the KiwiRail Stormwater Ponds (Matipo Street) system in 2008 (EOS Ecology, 2009) along with key rainfall metrics at the time of sampling, n = 22-24. – means net pollutant export from the system.
2008 (Winter)
Event (start) 02/06/’08 17/06/’08 27/06/’08 23/07/’08 Overall
Rainfall intensity (mm/hr) Rainfall depth
(mm) 2.6 0.6 11.6 35.8 12.65
Event duration
(hrs) 11.99 20.15 25.02 94.16 37.83
26
[image:27.595.47.576.241.540.2]27
the 2015-2016 spring-summer sampling events seems to be poorer in the later years although it would be important to re-sample during the same seasons for definite comparisons (Tables 2a and 2b). Elevated nitrate/nitrite concentrations can be a concern given their high solubility and contribution to eutrophic algal growth. Although the LWRP does not have a guideline value for NO3-N, the ANZECC (2000) water quality guidelines stipulate a trigger value of 0.444 mg/L for lowland rivers to avoid excessive algal growth. Median concentrations in the pond inflow (US Pond) and outflow (DS Pond) in this study were 0.230 (0.05-1.17) mg/L and 0.18 (0.10-1.40) mg/L, respectively (Figures 6 and 13).
Total phosphorus (TP) is the sum of the particulate and dissolved (DRP) fractions, with the majority of phosphorus in the stormwater ponds comprised of particulate fractions as seen by the speciation concentrations (Figure 14). Despite the ability of the ponds to substantially and significantly (e.g. p<0.05) reduce net phosphorus overall, DRP concentrations consistently exceeded the LWRP guideline concentration of 0.016 mg/L in both inflow (median 0.08 (0.04-0.62) mg/L) and outflow (median 0.04 (0.01-0.10) mg/L) (Figure 7). During the most intense rainfall event sampled (#4; 0.93 mm/hr), TP and DRP concentrations were initially lower in the outflow compared with inflow stormwater but by the third sampling time-point, this pattern reversed, which was not observed in other events (Figure 14). The relationship between solids and TP was investigated to ascertain concurrent phosphorus removal as solids are settled from stormwater. However, only 34% of the data can be explained by their relationship (Appendix B), which suggests that targeting solids removal will not be very effective at removing most of the phosphorus concurrently.
Although solids (measured both as TSS and turbidity) concentrations were often very high in the stormwater inflow, the ponds were quite effective (significance p<0.01; Table 2a) at reducing these concentrations in the outflow, even during the largest events 1 and 4 (Figures 8 and 15). This is most likely attributed to adequate settling potential within the ponds despite the suspected hydraulic short-circuiting mentioned earlier.
3.3.2. Dissolved metal (zinc, copper, lead) concentrations
28
29
30
32
3.4. Pollutant Loads – Downstream Riccarton Ave Sampling Location
Flow at Riccarton Ave (Figure 3) was monitored concurrent to the time samples were collected for water quality, so pollutant loads for this site for the four wet weather sampling events were derived by multiplying the flow recorded by the concentration for the same time-point. The data were then expressed as statistically (median, minimum and maximum) summarised rate loads (g or mg)/min and are represented along with the flow for each event (Table 4). As mentioned earlier in section 2, the data show that surface water was sampled throughout the rain event at all characteristic time points (with the exception of event 1 at Riccarton Ave where the peak of the event was not captured), providing valuable information about the range of concentrations measured throughout each event at each location so that their pollutant loads could be estimated (Figures 18-23).
Overall, median pollutant loads are not clearly influenced by rainfall in the catchment (Table 4). Since these loads are a factor of in-stream mixed concentration and flow rate, and there were no consistent patterns in pollutant concentrations as a function of rainfall metrics as discussed earlier, it follows that higher pollutant loads are not necessarily observed in response to greater rainfall. However, event 4 which was the largest rainfall event, did yield largest net pollutant maximum loads (Table 4) compared to the earlier, smaller events.
33
Table 4. In-stream mixed pollutant loads (mass/min) for Riccarton Ave for each sampling event (n=3-6 per event) along with summary rainfall metrics.
Event 18-20/09/’15 11-12/11/’15 15-16/01/’16 27-28/01/’16 Average all events Average Rainfall
intensity (mm/hr)
0.80 0.51 0.89 0.93 0.78
Rainfall depth (mm)
30.67 18.50 13.75 30.50 23.35
Event duration (hrs)
38.50 9.40 12.20 28.30 22.10
Pollutant (g/min) *Pb (mg/min)
Med. Min. Max. Med. Min. Max. Med. Min. Max. Med. Min. Max. Med. Min. Max.
TSS 174 105 1808 3839 190 5851 3036 49 6426 5207 53 25020 1808 49 25020
Diss.Zn 0.42 0.21 1.75 1.68 0.21 2.29 3.18 0.41 4.16 1.88 0.23 5.18 1.75 0.21 5.18
Diss.Cu 0.0017 0.0013 0.040 0.064 0.036 0.104 0.11 0.012 0.137 0.066 0.015 0.226 0.063 0.012 0.226
*Diss. Pb 1.18 0.84 3.24 3.78 1.13 9.41 11.17 1.30 17.59 10.42 1.52 53.04 7.10 0.84 53.04
Diss. As 0.01 0.01 0.01 0.02 0.01 0.03 0.04 0.01 0.10 0.05 0.01 0.20 0.03 0.01 0.20
TN 8.44 4.38 19.31 46.18 9.52 71.23 36.76 3.66 60.28 37.69 6.87 121.10 37.23 3.66 121.10
TKN 4.86 1.39 12.95 35.91 6.51 61.06 28.74 2.28 47.74 30.79 2.16 105.06 29.76 1.39 105.06
NH4 1.61 0.33 3.24 4.01 1.78 5.70 4.59 0.21 6.95 3.28 0.42 24.02 3.64 0.21 24.02
NO3/NO2 3.78 2.99 6.47 8.65 3.00 11.84 7.87 1.38 12.55 9.15 4.71 18.41 8.26 1.38 18.41
TP 0.59 0.59 3.01 12.11 1.10 17.81 6.07 0.33 10.30 10.43 0.47 27.72 8.25 0.33 27.72
34
35
36
37
38
39
40
3.5. Pollutant Loads – Modelled versus measured at Riccarton Ave
The key stormwater metals of concern, dissolved zinc (Figure 19) and copper (Figure 20) loads, measured during four wet weather events for the Riccarton Ave sampling location were compared to dissolved zinc and copper loads predicted for all wet weather events by the MEDUSA model for the catchment (Table 5). MEDUSA delineated all impervious surfaces and generated metal loads for the roofs, carparks and roads (Charters, 2016). Modelled pollutant loads represent the dissolved metal load generated from those impervious areas for all (88) wet weather events in 2015, whereas the measured pollutant loads represent the in-stream dissolved metal loads for four wet weather events in 2015-2016.
Table 5. Modelled and measured dissolved pollutant loads at the Riccarton Ave sampling location (2015-2016). Data are presented as median dissolved metal load per event (g/event). Modelled median event loads are from 88 events a year (2015). Measured median event loads from four wet weather events during 2015-2016.
The median pollutant loads for dissolved Zn and Cu that were measured during the four wet weather rain events were very similar to median events loads predicted using MEDUSA (Table 5, Figures 24 and 25). Overall, 2.8 kg dissolved Zn per event were predicted to originate from impermeable surfaces (79% roofs) within the catchment while 2.3 kg dissolved Zn/event of this were measured in-stream. Similarly, 45 g dissolved Cu per event were predicted to originate from impermeable surfaces (39% carparks, 30% roads, 31% roofs) within the catchment comparted to 84 g measured in-stream. Little differences between measured and modelled dissolved metal loads overall highlight two things; (1) the MEDUSA model is effective at predicting the amount and origin of dissolved Zn especially and also dissolved Cu within this catchment and; (2) little immobilisation of these dissolved metals seems to occur downstream from the source since concentrations of dissolved metals were
Dissolved Zn Dissolved Cu
Modelled Measured Modelled Measured
Average 2814 2323 44.8 83.5
Minimum 278 15.9
Maximum 6869 299.7
Contribution from each surface type
Roofs: 79% Roofs: 31%
Roads: 9% Roads: 30%
41
[image:42.595.130.507.192.455.2]similar. Results from the modelling highlight the likely dominant contribution of dissolved zinc from galvanised roofs and downpipes within the catchment and that carparks produce the most dissolved copper. These findings are substantiate by monitoring of specific surfaces conducted from earlier analysis of the Addington Brook catchment (Charters, 2016).
42
43
4. Summary
4.1. Key findings
• Surface water was sampled at all characteristic time points, providing valuable information about the range of concentrations measured throughout each wet weather event at each location.
• Large amounts of TSS enter the Matipo stormwater ponds at the very top of the catchment and are substantially reduced after passing through the ponds but subsequently increase further down-stream of Deans Ave where Addington Brook flows through an open channel before it converges with the Avon
River/Ōtākaro.
• TSS concentrations are typically highest during the earlier sampling points at each site, reflecting the initial (‘first’) flush of solids from impervious surfaces following rainfall. However, concentrations at the receding end of the storm events are still higher at Riccarton Ave (and to a lesser extent Deans Ave) compared to previous years wet weather data.
• Dissolved zinc was consistently and highly elevated above the relevant LWRP guideline throughout the catchment, despite being significantly retained in the Matipo ponds. Concentrations substantially increase down-stream of these ponds with the highest values at Deans Ave, capturing the majority of runoff from the industrial/commercial sector. Large galvanized roof areas in this sub-catchment have shown to contribute very high concentrations of zinc, mainly in dissolved form. While dissolved Zn concentrations are typically highest at the start of a rain event, they remain moderately elevated throughout the storm duration, which may be attributed to their dissolution from galvanized roofs and downpipes for the duration of the rainfall contact time.
• Dissolved copper is removed in the Matipo ponds and is not a major concern downstream in Addington Brook while dissolved lead (Pb) never exceeded the guideline value in any sample.
• Concentrations of TP and TN between years and sampling locations are generally similar, although a consistent pattern seen within the catchment was that these nutrients (along with other key pollutants) are retained within the Matipo pond system but concentrations increase down-stream of its outflow.
• Concentrations of NH4—N were below the maximum guideline to prevent toxicity to freshwater fish. Higher concentrations were found during the smallest event, which could indicate that the source of ammonium is not related to rainfall runoff, but the exact source of ammonium is undetermined.
44 • Most TP in the stormwater ponds was particulate. Despite the ability of the ponds to significantly reduce TP, DRP concentrations consistently exceeded the LWRP guideline. Targeting solids removal will not be very effective at removing most of the phosphorus concurrently as only a 34% correlation was found.
• TN in the stormwater ponds was comprised mostly of organic TKN. While TN concentrations were significantly removed in the Matipo pond, the inorganic nitrate/nitrate concentrations were sometimes higher during larger rainfall events, suggesting that N in the pond was converted from organic to inorganic fractions through the processes of mineralization and subsequent nitrification.
• The Matipo ponds system is still very effective at retaining dissolved metals with all dissolved metals in the outflow almost consistently below their LWRP guideline values. There was no consistent pattern in inflow metal concentrations as a function of rainfall parameters since longer duration or higher intensity events did not produce greatest metal runoff levels.
• Overall, the Riccarton Ave location transports median loads of 1.808 kg/min TSS, 1.75 g/min dissolved zinc, 6.3 mg/min dissolved Cu and 7.1 mg/min of dissolved lead as well as 37.23 g/min TN and 8.25 g/min TP downstream into the Avon River/Ōtākaro.
• Pollutant loads for dissolved Zn and Cu that were measured in 2015-2016 were very similar to those predicted using MEDUSA highlighting two things; (1) the MEDUSA model is effective at predicting the amount and origin of dissolved Zn especially and also dissolved Cu within this catchment and; (2) little immobilisation of these dissolved metals seems to occur downstream from the source since concentrations of dissolved metals were similar. Results from the monitoring and modelling highlight the dominant contribution of dissolved zinc from galvanised roofs and downpipes within the catchment and that carparks produce the most dissolved copper. These data substantiate similar findings from earlier analysis of the catchment.
4.2. Recommended further work
• Stormwater pipes entering Addington brook near the netball courts of South Hagley Park and on the south side of Riccarton Ave apparently convey substantial suspended solids loads. Therefore, it would be prudent to focus efforts on targeted sampling and pollutant mitigation at the main discharge points
at this end of the brook to reduce the amount of solids entering the Avon River/Ōtākaro. It would also
45 • Given the ubiquitous nature of dissolved zinc in Christchurch urban waterways, it would wise to
implement source-control of this highly bioavailable metal, especially given dissolved fractions are much more difficult to remove than particulate fractions. Dissolved Zn should be targeted at the Deans Ave location where its concentration is consistently highest and steady throughout the rainfall duration.
• It could be valuable to consider (1) maintenance and; (2) a pollutant tracking exercise for the Matipo pond elements to ascertain their functioning hydraulic retention time, as this time will likely influence the amount of dissolved pollutants (metals and nutrients) that can be removed from diffuse stormwater runoff inputs.
• Comparison of the Matipo ponds treatment performance with that of other stormwater ponds in Christchurch would provide valuable local data for future stormwater pond designs.
• The data in this report represent in-stream mixed concentrations only (water was not sampled directly from pipe discharges), so it is impossible to distinguish between what flowed into the stream during the rainfall events and what may represent some existing (stored) pollutants that may become mobilized when it rains. Sampling from key stormwater pipe discharges and mixed in-stream water at the same time would enable an understanding of the mixing (and dilution) potential of the receiving waterway. Additionally, with flow and concurrent water quality data monitored at other sites in the catchment, it would be possible to compare pollutant loads at the different sub-catchment locations to estimate the greatest pollutant loads to the river system.
5. Acknowledgements
The authors would like to thank Michele Stevenson, Jenny Watters, Lesley Bolton-Richie and Rachel Webster from Environment Canterbury (ECan) for providing the data, their valuable knowledge on the catchment, relevant related reports and peer-review and feedback.
6. References
1 ANZECC (2000). Australian and New Zealand Environment and Conservation Council, ANZECC, and Agriculture and Resource Management Council of Australia and New Zealand, ARMCANZ), 2000. Australian and New Zealand guidelines for fresh and marine water quality. Volume 1: The guidelines. ANZECC & ARMCANZ, Artarmon, New South Wales.
46
3 City Design (1999). Operation and maintenance manual for the Tranz Rail stormwater ponds at Matipo Street. City Design, Christchurch City Council, 16 pp.
4 EOS Ecology, (2009). Monitoring of the Tranzlink Ponds: 2008. EOS Ecology Report No. 06046-CCC02-01, 23 pp., April 2009.
5 EOS Ecology, (2011). Stormwater treatment effectiveness of the Transzlink Ponds Wetland. EOS Ecology Report No. 06046-CCC02-02, 26 pp., September 2011.
6 Fraga, I., Charters, F., O'Sullivan, A. & Cochrane, T. (2016). A novel modelling framework to prioritize estimation of non-point source pollution parameters for quantifying pollutant origin and discharge in urban catchments. Journal of Environmental Management, 167, 75-84.
7 Margetts, B. (2013). Appendix Wet Weather Monitoring. Annual Results Summary May 2012 – April 2013, 27 pp. July 2013, Christchurch City Council.
https://www.ccc.govt.nz/assets/Documents/Environment/Water/Monitoring-Reports/Interim-Global-Stormwater-Consent-Wet-Weather-Surface-Water-Quality-2013-PDF-0.42-MB.pdf
8 Margetts, B. (2014). Interim Global Stormwater Consent. Wet Weather Monitoring Report for the period May 2013 – April 2014, 55 pp. July 2016, Christchurch City Council.
https://www.ccc.govt.nz/assets/Documents/Environment/Water/Monitoring-Reports/Interim-Global-Stormwater-Consent-Wet-Weather-Surface-Water-Quality-2014-PDF-1.45-MB.pdf
9 Margetts, B. and Marshall, W. (2015). Surface Water Quality Monitoring Report for Christchurch City Waterways: January-December 2014, 105 pp. July 2016, Christchurch City Council
10 Margetts, B. and Marshall, W. (2016). Surface Water Quality Monitoring Report for Christchurch City Waterways: January-December 2015, 144 pp. July 2016, Christchurch City Council.
11 NIWA 2011, High Intensity Rainfall Design System Version 3.
12 O’Sullivan, A. D., Wicke, D. and Cochrane, T.A. (2012). Heavy metal dynamics in an urban stream fed by contaminated air-conditioning and stormwater discharges. Environmental Science & Pollution Research, 19 (3): 903-911.
47
[image:48.595.57.538.153.394.2]7. Appendices
Table A1. Sampling time points for the Matipo stormwater ponds with water level
Event Date & Time Time point Rainfall (mm/5 min) US Level (mm) DS Level (mm)
1
19-09-15 05:33 1 0.20 363 323
19-09-15 21:08 2 0.20 577 411
20-09-15 00:38 3 0.60 738 588
20-09-15 13:15 4 0.00 357 349
2 11-11-15 18:06 11-11-15 18:56 1 2 0.62 0.32 423 475 325 356
11-11-15 23:26 3 0.40 419 348
3 15-01-16 21:41 16-01-16 01:06 1 2 0.00 0.00 402 371 330 354
16-01-16 03:06 3 0.00 599 468
16-01-16 11:40 4 0.00 356 316
4
27-01-16 04:17 1 0.20 441 374
27-01-16 16:03 2 0.00 477 346
27-01-16 16:48 3 0.20 671 555
27-01-16 17:38 4 0.40 644 553
28-01-16 04:38 5 0.00 610 523
28-01-16 05:38 6 0.00 405 287
[image:48.595.93.503.272.667.2]48