i
AUTOMATING AND
IMPROVING THE PRINTING
PLANNING PROCESS
Jongbloed BV
SEPTEMBER 10, 2013
JONGBLOED BV UNIVERSITY OF TWENTE
AUTHOR: ARJEN COLIJN
ii
Management Summary
Jongbloed is a company that is known for its ability to manufacture books on very thin paper. Nowadays, it consists of two business units namely a publishing and a book manufacturing unit. The book manufacturing business unit uses an almost manual production planning which is labour-intensive. Jongbloed would like to purchase a production planning software package, such that the production planning can be automated and improved. However, there is a wide variety of
production planning rules that can be used in various production planning packages. Therefore, we were asked to analyse these rules and select the best performing rule given several performance indicators.
After studying the current situation, we formulated the following main research question: “What production planning rules should be used to automate and improve Jongbloed’s production planning?”
First, we analyse the current situation. We want to know the magnitude of improvement of a new production planning software package, and we therefore need to quantitatively describe the current situation. We compute that in approximately 62 percent of the leadtime, a project is waiting for either materials or the next process. Obviously, zero waiting time is impossible because machines fail and need maintenance, suppliers do not deliver raw materials and other projects also need to be processed. All these reasons cause waiting time. Still, the improvement potential is quite large. Literature provides us with several methods to automate and improve the production planning. Roughly speaking, there are two methods of ‘simple’ production planning namely global and local. A local production planning is a production planning per machine, whereas a global production
planning is an overall planning for the complete factory. However, not a single method outperforms all the others. Therefore, we build a computer model that has the same characteristics as the production process of Jongbloed. It allows us to analyse different production planning rules, without actually implementing them.
After running the computer model with the different types of production planning, we conclude that local methods outperform global production planning approaches. Global production planning methods do not automatically reschedule, whereas local production planning are able to do so. There is one major drawback of local production planning. As the planning is per machine and only includes projects that are present in the queue (and thus not future projects), its horizon is very short. Therefore, it is impossible to react to future spikes in the number of waiting projects and plan preventive maintenance. So, we would like to implement the best performing global production planning rule namely global forward planning. This rule makes a complete planning for the factory and adds the projects to all the necessary processes, at the first possible time slot.
If we compare the global forward planning method to the current situation, given the four
iii
Preface
This report is the result of a graduation project at Jongbloed, located at Heerenveen. I started approximately six months ago, with virtually no knowledge of the book printing and binding process. During this internship, I learned several terms and processes that are specific for the printing- and binding industry. I am very grateful for all the time that the employees at Jongbloed spent to explain them to me. Especially Jan Egas, my supervisor at Jongbloed, has been very helpful by reviewing the content of my research and enabling me to get the research to a higher level. I would also like to thank Sipke Boschma, head of the pre-production department and responsible for the production planning, for explaining the current practice and reviewing my computer model.
Besides the support at Jongbloed, I would like to thank Peter Schuur and Martijn Mes. Peter Schuur has been very helpful by reviewing my research and providing valuable suggestions for the next step in my research. Martijn Mes reviewed my report and helped me to fix errors in the computer model. It would have still been a buggy model without his help.
iv
Glossary
Bookblock – A set of section, which contains the full content of the book.
Book block manufacturing department – In this department, the different sections are collected and sewn.
Bindery department – Department where the bookblock is attached to the cover.
Cover department – Department where the covers are manufactured, which are afterwards used in the bindery department.
Gauze – Gauze is used to strengthen the spine of the book.
Printing department – The sections are printed in the printing department, one-by-one.
Ribbon – One ‘track’ of paper in the printing press.
v
Contents
1 Introduction ... 1
1.1 Company description ... 1
1.2 Research topic ... 1
1.3 Research questions ... 1
1.4 Research method ... 2
1.5 Conclusions ... 3
2 Identification of the problem ... 4
2.1 Current situation ... 4
2.2 Visualization problems ... 11
2.3 Desired situation ... 13
2.4 Difference between the current and the desired situation ... 14
2.5 Conclusions ... 14
3 Problem analysis ... 15
3.1 Indicators ... 15
3.2 Jongbloed’s current production planning ... 15
3.3 Conclusions ... 28
4 Generating alternative solutions ... 29
4.1 Theoretical type of production ... 29
4.2 Scheduling ... 30
4.3 Conclusions ... 38
5 Solution approach ... 39
5.1 Choosing a method to evaluate production planning rules ... 39
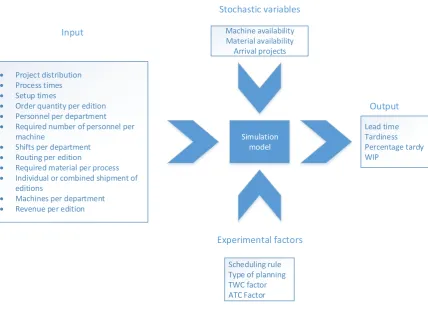
5.2 Conceptual model ... 39
5.3 Simulation model ... 45
5.4 Experimental design ... 57
5.5 Conclusions ... 58
6 Results ... 59
6.1 Computation scores ... 59
6.2 Analysis planning methods ... 60
6.3 Sensitivity analysis ... 61
6.4 Conclusions ... 68
7 Implementation and evaluation ... 69
7.1 Implementing the solution ... 69
vi
7.3 Conclusions ... 70
8 Conclusions and future research ... 71
8.1 Comparison to current situation ... 71
8.2 Future research ... 71
9 Bibliography ... 73
10 Appendices ... 76
10.1 Appendix A – Overview of the research method ... 76
10.2 Appendix B – Description Data Set ... 78
10.3 Appendix C – Full description simulation model ... 79
10.4 Departments ... 79
1
1
Introduction
This report describes a master research project to complete the study of Industrial Engineering and Management at the University of Twente, performed at Jongbloed BV which is located in
Heerenveen. We first give a description of the company in Section 1.1, continue with an introduction to the research in Section 1.2, discuss the research questions in Section 1.3, then describe the used research method in Section 1.4 and end with a conclusion in Section 1.5.
1.1
Company description
Jongbloed was founded in 1862 as a printing house in Leeuwarden. Nowadays, it is located in Heerenveen, employs about 100 employees and is transformed to a publishing group which focuses on the publishing of Christian books and magazines. Over the last two decades, they took over some publishers such as ‘J.J. Groen en Zoon’ and Medema. Also, they introduced several new brands such as Columbus, which focuses on books for children between the age of four and 17.
Nowadays, Jongbloed consists of two business units, namely the publishing business unit and the printing house. This research focuses solely on the printing house unit which make books. The
publishing unit does marketing for bibles, bible software and serious games for educational purposes, provides educational material for children, and publishes both Christian magazines and books in the Netherlands.
Jongbloed is specialised in printing on thin paper, which only a few companies in the world are able to do. Over ninety percent of the total production is exported, even to China. Bible sales are nowadays declining, and therefore Jongbloed introduced a new product. It is called the ‘Dwarsligger’, which is a book of eight by twelve centimetres where the text is printed turned ninety degrees compared to a ‘normal’ book.
1.2
Research topic
The broad topic of this report is the planning of the different orders at the printing house. Making a book consists of several steps, such as printing, sewing of the book blocks, making the book cover and finally combining the book cover and the book block. These are some of the activities that need to be planned, in order to deliver to the customer on time. However, reality is far more complex than these ‘simple’ activities suggest. Jongbloed’s customers have a large amount of options to customize books. Examples of customization are the type of cover, which is either hardcover or softcover, the material of the cover, such as leather or paper, and the cover of a book, which can be gold plated. All the different varieties affect the complexity of the production planning. The different types of books have different lead times, different operations and different resources such as machines, materials and machine operators. What makes production even more complicating, is that one project often contains various editions. For example, a project can contain an inexpensive paperback and also a luxurious edition, with a leather cover. Often, all different editions within one project are shipped at once. This makes planning even more complicating, as different editions have different lead times.
Nowadays, this planning is made by hand using Excel. The core of this research is to find out whether there are algorithms to facilitate the production planning.
1.3
Research questions
We have just given a small introduction to the problem. We now define the main research question and continue with several sub research questions, which are more manageable compared to the main research question. The answers to the sub research questions combined answer the main
2 research question.
Given the problem formulation in the previous chapter, the following main research question can be stated:
“What production planning rules should be used to automate and improve Jongbloed’s production planning?”
As discussed earlier, this main research is still quite ‘vague’. Therefore, we defined several sub research questions:
1. How does Jongbloed manufacture books?
2. How is Jongbloed’s current production planning performing?
a. What is the average waiting time, as a percentage of the average lead time? b. What is the estimated distribution of the four categories, which are material availability, machine issues, employee capacity and planning, which cause the waiting time?
c. What failures occur at the two printing presses? d. What is the workload per week per department? 3. What production planning rules are available in literature?
4. How do the different production planning rules perform on Jongbloed’s production? 5. How can the best performing production planning rule be implemented?
6. How can the best performing production planning rule be evaluated?
As the main research question suggests, we would like to recommend a set of production planning rules that can be used to automate Jongbloed’s production planning. We now briefly discuss our approach to answer each sub research question.
1. For the first sub research question, we work at each department for some time. This gives us the opportunity to interview a lot of different employees in a casual setting.
2. To answer this question, we gather all the required data and perform a data analysis. 3. We do a structured literature research to answer this question.
4. There are different ways to analyse the performance of production planning rules. After evaluating the possible manners to do so, we describe a model to assess the performance of the production planning rules.
5. After evaluating the different production planning rules, we discuss the implementation of the best performing rule. It contains some guidance how to do the implementation.
6. In the last sub research question, we discuss some guidelines to evaluate the performance of the chosen production planning method.
Ultimately, we would like to answer the main research question. This is a set of rules that can be used to automate Jongbloed’s production planning.
1.4
Research method
3 currently not available in the organization. A graphical representation of the research frameworks and their relation is shown in Figure 2.
Figure 2: Graphical representation of the research frameworks and their relation
Whenever there is knowledge required, such as ‘What is the average lead time of book X’, we enter the methodological checklist cycle. Starting the methodological checklist is possible in any step of the MPSM, except for the ‘Implementing the solution’ phase. After executing the methodological checklist, we return back to the same phase as where we left. With the new knowledge that we gained from executing the methodological checklist, we can continue with the MPSM. A detailed description of all the topics of both the MPSM and the methodological checklist can be found in Appendix A.
1.5
Conclusions
In this chapter, four subjects have been discussed namely the company description, the research topic, the research questions and the used research method. Especially the research topic, the research questions, and the research methods are important for this research. The research topic is the planning of the production. Using the research method, a combination of the MPSM and the methodological checklist, enables us to systematically analyse the current situation and provide recommendations to improve the current situation.
Identification of the problem
Managerial Problem Solving Method Methodological
checklist
Formulation of the problem-solving method
Analyzing the problem
Generating alternative solutions Choosing a solution
Implementing the solution Evaluate the solution
Research goal
Problem statement
Research questions
Research design
Operationalization
Measurement
Processing of data
Whenever there is knowledge required
4
2
Identification of the problem
In this chapter, we give an overview of the production process and its complexity. After describing the current situation in section 2.1, we visualize the problems in the problem diagram in section 2.2, continue with the desired situation in section 2.3 and then do a comparison between the current and the desired situation in section 2.4.
2.1
Current situation
We first give a broad introduction of the production process; how do they actually make a book. This description is continued with an in-depth analysis of each department, in a chronological order from the sales order to the end product. Finally, we visualize all problems in one flowchart to provide an overview.
2.1.1
Production of a book
The making of a book starts several weeks before the production. First, the customer comes to Jongbloed (or the other way around) to negotiate about a new (or reprint) book. After negotiation, the order is confirmed. We describe a more-or-less ‘standard’ book.
Next, the pre-production department starts to formulate the work instructions and orders the necessary materials (which highly depends on the chosen book, as the degree of customization is high). Furthermore, the pre-production department is responsible for the planning. The exact routing of the book through the factory highly depends on the degree of customization. The next department is where the actual production of the book starts, it is called the Prepress department. They check the files, which contain the content of the book, and correct them if
necessary. The customer then gets an example book, either digitally or by regular mail. If the result is satisfactory, the file is converted and sent to a machine that transforms UV-sensitive plates into plates that can be used in the printing house department. These plates allows Jongbloed to transform plain paper into printed paper.
The subsequent department is the printing house. Plates that were made at the ‘previous’
department are loaded into the machine. The machines then prints the text that is on the plates on paper, cuts the paper to several ribbons (Dutch: baan), gathers the ribbons, cuts the paper, folds the paper and then all the sections (Dutch: katernen) are collected and stored in a waiting area or transported to the next department. A section contains one, two or three copies of a book,
depending on the size of the book. Whether the sections are stored or immediately transported to the next department depends on whether the printed sections are directly required in the next department or not. Often, the paper needs to rest for a couple of days before the next production step can start.
The succeeding department is the book block department. It actually consists of two successive production steps, namely gathering and sewing. First, all the different sections and flyleaves (Dutch: schutbladen) are collected and combined in a book block, thereafter the book blocks are sewed. While the sections are gathered and sewed, the cover department starts producing the cover. The specific production steps depend on the type of cover.
5 side excluding the spine of the book) a small piece is cut off. Now, it is possible to browse through the content of the book.
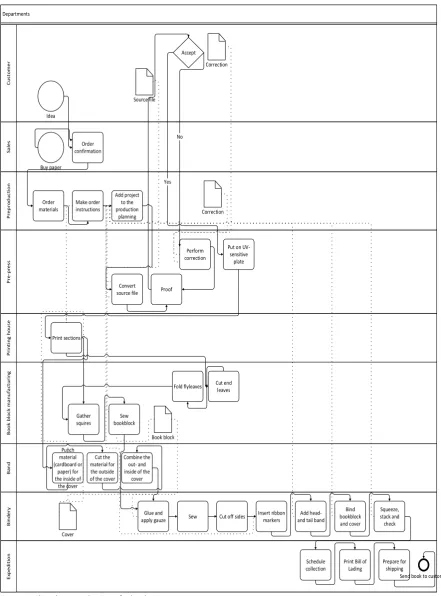
Figure 3: Flowchart production of a book
If it is a more luxurious book, it is taken of the production line and the edges of the book can be gold plated. Besides gold plating on the edges of the book, corners can also be rounded and a layer of
Departments S a les P re p ro d u c ti o n P re -p res s P ri n ti n g h o u se B o o k b lo c k ma n u fa ct u ri n g B a n d B in d er y E xp e d it io n C u st o mer Order materials Add project to the production planning Idea Convert source file Make order instructions Source file Perform correction Correction Correction Proof Accept
Put on UV-sensitive plate No Yes Print sections Gather squires Sew bookblock Punch material (cardboard or paper) for the inside of
the cover
Glue and
apply gauze Sew Cut off sides
Insert ribbon markers
Add head- and tail band
Bind bookblock and cover Squeeze, stack and check Prepare for shipping
Send book to customer Book block Cover Cut end leaves Fold flyleaves Cut the material for the outside of the cover
Combine the out- and inside of the
cover Order
confirmation Buy paper
Print Bill of Lading Schedule
6 paint can be applied on the three sides on the book. More luxurious books are now processed by hand.
The next station is the ribbon marker machine, which inserts the required number of ribbons into the book. Thereafter, a layer of glue is applied to the spine of the book. A small sucker (vacuum cleaner) than grasps the ribbon markers and fixes them on the spine of the book. Next, the head- and tail band is applied. In the next step, the book block (which now has gauze, is sawn, is cut, has ribbon markers, and has a head- and tail band) is combined with the cover. The last four steps include applying pressure on the book, stacking the books, visually inspecting the books and stacking it on a pallet. All these different production steps are summarized in Figure 3.
2.1.2
Challenges of the departments
In this section, an in-depth description per department is given. We skip the sales department because it is not relevant for our problem. Still, they are affected by the production planning. It determines the lead time of the products, which sales needs to pass on to their customers. In each of the departments below, we have spent one day talking, observing and helping to get to know the process. Per department, we describe their processes from three different points of view namely the current situation, information flows and how the planning supports the processes per department. These different views enable us to give a proper description of the current situation.
2.1.2.1 Pre-production department
The pre-production department is the second department in line, right after the sales department. They make the work instructions for all the departments, order the necessary materials and make the production planning. We first discuss the current situation, continue with the information flows and finish with the role of the production planning.
Current situation
The pre-production department is an important department. The degree of customization is high, and therefore the materials often need to be ordered specifically for an order. After ordering the required materials and making the work instructions, all the production steps need to be added to the already existing production planning. Doing so is a responsible job, as the results of forgetting to order material or not adding a production step to the production planning can be devastating.
Information
There are all different sorts of information flows. Order confirmations do not always contain all specifications, so communication is required in order to ‘fix’ this. Also, there is quite some communication between the pre-production department and the actual production department. The subject often concerns material that is not available or work instructions that are not completely clear.
Role of the production planning
7
2.1.2.2 Pre-press
In this section, we describe the current situation, the information flow and the role of the production planning for the pre-press department.
Current Situation
The pre-press department is where they make the required plates for the printing house department. Their responsibilities concern the
correction of the files that the customer sends, convert the file to a local format and finally a file for the machine, uploading a digital version of the book-proof to the customer or sending it by mail, receiving a confirmation from the customer that the file or printed book looks ok and then sending the digital file to the machine that makes the plates for the printing house.
Information
The information that flows in and out of the pre-press department is not yet ideal. Confirmation that the uploaded file or printed proof-book is okay, often first arrives at the pre-production or sales department, before being forwarded to the pre-press department. This is not directly related to this report, however this disturbance surely does affect the processing time at the pre-press department. If a confirmation mail gets stuck, it obviously takes more time to process a new order.
Furthermore, the communication is not always clear. Even in the production planning, the name of the project is sometimes stated wrong. Not each employee has the same term for the exact same book, this is also quite confusing. Additionally, corrections (from either customers or Jongbloed itself) are only applied to the local copy of the file. The source file is unchanged, therefore in case of a reprint, the corrections are not included. Moreover, orders are not always complete. All necessary information of an order is occasionally missing and therefore requires searching for the correct information.
Role of the production planning
The pre-press department has its own section in the production planning. However, the planning for the pre-press department does not show the complete planning. Sometimes, the production
planning shows old data and sometimes it only displays a part of the production planning. Therefore, the pre-press department does not work with their own part of the production planning anymore. They decided to let the planning of the printing house also be their planning. In the current situation, the pre-press department needs the following resources in order to manufacture aluminium sheets:
Files from the customer.
Order instruction, which contains information such as the name of the customer, the number of colours and pages and other technical printing information.
A confirmation of the customer that the printed proof-book or the digital file is correct.
UV-sensitive press plates.
Chemicals, to develop the plates and also gom, which is a thin protection layer on the plates. The last two resources might be outside of the scope of this research, but have been added for the sake of completeness.
8 2.1.2.3 Printing house
The printing house department is the department which uses the sheets that are made by the previous department, the pre-press department. First, we describe the current situation, continue with the information that is currently used and finish with the role of the production planning.
Current situation
The printing house can be seen as the bottleneck of the factory. The overall equipment effectiveness (OEE) consists of three factors, namely availability, performance and quality (Pintelon & Muchiri,
2006). The OEE is approximately forty percent, slightly varying over the two machines. There is a difference between the two machines in terms of specifications. The younger of the two, called the Timson 3, has an exchangeable cylinder and folding machine. The other one, called the Timson 2, has a fixed cylinder and folding machine. Especially the setup-times, changing equipment and failures are responsible for a large part of the non-productivity. After the sections are processed, they are collected and strapped. Depending whether the project is necessary in the next department, the project is either transported to the next department or stored in a storage area.
Information
There is only one leading source of information, which is the production planning. There is not really any other source of information, which is important for this study.
Role of the production planning
The printing house department is the bottleneck of the factory, and therefore they follow the production planning quite strictly. This planning is leading for the printing house department. 2.1.2.4 Book Block Manufacturing Department
The book block manufacturing department consists of two processes, namely the gathering of sections and the sewing of the book blocks. First, we describe the current situation, then the information that is present and the role of the production planning.
Current Situation
As discussed earlier, the book block manufacturing department consists of two processes. Input for the book block manufacturing department are sections and flyleaves. Sections are produced by the printing house, flyleaves are supplied by a supplier. They are first cut into the correct size and then folded (and glued) on a section.
First, the different sections and flyleaves (the combination depends on the book) are loaded onto the stations from one to twenty. The
maximum number of stations that can be gathered from simultaneously is twenty. If there are more than different twenty sections, the book block is gathered in more than one step. The machine collects one of each section using a transportation system. At the end of the machine, a complete book block arises. The book
Figure 5: Printing press
9 blocks are stacked onto pallets and stored in a waiting area. The second step of this department, namely the sewing of the book blocks is the next step in producing a book. A pallet with book blocks is collected from the storage area and fed into the machine. The machine then sews the book block. The final step at this department is firmly squeezing the book blocks. Again, the sewed book blocks are stacked onto pallets. They are stored in yet another waiting area, until they are required by the next department.
Information
Each pallet of book blocks is accompanied by a paper that states the project number, project name and other useful information. This is used to identify projects. Again, the production planning is another source of information.
Role of the production planning
The production planning is not always followed, for example, when the gathering machine is not yet finished on a certain project. The sewing machines that normally would continue with this project than continues with another project. If they would not do so, they would have to wait. Therefore, the sewing machines highly depend on the gathering machine. If the gathering machine is not finished, because the flyleaves are not yet ready or they simply did not gather the sections yet, the sewing machines starts with a different project. This example illustrates the highly dependent relation between the gathering machine and the sewing machines.
2.1.2.5 Cover department
The cover, combined with the book block, basically makes a book. First, we describe the current situation, continue with the information and finish with the role of the production planning.
Current situation
Not all covers are produced at Jongbloed. Covers that are cheaper to import, such as softcovers, are
outsourced to China. Sometimes the finishing, such as gold embossing, is done inhouse. Generally, hardcovers are produced inhouse. The hardcovers start with producing the inside of the cover. The ‘body’ is punched out of a sheet of cardboard. Next, the outside of the cover is cut into the right dimension and the final step is to glue the inside to the outside of the cover, thus combining the two semi-finished products.
Information
As described before, the production planning is the main source of information. Besides this paper flow of information, there is a lot of communication between the pre-production department and the cover
department about for example order specifications and missing material.
Figure 7: Sewing machine
Figure 8: Machine for adding embossing
10
Role of the production planning
The band department is comparable to the luxury department, in terms of dependence on material (both raw and semi-finished). If the correct raw material in the right quantity is not present, they simply cannot start producing.
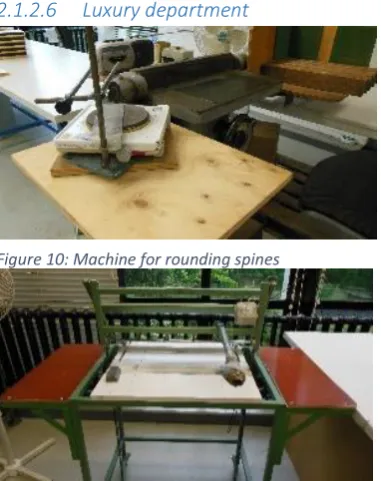
2.1.2.6 Luxury department
Jongbloed offers a lot of customization to its customers. Some of them are more luxurious, these are processed by the luxury department. First we describe the current situation, continue with the information section and end with the role of the production planning.
Current situation
There is a lot of variation in the luxurious products that Jongbloed offers to its customers. These products are often labour intensive. Often, books start as similar products but the subsequent production steps differ. An example is an expensive cover with leather, which are frequently combined with other more expensive production processes such as adding a thumb index or a zipper.
Information
The luxury department is placed almost at the end of the production process. Therefore, this department is highly relying on previous activities and raw materials. Thus, the production planning is important source of information. Besides the production planning, another source of information is communication about for example the delivery date of raw material and so on.
Role of the production planning
The luxury department is highly dependent on the materials and the previous activities. Consequently, the production planning cannot always keep up with the actual situation. Raw material is not available or the previous activities have not yet been finished. As a result, the short term production planning is changing quite often.
2.1.2.7 Bindery department
[image:16.595.74.265.140.381.2]One of the last steps to produce a book is binding the book block and the cover. First, the gauze is attached to the book, the book is then sawed, the three sides (all except the spine) are cut off, the ribbon markers are attached and glued to the spine of the book, the head- and tail band is applied, the book block and the cover are combined and finally the book is squeezed, stacked and visually inspected. In essence, this is an overview what the bindery department does. First, we discuss the current situation, continue with the information flow and finish with the role of the production planning.
Figure 10: Machine for rounding spines
Figure 11: Machine for rounding covers
11
Current situation
The bindery department features two binding lines. Both contain a set of production steps, such as cutting or adding gauze. These steps can be used separately or sequentially, which gives Jongbloed a high flexibility to mix-and-match the different production orders on to the binding lines. However, this also gives a lot of options to plan the production orders onto the two binding lines.
Information
As for all the other departments, the bindery department is highly relying on the production planning. Again, communication is also an important source of information.
Role of the production planning
The bindery department requires a lot of materials, such as ribbon markers, head- and tail bands, cover and book blocks. Therefore, missing material can have a large impact on the production schedule of this department. ‘Rush’ orders can have the same effect. The binding lines than need to be setup twice, one time for the rush order and another time to pick up the previous job. So, as for all the other departments the production planning is also vital for the bindery department.
2.1.2.8 Expedition
The expedition department is necessary at least one time in the production of a book, namely when the shipment is being prepared (wrap the books in plastic, print a bill of lading and schedule a collection for the shipment). Besides sending a shipment to the final customer, it is also possible that an outsourcer needs to perform a certain activity. The expedition department than also ships the batch to the outsourcer and after the activity has been performed they receive the shipment again. We first discuss the current situation, continue with the information flows and finish with the role of the production planning.
Current situation
The expedition department for the graphic business unit is only a few months old. This department is not only responsible for receiving and sending shipments, but is also accountable for storing and retrieving pallets in a storage facility and transporting batches between departments.
Information
An important source of information is, as for most of the departments, communication and the production planning.
Role of the production planning
The production planning is basically an importance ranking for all shipments, which are ordered per week. They are however missing a shipping address, which would be convenient for expedition.
2.2
Visualization problems
We just described a lot of different challenges. They are linked together using a causal (cause-result) relationship. This is shown in Figure 14.
12 Planning perceived as wishlist Planning is frequently changed Raw material is not available Varying lead times on material, e.g. cover from China Raw material is ordered too late Global order confirmation Order paper before concrete order Advance project in production planning Customer doesn t know
the exact specifications Limited availability several paper sorts Production difficulties Wrong material delivered Planning tool implementation not suitable Wrong quantity delivered
Takes a lot of effort to update the planning Process (either previous or current) is delayed Only one person at the
time can update the planning Free capacity in printing house department Similar project (in
terms of number of colors, cylinder, folding machine and
paper weight) is already set at printing house department
No signal when planning can not be
met (e.g. no materials or no free
capacity) Wrong quality delivered Personnel not included in planning Specialization Machine breakdown Machine
maintenance No real-time
registration of hours
No registration of received raw
materials Powerful
supplier
Figure 14: Problem diagram
In Figure 14, the green block is the main problem. We now discuss the different problems that require further explanation, starting at the bottom of the figure and finishing at the top.
Only one person at the time can update the planning. Due to the restrictions of both Excel and Windows, editing the planning with more than one person at the time is not possible. Also important is that the person exits the planning file after editing/viewing, otherwise no one else is able to edit the planning.
Takes a lot of effort to update the planning. A modification in the sequence of jobs at one machine does not automatically alter the sequence of jobs at succeeding machines. Therefore, updating the planning takes a lot of effort. Also, adding a new project to the production planning is not an easy job. All production steps need to be added manually, one-by-one. Furthermore, there is no real check to verify the correctness of the sequence of the production steps.
Planning tool implementation not suitable. Excel, which is the planning tool, is capable of coping with simple and stable production planning. However, the implementation of the production planning in Excel is not suitable for a frequently updating production planning.
No signal when planning cannot be met (e.g., no materials or no free capacity). The
planning tool, Excel, does not warn when the production planning cannot be met. It is simply not configured to do so.
13
Planning is frequently changed. This is the main problem. The production planning is frequently updated, to reflect delays in production and the availability of raw materials and semi-finished products.
Process (either previous or current) is delayed. Either or both (current or previous) processes cannot be executed, and therefore the process is delayed.
Production difficulties. This can range from a low throughput rate, high setup times to maintenance and machine breakdowns. These difficulties leads to a delay of the current and/or previous process.
Specialization. Jongbloed is one of the few companies in the world that can print on light and thin paper. However, it is quite complex to do so, and processing the thin material sometimes results in low throughput times, failures and high setup times.
Machine breakdown. The same reasoning applies as for machine breakdown. A breakdown of a machine directly affects the production planning. The machine is simply unable to produce.
Personnel not included in planning. Currently, the planning only takes into account the machines. Personnel to operate the machines is assumed to be infinite, they are not included in the production planning. One exception is the luxury department, where the number of employees determine the capacity of this department.
Varying lead times on material, i.e. cover from China. The soft covers that are produced in China is just an example, but lead times on a lot of raw materials tend to vary.
‘Global’ order confirmation. The order confirmation does not the specific materials. They are specified in a later stage.
Advance project in production planning. A project is advanced in the production planning, when the project meets one or two of the following requirements:
o Free capacity in printing house department. Another project is not ready to start (for example the paper or plates are not ready yet), or there is simply a gap in the planning. The presses in the printing house department are the bottleneck of the factory and therefore its capacity is fully utilized.
o Similar project (in terms of number of colours, cylinder, folding machine and paper weight) is already set-up at printing house department. Therefore, another project can follow up this project with almost no setup times.
Order paper before concrete order.
o Limited availability several paper sorts. Not all paper can be bought off the shelf at the supplier. There are some special paper sorts that need to be ordered in advance, without an order for the paper. The ‘normal’ process of selling books is than the other way around, Jongbloed is trying to find a customer for this paper. Normally, a customer comes to Jongbloed with an idea in mind for a new book. Now, they do not yet have this idea and therefore the order confirmation is quite ‘global’.
o Powerful supplier. Jongbloed only represents a small part of the supplier’s revenue. Therefore, they are not that important to them.
Customer doesn’t know the exact specifications. This problem can be seen as a plain service to Jongbloed’s customers. They do not yet have to know all specifications for a new book, this can be decided later on.
2.3
Desired situation
14 and the actual situation is that what should be changed. The desired situation has the following characteristics:
1. Possibility to request the estimated due date for a quotation. The planning tool should take the current production planning and the lead times of raw materials into account, such that the planning tool gives an accurate estimate of the expected delivery date.
2. Feedback on the production processes. If a certain process is ahead/behind schedule, this delay should be known. This notification has two results, as we could increase/decrease the capacity of a machine by adding or subtracting employees to keep up with the pace of the production planning and Jongbloed can report the lead/delay to the customer.
3. The production planning should be perceived as a tool that supports their daily activities, provides clarity concerning the sequence of the projects and the presence of the required materials, both raw materials and semi-finished products.
4. The production planning facilitates in narrowing the gap between the estimated production costs and the actual production costs. This helps to state a realistic price to Jongbloed’s customers.
2.4
Difference between the current and the desired situation
The difference between the current and the desired situation is a gap that needs to be closed, in order to attain the desired situation. We use the four characteristics of the desired situation to explain the difference between the desired and the actual situation.
1. A feature of the production planning should be that it is possible to put a potential order in the production planning, which takes into account the current schedule and the lead times on raw materials.
2. There should be (real time) feedback from the production floor, in order to keep track on the production processes.
3. The production planning should be fixed on the short term (say one week), so everyone feels that the production planning is not merely a wish list instead of a production planning. 4. An accurate production planning, which includes accurate processing and setup times, can
facilitate closing the gap between the estimated production costs and the true production costs.
2.5
Conclusions
15
3
Problem analysis
This chapter can be considered as the body of this report. An extensive analysis is useful and structures the upcoming chapters. We first discuss several indicators that make the problem
measurable and then investigate the second sub research question: “How is the Jongbloed’s current production planning performing?”
3.1
Indicators
Indicators are meant to make the problem measurable. They can be used to quantitatively express the current situation and future situation, so the effects can be measured. We believe that the following indicators express the described problem:
Lead time of the products, which is the sum of the production- and the waiting time. It reflects the uncertainty in the production planning. For example, if raw material is not available this most likely increases the waiting time of the project.
Workload per department per bucket of time.
3.2
Jongbloed’s current production planning
Here, we briefly describe the eight steps of the research cycle to research Jongbloed’s current production planning.
3.2.1
Research goal
We research the effects of Jongbloed’s current production planning. The previous chapter contains a cause effect diagram of all observed problems. However, this is a purely qualitative analysis. We would like to add quantitative information to this diagram, using the research cycle.
3.2.2
Problem statement
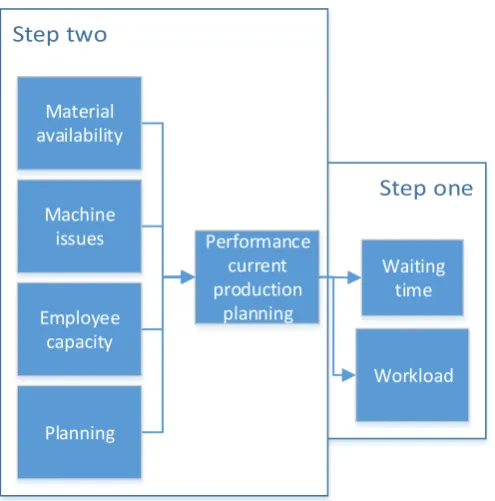
16 Material
availability
Machine issues
Employee capacity
Planning
Waiting time Performance
current production
planning
[image:22.595.76.324.70.321.2]Workload
Figure 15: Approach in research cycle
Figure 15 also shows the structure of the problem. There is a direct relation between the performance of the current production planning and both waiting time and workload. A low
performance of the production planning automatically results in a higher waiting time. Here, waiting time is defined as the time that the product is not being processed. Workload is defined as the total number of hours that is worked at a department per bucket of time, which could be either in days, weeks or months.
3.2.3
Research questions
Here, we discuss the research questions that this research cycle is going to answer. They are exactly the same as the questions that are stated in chapter one. They are as follows:
1. What is the average waiting time, as a percentage of the average lead time?
2. What is the estimated distribution of the four categories, which are material availability, machine issues, employee capacity and planning, which cause the waiting time?
3. What failures occur at the two printing presses? 4. What is the workload per week per department?
Each of these research questions has its own section, where we research and answer each research question.
3.2.4
Research design
17
3.2.5
Operationalization
All relevant variables are already explicit, however the four uncertainty categories and the term workload needs some further explanation. Here is a small description of the four categories and the term workload.
Material availability. The availability of material, for whatever reason. The wrong quantity, quality or material results in that a process cannot start. This affects the production
planning.
Machine issues. When machines do not function properly, they do not produce the desired output, have increased set-up times or do not work at all. There are several reasons for this behaviour such as difficult to handle material, breakdowns or maintenance.
Employee capacity. Planning is not only about machines, employees also need to be taken into account. They need to operate the machines, and therefore determine the capacity of the machines.
Planning. There is a large variety of planning possibilities. The appropriate variety depends on the performance indicator that we would like to maximize/minimize and the production process itself. A simple production process demands a complete different way of planning, compared to a complex and variable production process.
Workload. Another result of uncertainty, besides the waiting time, is workload. A high degree of uncertainty leads to a variable workload, whereas a low degree of uncertainty leads to a stable workload.
3.2.6
Measurement
There are actually two ways to retrieve the data. One way is by using the overall equipment effectiveness of each machine and using this in combination with the expected number of orders and the expected setup- and throughput times per machine to find the expected waiting time per project and the workload per department. However, not all machines keep track of their overall equipment effectiveness. Also, the level of detail is often not specific enough. However, there is a second way to find the waiting time per project and the workload per department per bucket of time. Jongbloed’s Enterprise Resource Planning (ERP) system is a rich source of information. Time for each process is recorded, which can be used to compute the expected waiting time using the start- and end date/time. This same information can also be the basis to calculate the workload per bucket of time per department.
3.2.7
Processing of data
As discussed earlier, there is a lot of data available. Getting the necessary and correct data took us quite some time. If we did not succeed to get the necessary data, we were unable to draw
conclusions. We used two sources of information, namely a new business intelligence (BI) tool and the overall equipment effectiveness of several machines. The BI tool extracts data from Jongbloed’s ERP System and exports it to pivot table in Excel, such that the data can be analysed. As discussed earlier, this research cycle is done in two steps.
3.2.7.1 What is the production waiting time, as a percentage of the average lead time? We made one analysis to answer the research question stated above. At Jongbloed, a project consists of multiple production orders. Currently, there are four types of production orders namely the GK (pre-press and printing)-, BB (book block manufacturing)-, BD (manufacturing of covers) - and BK (binding of the book block and the cover) production order. Depending on the number of
18 corresponding production orders gives an edition of a book. At Jongbloed, one project can (and often does) contain multiple editions. Figure 16 shows the analysis.
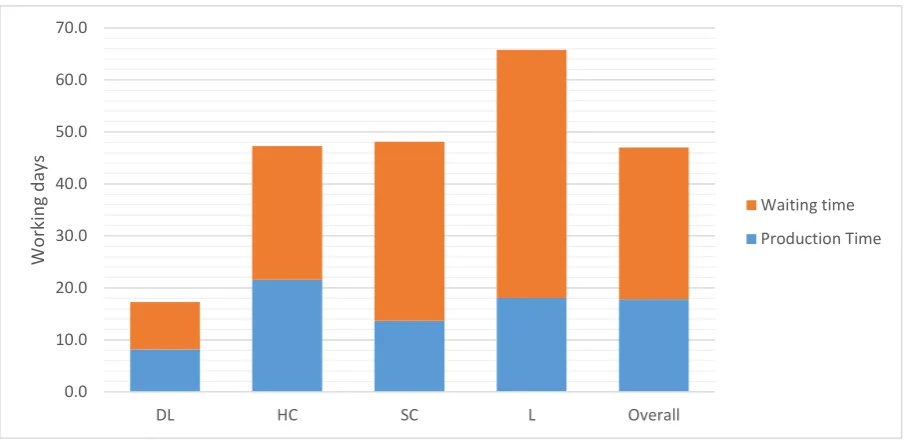
Figure 16: Production- and waiting time in working days of editions in 2012, given based on revenue
In Figure 16, DL stands for Dwarsligger, HC for hard cover, SC for soft cover, L for luxurious products and Overall for all editions. The allocation of the different projects to calculate the score and lead time is based on revenue. First, the allocation was only based on the order quantity. However, this ignores the value and importance of luxurious books. Therefore, we now use revenue to calculate the score.
Both graphs show that the Dwarsligger has a relative small lead time and luxurious products have a longer lead time. The graph is counter intuitive, as luxurious products have a smaller amount of production time compared to hardcover products. This is due to the fact that the edition quantity of hard covers are simply greater than the edition quantity of luxurious products. The total amount of work is larger for hard covers compared to luxurious products. We would like to mention that both figures use a project point-of-view. This view is completely different from a machine point-of-view, as this view looks at passing projects.
While doing the analysis, we made the following assumptions:
Waiting time is defined as lead time, subtracted by the production time. However, the lead time is rounded up to days. Therefore, the true ratio between the waiting time and the production time is likely to include a higher share of production time.
We do not take sending a project in different shipments into account. Lead time is defined as the first activity till the last shipment. Different shipments are common in the BK production order, as this often is the last part of the production process. Again, the true ratio between the waiting time and the production time is likely to include a higher share of production time.
The answer to the first research question, which is ‘What is the average waiting time, as a
percentage of the average lead time?’ is 62.1 percent. We use revenue as a scale, which means that we think that projects with more revenue are more important compared to other projects with lower revenue.
0.0 10.0 20.0 30.0 40.0 50.0 60.0 70.0
DL HC SC L Overall
Wo
rk
in
g d
ay
s
Waiting time
19 3.2.7.2 What is the estimated distribution of the four categories, which are material availability,
machine issues, employee capacity and planning, which cause the waiting time? This question is actually about explaining the waiting time, found in the first research question. However, we can only partly explain the waiting time as not all causes are logged. Figure 17 visualizes the logged causes, which is based on the overall equipment effectiveness (OEE) of several machines.
Figure 17: Retrievable causes waiting time in 2012
On the x-axis in Figure 17, the different machines that log the OEE are shown. On the y-axis, the total amount of hours is shown. These are grouped in several groups, which are shown on the right side of the figure. Machine failure is a common cause, especially at the two printing presses in the printing house. Material is another cause, which is defined as the time that the machine has to wait before the machine can start producing. Reasons can be the quality or quantity of material. The third group is the personnel cause, which can be ill personnel, personnel that is working on another machine or a shift is dropped. These three reasons combined is the cause personnel. The fourth and final group is ‘planning – cannot be influenced’. This is the amount of time that an order is advanced, due to the fact that one of the two printing presses (the so-called Timson 3) uses exchangeable cylinders and folding machines. The changeover times are huge, up to 24 hours for a cylinder exchange. Therefore, projects that use the same cylinder and folding machine are clustered. Therefore, means that we cannot put the order on the press at the desired time. We approximated the expected time using the data of 2012. The other printing press, the Timson 2, has a fixed cylinder and folding machine. Therefore, the Timson 2 only has ‘normal’ waiting time and not ‘forced’ waiting time. While making the above graph, we assumed that the machines that log the OEE are representative for all
machines.
3.2.7.3 What failures occur at the two printing presses?
The previous section shows that failure at the two printing presses has a large impact on the waiting time for projects. Therefore, we would like to investigate the different types of failure. For instance, what are common failures at the printing presses? We first look at Timson 2 and continue with Timson 3. Timson 2 is the older printing press of the two, with a fixed cylinder and folding machine. Timson 2 uses heat to dry ink. Timson 3 is a bit more modern, it has an exchangeable cylinder and folding machines, so this printing press is able to print a wide range of books.
Timson 2
We would like to have an overview of all the different types of failure. Furthermore, we would like to know whether the total amount of failure increased or decreased over the last few years. All this is shown in Figure 18.
0 200 400 600 800 1000
H
o
u
rs
Retrievable causes - 2012
Machine - failure
Material
Personnel
20
Figure 18: Failure as a percentage of total available time - Timson 2
Figure 18 shows the total amount of failure, as a percentage of the total available time. Further, the amount of failure as percentage of the total available time increased over the last three years. Especially the new category called ‘Failure bundle machine’ is responsible for a significant share of the total failure time. Furthermore, the percentage of failure doubled between 2010 and 2012. However, the order portfolio has changed between 2010 and 2012. Thus, the comparison above in not completely fair. Order quantities have dropped and the number of orders have increased, which means more setups. We now have an overview of the complete problem and would like to know whether the production rate increased at the same pace as increase in failure. This is shown in Figure 19.
0.0% 2.0% 4.0% 6.0% 8.0% 10.0% 12.0% 14.0% 16.0% 18.0%
2010 2011 2012
Failure bundle machine Track fracture Miscellaneous failure
Failure second stroke Failure damping system Failure first stroke
Failure ink Failure dryer Failure collecting cylinder
Failure strap fracture Failure contlweb Accumulation paper
Failure release cylinder Failure cutting cylinder Failure wellen
21
Figure 19: Total amount of failure compared to the production rate per hour - Timson 2
Figure 19 tells us whether the production rate increased at the same rate as the total amount of failure. We can easily see that this is not the case. There is a modest increase in the production rate, whereas the total amount of failure shows a huge growth. A method to quantify a relation between two variables is called a correlation. A correlation is a number between minus one and one, where zero indicates no correlation at all. One indicates that there is a positive correlation, which means that the variables ‘follow’ each other. If one variable increases, the other one mimics this behaviour. A correlation of minus one shows that there is a negative correlation. This means that if one variable increases, the other decreases.
The two variables in the figure above have a correlation of 0.926, which is a positive correlation. This means that our visual analysis is not correct, as this means that there is a link between the total amount of failure and the production rate.
Especially the increase between 2010 and 2011 is remarkable. The figure with the different types of failures shows that is almost solely due to the new bundle machine. Before, all sections were bundled by hand. The bundle machine was installed in the first half of 2011. A bundle machine automates this, which allows the employee at the bundle machine to check the quality or tweak a machine.
Still, we only indirectly compared the throughput rate and the total amount of failure. In Figure 20, we present a new performance indicator which is the total throughput per year, divided by the total hours of failure per year. Intuitively, this performance indicator should be maximized.
0 1000 2000 3000 4000 5000 6000
0 100 200 300 400 500 600 700 800
2010 2011 2012
Pro
d
u
ctio
n
ra
te
in
p
rin
ts
/h
o
u
r
H
o
u
rs
o
f failu
re
Failure compared to production rate - Timson 2
Hours of failure per year
22
Figure 20: Prints / minute failure – Timson 2
Figure 20 shows a great decrease in the number of prints per minute failure. Therefore, the performance of the Timson 2 between 2010 and 2012 sharply declined. We would like to further investigate the decrease in performance. The bundle machine that we just discussed allows Timson 2 to run at a higher production rate. Bundling by hand is limited to a certain production rate, as bundling faster is simply not possible. A bundle machine does not have this issue and is able to run at higher production rate. However, the bundle machine is responsible for a significant amount of failure. Figure 21 shows the relation between the increase in production rate and failure.
Figure 21: Loss by increased total amount of failure compared to the gain by higher production rate between 2010 and 2012
Both parameters are expressed in the number of prints. Figure 21 shows that the increased total amount of failure is not compensated by the gain of a higher production. We could conclude that the bundle machine of the Timson 2 is a bad investment, but that would be a blunt conclusion. The bundle machine has a number of advantages, which cannot be quantatively expressed. One
advantage of a bundle machine is the improved ergonomics for an employee at the bundle machine. Also, he/she is able to perform other activities such as tuning the machine. The bundle machine was bought secondhand and has been programmed specifically for the Timson 2. However, this was not done correctly. One of the two carts was continuously braking, which caused a lot of failure. Two years after installing the bundle machine, this issue was finally fixed. The bundle machine causes a
0 100 200 300 400 500 600
2010 2011 2012
Prin
ts
/m
in
u
te
failu
re
Prints/minute failure- Timson 2
2325067
833457
0 500000 1000000 1500000 2000000 2500000
Loss by increased total amount of failure Gain by higher production rate
P
rin
ts
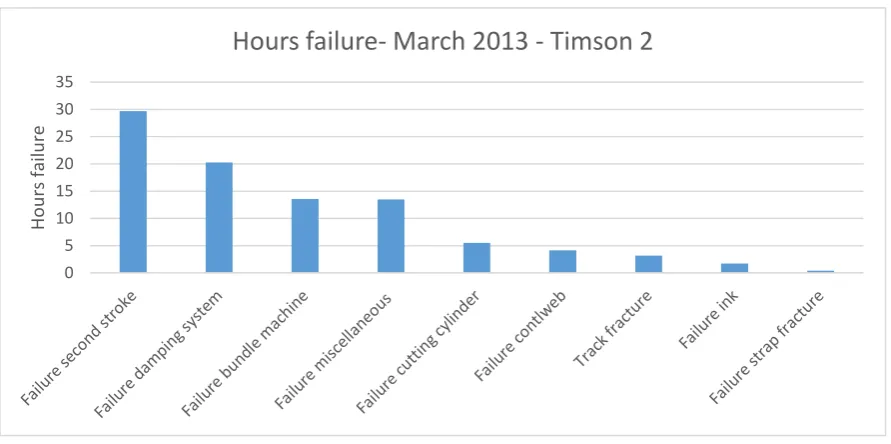
23 tremendous decrease in total amount of hours failure on the bundle machine. To illustrate the decrease, we present Figure 22 which shows the total amount of hours failure in March 2013.
Figure 22: Hours failure - March 2013 - Timson 2
Normally, the category ‘failure bundle machine’ was strictly number one in terms of failure. In March 2013, the total amount of hours failure decreased till 13.6 hours whereas it still accounted for 37.8 hours in January 2013.
We now return to the different causes of failures. We now compare these between 2010 and 2012. We take two pairs containing two consecutive years, namely 2010-2011 and 2011-2012. They are shown in Figure 23.
0 5 10 15 20 25 30 35
H
o
u
rs
failu
re
24
Figure 23: Difference in total amount of hours between two consecutive years – Timson 2
Figure 23 shows the different categories of failure on the x-as. The y-axis is shows the difference between two consecutive years. A positive difference represents an increase, while a negative difference means a decrease in failure.
Timson 3
We just researched Timson 2 and continue with Timson 3, again we first give an overview of the development of failure on Timson 3 over the last three years. They are shown in Figure 24.
-50 0 50 100 150 200 250 300 Fai lu re b u n d le mac h in e Trac k frac tu re Mi sc e llan e o u s fa ilu re Fai lu re s ec o n d s tr o ke Fai lu re d am p in g s ys te m Fai lu re fir st s tr o ke Fai lu re in k Fai lu re d rye r Fai lu re c o lle ct in g c yl in d e r Fai lu re s tr ap f rac tu re Fai lu re c o n tl w e b A cc u mu lati o n p ap er Fai lu re re le as e c yl in d e r Fai lu re c u tt in g c yl in d er Fai lu re w e lle n Fai lu re g en eral Fai lu re p ri n ti n g to w e r Dif fe re n ce in h o u rs p er ye ar
Difference in hours failure between two consecutive
years-Timson 2
Difference 2011-2010 in hours
25
Figure 24: Failure as a percentage of the total available time – Timson 3
The failure behaviour of Timson 3 is similar to Timson 2. However, the total increase in failure is nowhere as large as for the Timson 2. The increase in failure is modest, percentage-wise. We now look at the relation between failure and production rate. This is done in Figure 25.
Figure 25: Total hours failure per year compared to production rate per hour - Timson 3
Figure 25 shows a similar relation as the Timson 2, however the increase in total hours failure is not so steep. We again look at the correlation between failure and production rate. The explanation for the correlation is exactly the same as for the Timson 2. 0.999 is the correlation between the
production rate and failure, this means that there is a nearly perfect correlation. An increase in failure leads to an increase in production and the other way around.
0% 2% 4% 6% 8% 10% 12% 14% 16% 18%
2010 2011 2012
Failu re as p erce n ta ge o f a vaila b le time
Failure - 2010 untill 2012 - Timson 3
Track fracture Failure damping system Miscellaneous failure
Failure second stroke Failure ink Failure bundle machine
Failure dryer Failure first stroke Failure collecting cylinder
Failure release cylinder Failure cutting cylinder Failure strap fracture
Failure contlweb Accumulation paper Failure wellen
Storing protective sheet
0 1000 2000 3000 4000 5000 6000 0 200 400 600 800 1000
2010 2011 2012 Prod
u ctio n ra te in p rin ts /h o u r H o u rs failu re p er ye ar
Hours failure per year compared to the production rate per
hour - Timson 3
Hours failure per year
26 Still, the graph above does not show the performance of Timson 3. Therefore, we use the same performance indicator as we used for the Timson 2. This is shown in Figure 26.
Figure 26: Prints per minute failure – Timson 3
As for the Timson 2, the performance of the Timson 3 is decreasing between 2010 and 2012. Over time, employees are able to let the printing press run at a higher production rate. Does the increase in production rate compensate for the increase in failure? Figure 27 shows that this is not the case.
Figure 27: Loss by increase failure compared to gain in production rate - 2010 till 2012 - Timson 3
We again express the performance indicator in number of prints. However, the gap between the loss in failure and the gain in production rate is much smaller compared to the Timson 2. This means that performance of Timson 3 did not decline as hard as decline of performance did for the Timson 2. We now look at the difference of two consecutive years, between 2010 and 2012. This means that we compare both 2011-2010 and 2012-2011. This is visualized in Figure 28.
0 50 100 150 200 250 300 350 400 450
2010 2011 2012
Prin
ts
/m
in
u
te
failu
re
Prints/minute failure- Timson 3
1353623
823340
0 200000 400000 600000 800000 1000000 1200000 1400000 1600000
Loss by increased total amount of failure Gain by higher production rate
Prin
ts
27
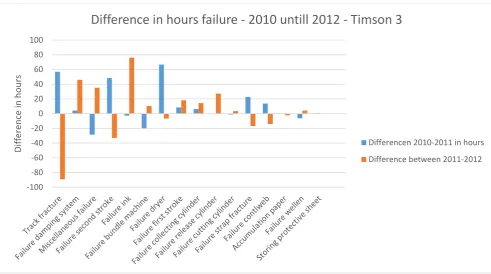
Figure 28: Difference in hours failure for two consecutive years - Timson 3
Timson 3 shows a completely different image, compared to the Timson 2. We use the same definitions as we used for the Timson 2, this means that an increase is positive and decrease in failure is negative. If we for instance look at the failure category ‘second stroke’, this category shows a great increase between 2010-2011 and a great decrease between 2011-2012.
3.2.7.4 What is the workload per week per department?
The previous research question is answered from a machine point-of-view. We analyse this research question using a personnel point-of-view. We look at the number of hours that are spend on the four departments, which are as follows:
8042 – Number of hours spend on book block manufacturing and cover manufacturing
8049 – Number of hours spend in the binding- and luxury department
8056 – Number of hours spend in the pre-press and printing house department. We looked over a period of approximately 14 months, starting in January 2012 and finishing fourteen months later in February 2013. We picked 14 months, as it also shows the tremendous decrease in the numbers of hours per week per department in January and February 2013. An overview of the number of hours spend per week per department is shown in Figure 29.
-100 -80 -60 -40 -20 0 20 40 60 80 100
Dif
fe
re
n
ce
in
h
o
u
rs
Difference in hours failure - 2010 untill 2012 - Timson 3
Differencen 2010-2011 in hours
28
Figure 29: Number of hours per week per category from early 2012 to February 2013
Inspecting Figure 29 shows the follows interesting facts. For instance, in the first half of 2012 there are no registered hours for the pre-press and the printing house department. This is correct, during that period of time all hours were registered using one general code. Furthermore, we see that the fluctuations are enormous during the first half of 2012. In the second half, the spikes are reduced. One reason is that they allowed to dynamically schedule personnel over all departments. Before, employees could only be scheduled within departments. The spikes in 2013 are even smaller, as they try to avoid to use temporary personnel. We would say that the workload is quite stable in 2013, whereas the workload was not stable the year before.