warwick.ac.uk/lib-publications
A Thesis Submitted for the Degree of PhD at the University of Warwick
Permanent WRAP URL:
http://wrap.warwick.ac.uk/110279
Copyright and reuse:
This thesis is made available online and is protected by original copyright.
Please scroll down to view the document itself.
Please refer to the repository record for this item for information to help you to cite it.
Our policy information is available from the repository home page.
TOWARDS THE ON-LINE DEVELOPMENT OF VISUAL
INTERACTIVE SIMULATION MODELS
Stephen John Withers
Submitted in accordance with the regulations concerning
admission to the degree of Doctor of Philosophy
University of Warwick
School of Industrial and Business Studies
w m
.
CONTENTS
Page
Visual Interactive Simulation
The History of Visual Interactive Simulation
1
at Warwick 1
Work at Other Institutions 9
The Rolls-Royce Scheduling Demonstrator
12
Conclusion
21
Input Devices
23
Keyboards
23
Other Devices
27
Conclusion
31
• Displays
33
Display Design
34
1
Conclusion
36
1
The Basic Oxygen Steelmaking Simulation
37
1
Steelmaking At Corby
37
1
The Simulation Model 40 1
Conclusion
48
1
Visual Interactive Model Building 50 1
Client-Analyst Communication
54
1
The Experimental Development Of A Prototype System 56 1
Model Logic
Examples Of The Use Of The On-Line Development
71
1
'«*
.
ts ' i*"
0
.
T
■
Further Development of Graphics Facilities 92
Conclusion
Proposals For The Further Development of Visual
93
Interactive Model Building 95
Smalltalk 96
An Interpretive Approach 101
Conclusion 108
Conclusions 109
References 112
Bibliography 122
Appendices
1 RollsRoyce Scheduling Demonstrator
-s
User Manual 130
2 Programs Used For Speech Input
3 Skeletal Program For Use With The On-Line
144
Development System
4 A Description Of The Software Used To
147
Define A New Entity Type
5 Listing Of The Software Described In
149
ILLUSTRATIONS
Photographs
1. Main display of Rolls-Royce model 14
2. Graph of Priority Function 16
3. The BOSP model in action 44
4. The steelmaking vessels 77
5. The steelmaking vessels, mixer, and oxygen
storage tank 78
6a, 6b, 6c. Drawing a link 80-82
7. The completed display 87
Figures
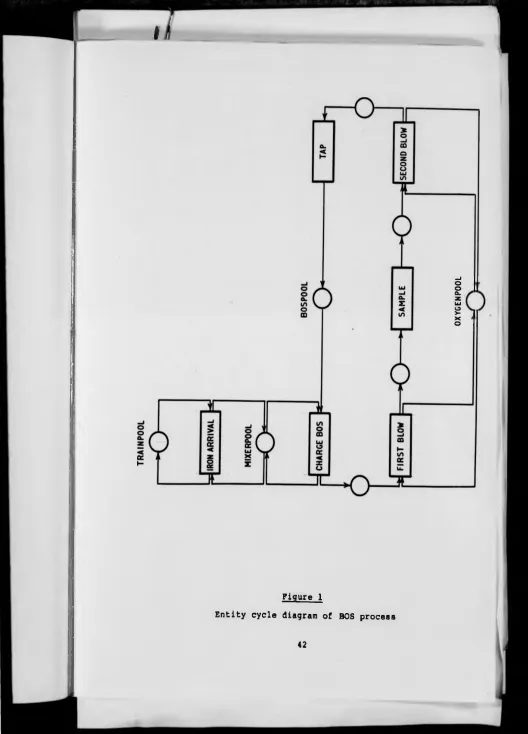
1, Entity cycle diagram of BOS process 42
2. The original design for the main display of
the Rolls-Royce model 59
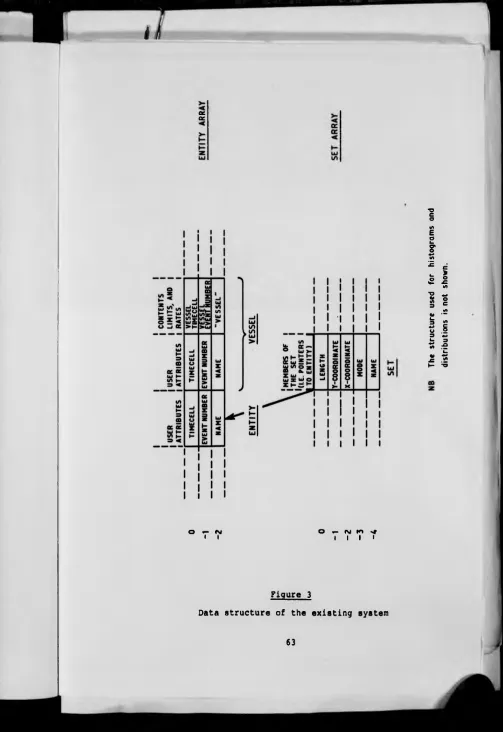
3. Data structure of the existing system 63
4. Data structure used in the extended system 64
ACKNOWLEDGEMENTS
I wish to acknowledge the help and encouragement given
by the following individuals and organisations.
Dr. Robert Hurrion, my supervisor.
My fellow research students: Bill Fisher, Jeremy
Brown, Giles Rubens, and Carlos Moreia da Silva.
Other members of the School of Industrial and Business
Studies, and staff in the University Library, Computer
Unit, and Computer Science Department.
John Hough and Brian Carrier of Rolls-Royce Ltd, Aero
Division, Derby, also Robert Caldwell and John Gibson
of British Steel Corporation, Tubes Division, Corby
for providing the opportunities for industrially based
research.
The Science Research Council (now Science and
Engineering Research Council) for their financial
support.
I.C.I. Corporate Laboratory for the use of their
colour terminal, and constructive comments on an early
version of the development system.
Tandy Corporation (Branch UK) for the loan of the
printer used to produce this document.
SUMMARY
Reviews of previous work on visual interactive simulation, and on the interface between humans and computers were undertaken, the latter considering the physical and psychological aspects of the subject.
Two simulation projects carried out in association with Rolls-Royce Aero Engines and the British Steel Corporation are described in detail.
As a result of these projects and the review of previous studies, a major weakness in the technology of visual interactive simulation was identified: while the visual representation aids validation, verification, and experimentation, no facilities are provided to assist the
analyst in the task of model construction. Simulation
program generators are of proven use for non-interactive models, but a visual model requires a graphically oriented approach.
The main section describes the design and
implementation of a substantial extension to the simulation
software developed at Warwick. This allows the design and
development of displays to be carried out 'on-line', while preserving the one-to-one correspondence between simulation
entities and their visual representation. It is suggested
that this has the potential to significantly reduce the elapsed time taken to develop visual simulation models, while increasing the involvement of the user (or sponsor) in the modelling process, especially when 'pre-defined' entity types are used to minimise the amount of model- specific coding required.
Chapter 1
VISUAL INTERACTIVE SIMULATION
The History of Visual Interactive Simulation at Warwick
In order to set the scene for the current research, a
description of the earlier work at Warwick is necessary.
Hurrion (1976) provided the foundations, describing the
facilities needed in computer software to support discrete
event digital simulation models which would include a
dynamic visual display of the system, and facilities which
allow interaction with the running model. He developed a
system with these features in mind, and used it
successfully in two industrial studies from which he drew
two conclusions which have yet to be contradicted: that
visual interactive simulation promotes the user's
confidence in the model, and that this way of combining the
specific skills of man and machine may produce better
results (e.g. sequencing a number of items through a series
of operations in a shorter time) than either can achieve in
isolation.
Seeker's thesis describes his modification of
Hurrion's software in order to use a new computer and an
alpha-numeric visual display unit (vdu) in place of the
graphics terminal used by Hurrion. When this had been
achieved, he started work on a major study of a dye-stuffs
manufacturing plant owned by I.C.I. The problems were
being experienced in scheduling batches of chemicals
I
constraints, and achieving adequate performance in terms of
plant utilisation and other criteria.
Due to the scale of the project, Seeker was unable to
complete the task. He had made a significant contribution
to the development of the field, as the nature of the plant
and its processes was such that the existing method of
representation (using queues of entities) was not
applicable. Instead, what was effectively a map of the
plant was produced, showing the state of each vessel. This
provided a display which was familiar to those involved in
the operation of the plant (Seeker, 1977).
Responsibility for the completion of the dye-stuffs
model was taken by Rubens (1979). Great care was taken to
protect the integrity of the model and its data structures
from accidental corruption by the user ('bullet-proofing').
This does not imply that users are seen to be stupid (the
term 'idiot-proofing' is sometimes used as a synonym for
bullet-proofing), instead it should be seen as an attempt
to provide the computer with a 'mental set' matching that
of the user. When two people are discussing something,
much of the conversation is implicit, rather than explicit
- "Watch the game last night?", "Sure, Dalgleish's second
goal was amazingl". The second speaker has not only
understood that the questioner was talking about football,
but that the Liverpool match was the one in question.
'Bullet-proofing is also an appropriate term because of its
defensive connotations, in this case against malicious
Bullet-proofing was achieved by providing model-
specific interactions which check the validity of all
values entered by the user. These interactions did not
completely replace the low-level interactions which work on
the data structures, as they are very powerful tools in the
hands of a person familiar with the model structure,
especially during the process of verification and
validation. The other important feature of these model-
specific interactions is that they are designed to speak
the user's language. Rubens gives as an example the
procedure employed when the user wants to add a campaign (a
unit of production) to the head of the queue for a certain
reaction area. Throughout the dialogue, the model refers
to 'campaigns' and 'reaction areas', instead of
abstractions like 'entities' and 'sets'. Another aspect of
this problem is that different types of specialists use the
same word with different meaning: "the word 'Batch' to
plant staff means a part of a campaign whereas to a
computer specialist it may imply an alternative to
interactive computing" (page 49).
Considerable time and effort was spent on refining the
displays originally designed by Seeker. The first task was
to allow the use of an ISC Intercolor terminal to permit
the colour coding of certain display features, and to
provide graphics facilities.
In order to fill the need for more detailed
information about certain critical stages of production a
information was presented in two different ways - time
series graphs (to show the utilisation of certain pieces of
plant), and bar charts (e.g. the display of the status of
the whole plant).
Two of Rubens' conclusions are relevant to the current
author's research. The first is the importance of the
separation of display generation from the underlying model.
This allows changes to be made to the displays without
affecting the validity of the model. The other is that the
usefulness of the model was largely due to the close fit
between the displays and the manager's mental image of the
plant.
By the time Rubens became involved with I.C.I., the
company was sufficiently convinced of the potential
benefits of visual interactive simulation to instigate a
further study. Fisher's (1981) work describes an
investigation of the feasibility of using the techniques to
model a continuous process plant, using the 'Acids and
Primaries' plant as a guinea pig. As in the dye-stuffs
project, the goal was a model which could be used as a day-
to-day on-line decision aid.
The existing simulation software could only be used
for discrete models, so a major addition was required to
handle the continuous nature of the new problem. This was
achieved by implementing a new type of entityi the vessel.
I
aware of this fact. The first entity is the one defined in
the program, and it may be freely used by the designer:
events may be scheduled for it, and its attributes may take
any reasonable value. The second entity is invisible to
the programmer as the system uses it to record the vessel's
contents and the rates of flow into and out of it.
Whenever a vessel attribute is changed, the system
recalculates the time at which the contents will reach one
of four levels: the maximum or minimum capacity, or the
upper or lower warning level. The underlying assumption is
that the relationship between time and flow is linear.
Provision for differential equations would make the system
more generally applicable, but the need has not arisen for
this additional complexity.
Fisher discusses the practical problems of display
design, stressing the importance of involving the potential
user in the process, and of designing for a person, rather
than people in general. He also finds these points
relevant when developing the dialogues provided to allow
users to control the model. In the broader context he sees
a need for a change of "emphasis from interactive
programming to the tools needed to develop interactive
programs" (page 131).
Contemporary with Rubens' and the early stages of
Fisher'8 work, Brown (1978) was continuing the development
of the system software for use in the original area of
discrete manufacturing applications.
I
The first of three projects with Rolls-Royce Aero
Division was the construction of a visual interactive
simulation model of a foundry. A batch simulation model
had already been constructed by the company's O.R. group,
permitting the objective of determining the usefulness of
visual modelling to line managers, without the pressures
imposed by a brand new study. At the first demonstration
the Foundry Manager immediately recognised the layout of
the main display as a representation of the foundry, even
though line managers were not involved in the design of the
displays.
Several important points were noted during the
demonstration. Problems due to the remote access of the
University computer via telephone lines caused some
scepticism - the appearance of spurious characters (due to
noise on the line) worked to reduce confidence in the
model. The jerkiness of operation caused by the time
sharing system also contributed to this. The slow line
speed (300 Baud, or 30 characters per second) meant that a
complicated display could take 30 seconds or more to appear
on the screen; this soon became tedious.
On the positive side, the dynamic nature of visual
simulation allowed the managers to question certain points
about the model of which they had not been aware in the
batch model, and the ability to experiment with different
operating strategies and see their effects very quickly was
After this project a considerable effort was made to
rationalise and develop the simulation software in order to
ease the task of model development and to increase the
general applicability of the system. This was achieved by
providing higher-level procedures, and by adding scheduling
and time-advance routines. Further extensions were made on
an ad hoc basis.
The next study came about as O.R. staff had been
unable to give a satisfactory explanation to a manager for
the effects of different priority rules on the performance
of a manufacturing shop. Although they understood the
processes involved, they were unable to communicate this
knowledge to the manager. A simple model was designed,
with one man operating any one of six machines. Each batch
of the anonymous product had to be processed on each mach
ine in a fixed sequence. Two operating rules were used,
"select the batch that has the fewest operations
remaining", and "select the batch that has the most
operations remaining". The results of an existing (but not
precisely comparable) simulation suggested that the former
would give superior performance. The simplicity of the
model provided an ideal opportunity to test the new version
of the system software.
Use of the model to compare the rules showed that (as
expected by those who had experience of the batch
simulation) selection of the batch with fewest operations
remaining resulted in a significant reduction in work in
progress, and the steady state was reached more quickly.
When the manager concerned saw the model in action "he was
able to understand what had previously been beyond his
comprehension" (page 83), showing the potential of visual
interactive simulation as a teaching aid, particularly when
the outcome of a course of action is counter-intuitive (see
also Forrester, 1969, page 109).
A different set of problems were posed by the subject
of the final study. Its objective was to investigate the
workings of a scheduling mechanism proposed for use in the
production of spare parts. Parts are produced in three
stages: detail, sub-assembly, and assembly.
The distinctive nature of the project resulted from
two sources: the 'users' were O.R. analysts, rather than
managers, and the level of abstraction meant there was no
obvious visual representation of the system.
Histograms and time-series graphs were also used to
present summary information, with the dynamics of the model
shown in tabular form, the figures being updated as time
passes. Once the model had been validated, the dynamic
display became less relevant. Since display forming was so
time consuming, a 'fast forward' mode of operation was
developed which switched off all displays for a user-
specified period. This mode of working, combined with the
dump and restart facility (users may save the state of a
model, usually at a decision point, and later return to
different rules, investigating the cause of any surprises
by reverting to the normal display mode. Thus the benefit
to the users resulted from the interactive, rather than the
visual nature of the simulation.
The study was successful in that the fact that the
users were analysts instead of managers did not detract
from the usefulness of visual interactive simulation, and
that an abstract system had been successfully modelled
using this technique.
Work at Other Instititions
Work which may be classified under the heading visual
interactive simulation has been carried out at places apart
from the University of Warwick. Palme (1977) describes a
set of extensions to Simula which give that language the
facilities needed to allow interaction with a running
model, and to show a visual representation of the model.
Recent releases of the simulation programming language ECSL
(Extended Control and Simulation Language) are also
equipped to dynamically display the model's state
(Clementson, 1980).
Some specific models (as opposed to the programming
systems described in the last paragraph) have appeared in
the literature. Bazjanac (1976) describes a model used to
investigate the evacuation of a building's occupants by
elevator (conventional wisdom insists that lifts should
I
t
showed that evacuation is completed faster and without
additional risk to life and limb if lifts are used).
A very interesting system has been reported by
Whitefield, et al (1980). This is an interactive aid for
air traffic controllers which includes a simulation model
capable of predicting the future state of the airspace
based on flight plans and aircraft performance, allowing
controllers to see the effects of different plans before
making a decision. The system has also been used to
explore the possibility of controllers working in pairs,
each handling a different part of the overall task, and
communicating directly and through the shared database.
Dynamic Interactive System Simulation (DISS) is the
name given by Spearman to a type of simulation modelling
which combines aspects of systems simulation (i.e. what
operational researchers generally mean by 'simulation') and
of dynamic simulation (implying life-like models, such as
flight simulators). The description given (Spearman, 1980)
makes it clear that DISS is synonymous with visual
interactive simulation. Indeed, many of the features of
his implemented system parallel ideas developed at Warwick:
"A rose by any other name..."
There has also been interest in the implementation of
visual interactive models on microcomputers. Apart from
Seeker (1979) and Hurrion (1980), a number of models of
this type have been successfully developed at Lancaster
and Spearman has implemented his DISPAC (Dynamic
Interactive Simulation PACkage) on a TRS-80. A micro
computer implementation of ECSL running under the CP/M
operating system is now available.
This chapter provides an overview of the work carried
out at Warwick and other institutions to provide discrete
event digital simulation with two complementary features.
The first is dynamic displays which show the state of a
model. Having given the user a window into what is
otherwise a 'black box', the systems also provide the
ability to control the model as it runs, possibly
overriding programmed operating rules or exploring the
effects of different algorithms.
The spares scheduling model developed by Brown was
used as a basis for further investigation. This work was
carried out by the present author, and is described in
Chapter 2.
Chapter 2
THE ROLLS-ROYCE SCHEDULING DEMONSTRATOR
The O.R. staff at Rolls-Royce Aero Division had become
interested in visual interactive simulation as a result of
Hurrion's work. Contact was established and a research
student from Warwick carried out three modelling projects
with the company (summarised in Chapter 1 of this thesis).
The major conclusions drawn by Brown from his work on a
stock control problem were that visual interactive
simulation was a viable technique for investigating
abstract systems (i.e. those with no obvious visual
representation), and that it was a suitable tool when the
end-users are analysts, rather than managers (Brown, 1978).
The present author became involved as the Rolls-Royce
analysts believed that a model of this type could be used
as a training aid, as it could show the effects of
different production and ordering schedules on stock levels
and on the ability to meet demand for the product. The
stability of these schedules is also important, as the
disruption of existing plans may lead to considerable ill-
feeling on the part of suppliers and production staff.
Such a model was constructed. Known as the scheduling
demonstrator, or simply the demonstrator, it is a two stage
system. Raw materials are purchased from outside, and made
into a finished product. The demand for the product is
I
used may be rectangular, poisson, or gamma, and the type of
distribution used, as well as its parameters may be altered
while the model is in use.
As suggested above, the user's task is to enter
schedules for orders and production. This is done each
a.p., and there are three ways of doing so. The existing
schedule may be carried over (i.e. no changes to the plan),
a completely new schedule may be entered, or the program
will produce a 'recommended' schedule based on the state of
the system.
An example of the main display generated by the model
is shown in Photograph 1. This provides the user with
details of the current schedules, forecasts of demand,
stocks, work in progress and other information. Histograms
and timeseries graphs are used to indicate various measures
of performance, including such things as unsatisfied demand
for the product, and the number of changes to the schedules
(broken down by the amount of notice given).
The amount of work needed to complete a batch of work
in progress or stock on order is expressed as the leadtime.
Each operation represents one day's work. The number of
operations performed in an a.p. on each batch is variable,
and depends on the batch's priority rating. This priority
rating is in terms of expected lateness - the difference
between expected time to the completion of the batch and
the time the schedule calls for its completion. Thus a job
which is behind schedule will have a high priority rating,
which is intuitively correct. Having calculated this
rating, the model determines the amount of work to be
carried out on the batch by applying a simple function.
Between upper and lower limits there is a linear
relationship between the rating and the number of
operations completed. If the rating falls outside the
range, it is treated as if it was equal to the appropriate
limit (Photograph 2 illustrates the shape of the function).
The values of the limits and the equivalent number of
operations may be changed by the user.
'Forecasts of demand' were mentioned in an earlier
paragraph. These are calculated from a weighted average of
the previous forecast and the actual demand. As with other
parameters the user has the option to explore the effects
of varying the relative weights.
Finally, there is a minimum stock level for both
stages. This is expressed as a multiple of the current
forcast for the stage, and affects the size of the batches
that will be started or ordered. The minimum stock level,
the forecast demand, and the size of batches already in
progress/on order and the leadtime together determine the
batch size.
One model-specific interaction was added to those
written by Brown. This was called OMANUA and when used at
the start of a run allows the user to override the default
settings of all the parameters of the model.
The user documentation for the model may be found in
ti
fy 3 3Photograph 2
Graph of priority function
16
iiifc
=
e
Photograph 2
Graph of priority function
PR
IO
RI
TY
(
The model was demonstrated to the manager whose
subordinates were responsible for scheduling. Despite the
fact that telephone line noise repeatedly disconnected the
terminal from the computer he agreed that it showed clearly
the nature of the problem, and that it could provide a
useful training aid.
One of the advantages of visual interactive simulation
is that it increases the client's involvement with the
model (Bowen, et al, 1979b). This may be promoted by
making the the use of the model as straightforward and
uncomplicated as possible. A particular problem is raised
by the common practice of using typewriter style keyboards
for communication with the model. In common with many
others, the potential users of the model were not
accustomed to keyboards, so it was decided to investigate
the use of the spoken word to control the model.
A commercial speech recognition device was purchased,
the Heuristics SpeechLab Model 20A. This is a low cost
device (around £150), which plugs into an Apple II micro
computer, and is capable of matching sounds against a
maximum of 32 previously defined patterns. In practice,
more reliable results are obtained by using two or three
samples of each word, although this reduces the number of
available commands.
This problem may be eased by defining more than one
set of patterns, and loading the pattern appropriate to the
context from a disk file or from an otherwise unused
section of memory. The latter would be noticeably faster
if a machine code program was used to effect the transfer,
but the use of disk files is simpler to program, and would
be required to save the users' 'voice patterns' to avoid
the need to retrain the device each time it was used.
Since the objective was to test the general suitability of
speech input to visual interactive simulation models, it
was decided that the disadvantages of using disk files were
not sufficient to warrant machine coding. In any case,
there would be no great loss of time if it was found to be
necessary at a later stage.
A problem soon arose in that certain commands which
sound quite different to the human ear could not be
resolved by the SpeechLab. As a result the spoken word
"SCREENS" was used in place of the command "REFO".
Two programs were written in order to use the Apple II
as a voice-operated terminal. Listings are given in
Appendix 2. The first task is to train the system to
recognise the user's voice, and to store the 'voice print'
on disk. The available commands are displayed on the
screen one at a time, and the SpeechLab associates the
noise it 'hears* through its microphone with the command
word. There is no requirement for the spoken word and the
command word to be the same, so the problem of
discrimination mentioned above may be circumvented without
the need to change the simulation program.
Before the second program (called VOICETERMINAL) can
be used the Apple II must be connected to the host
I
interface includes firmware which allows it to be used as a
simple terminal. The simulation program is then run from
an ordinary terminal, and the "SCRN" interaction used to
attach the Apple as the subsidiary screen. Once this is
done, it is necessary to re-enter BASIC and run
VOICETERMINAL.
The following commands may then be spoken:
Spoken word Equivalent typed command
RUN RUN
KILL KILL
RECOMMENDED R
OLD 0
NEW N
HIST HIST
SCREENS RE FO
For most purposes these commands suffice, as few people
have difficulty in entering numbers from a keyboard -
probably due to the widespread use of calculators. Numbers
could be spoken, but the hardware used is not sophisticated
enough to permit recognition of "one-hundred-and-thirty-
five" instead of "one" - "three" - "five" - "enter". This
is clumsy and slower than keyboard entry, especially if a
separate numeric keypad is available.
The results of the trials were inconclusive. On one
hand the opportunity to actually tell the computer what to
do was popular, on the other the effort involved in
speaking clearly and consistently was not always rewarded
by reliable recognition. This problem was encountered more
often by people from the south of England, probably due to
their softer vowel sounds (e.g. pronouncing the word "path"
as "par-th", rather than "pah-th").
The advantage of the novelty value of voice input
should not be discounted. One of the strengths of visual
modelling is that it helps to gain the user's interest and
attention, but this must last long enough to reveal the
possible contribution of the underlying model. The risk is
that if the recognition device is not sufficiently
accurate, the overall effect will be to discourage new or
potential users.
The market for voice recognition devices has grown
since the work described here was carried out, and in
common with other manufacturers, Heuristics, Inc. have
continued to develop its products. One of its recent
offerings, the Model 7000 Voice Controller, may be used
with virtually any terminal and is said to give accurate
and reliable recognition of up to 128 commands. Its price
is higher than the Apple II/Model 20A combination, but it
is not as expensive as the high-performance devices
designed for use in military aircraft. Whether or not its
Conclusion
I
The results of the study supported the idea that a
visual interactive simulation model could be a useful
training aid, showing the mechanism within a non-trivial
system which may otherwise be treated as a 'black box'.
As a completely separate exercise, a Systems Dynamics
representation of the model was constructed by the O.R.
department at Rolls-Royce. It was interesting to discover
that the results obtained from similar schedules were in
close agreement despite the differences between the two
approaches.
There were two reasons for considering the question of
input devices. The first is a moral issue: it is the
author's belief that designers of all types of systems
which involve people have a responsibility to make those
systems fit for use by those people, and that human
requirements should not be sacrificed for the sake of
technical convenience. The second point is more hard-
nosed. The considerable amount of time and effort which
goes into the construction of a visual interactive
simulation model will be wasted if the model is not used
(the modeller may gain something from the process, but this
is less likely to solve the perceived problem). One reason
why such a model is never used extensively may be because
it requires more effort on the part of its intended user
than he is prepared to undertake, therefore consideration
of human factors may make the difference between a
project's success or failure. It may happen that the
modeller himself will act as an interface between the model
and its user, in which case the dialogues need not be
problem-oriented, although a healthy working environment is
still important.
The use of speech to control simulation models has
much to commend it, especially in situations where users
are not familiar with keyboards (ease of use and novelty
are particularly significant), but the limitations of
affordable hardware (in terms of marginal cost and the
funds available to the author) worked against the expected
advantages. Given the nature of the dialogues used in this
study, even minor improvements in the technology of voice
recognition are likely to result in a usable speech entry
system, as only isolated words need be processed: it is
not necessary to cope with the complications of continuous
speech.
Keyboards and voice recognition devices are not the
only mechanisms which allow a human to interact with a
I
Chapter 3
INPUT DEVICES
While evaluating the SpeechLab, the broader area of
input devices for interactive computer systems was
investigated, using Umbers' paper as a framework. Although
he is concerned with process control applications, much of
the work reported is appropriate to the interactive
modelling environment (Umbers, 1976).
Keyboards
The results of earlier work at Warwick (e.g. Rubens)
suggested that a normal keyboard was not really suitable as
a main input device when a model is intended for use by
managers, as that combination was found to be both slow and
error prone. An exception was reported by Fisher who found
that a Plant Manager preferred to use a keyboard to the
other available devices. This was because keyed commands
could be 'stacked' (i.e. several commands entered
together), whereas he had to wait for the next set of
options to be displayed before indicating his selection
with the light pen. There is another reason for avoiding
keyboards - a study reported by Dooley (1976) found that
managers have a negative attitude towards typing, and will
therefore resist systems which require keyboarding.
There are two main reasons for asserting the
inferiority of the standard keyboard. The first is that
the layout is intrinsically unsound, from the bio
mechanical point of view. There are two aspects to this
statements the physical arrangement of the keys, and the
allocation of symbols to keys. If the reader holds his or
her hands palm down, with the elbows bent, the suggestion
that keyboards should be made with a section for each hand
will seem reasonable. Similarly it is not unimaginable
that keys should be arranged in arcs, instead of straight
lines, in order to match the curve of the fingertips.
The standard keyboard layout is known as 'QWERTY',
after the first six letters on the top row of alphabetic
characters. This was designed in the 19th century, with
the objective of minimising type-bar clashing, a problem
with the primitive mechanisms. The corollary is that it
makes life more difficult for the operator. Attempts have
been made to redesign the keyboard to suit its users. The
most widely known examples are the Dvorak, and the more
recent Maltron keyboards. The latter also uses an improved
physical key layout. The failure of either to become
established is largely due to the inertia behind QWERTY,
rather than any shortcomings in their design.
Computer terminals are often equipped with a separate
numeric keyboard. Fisher reported that users found this
type of auxilliary keypad a useful adjunct to a light pen
for numeric data entry. Apart from the problems associated
with the use of light pens for this type of input, the
similarity with the familiar pocket calculator probably
played a part. However, some human factors studies suggest
7 8 9
4 5 6
1 2 3
0
is inferior (in terms of accuracy) to a less popular
alternative, the telephone keyboard
1 2 3
4 5 6
7 8 9
0
The work of Conrad and Hull (1968) suggests that the
improvement in accuracy when using the latter is that it
conforms to people's expectations of how numbers should be
arranged.
While adding machines and calculators were commonplace
and push-button telephones rarely encountered, the problem
was less acute, but as the latter become more common, and
the use of the public switched telephone network for data
communications increases, difficulties due to the lack of a
single standard for numeric keyboards may be expected to
increase. However, a recent study (Nakatani and O'Connor,
1980) found that layout had no significant effect on
performance. It is suggested that this is because
calculators and push-button telephones have become
commonplace (at least in the U.S.A).
Nakatani and O'Connor were primarily concerned with
investigating the effects of speech feedback on the touch
keying (i.e. where the operator does not look at the
keyboard) of numeric data. An example of this type of task
is keying a telephone number while reading it from a
directory. They found that speech feedback led to greater
accuracy without loss of speed. In particular they state
that "casual users... stand to benefit substantially from
speech feedback" (page 651). The applicability of these
findings to other keying tasks is uncertain, as the
subjects were shown randomly generated numbers which they
immediately entered. Nakatani and O'Connor express concern
that when numbers are being keyed from memory the feedback
could have an adverse effect on performance by interfering
with the process of recall.
Special purpose keyboards, including some
sophisticated designs, have been used to ease the task of
communicating with a computer. There are two main types -
those whose keys have fixed functions, and those with
dynamically redefinable functions. Umbers cites a paper
which suggests that operators prefer to use special
keyboards rather than a normal typewriter keyboard. An
interesting enhancement is described by Wear and Dorf
(1970). Their approach is to disable those keys which are
invalid in the current context, while illuminating the
valid keys. This arrangement prevents certain types of
errors, and one user described the system as 'more
relaxing'.
Problems arise when a large number of commands are
In general, a cathode ray tube (crt) is used to
display the labels. The simplest arrangement places the
buttons adjacent to the screen, an arrangement used in the
Hewlett-Packard HP300 computer system. More sophisticated
designs use reflections to make the labels appear on the
keytops (e.g. Knowlton, 1975). The disadvantage of this
sophistication is the expense involved, and so work at
Warwick has followed the simpler arrangement (Hurrion and
da Silva, 1981).
Other Devices
The alternatives to keyboards fall into two broad
classes, albeit with a degree of overlap. The first group
consists of devices used to point at items of interest on
the screen, the other provides an analogue of the screen
surface.
Light Pens
Light pens (and the less common light guns which are
simply pens fitted with a pistol grip) are used to point
directly at the screen (a light pen was used in the work
described in Chapter 6). They work by detecting the bright
spot on the screen as the electron beam passes beneath the
pen. The time between this event and the start of the scan
may be interpreted in terms of the position of the pen on
the screen. Some kind of 'averaging' (by means of software
or additional hardware) is generally needed to improve the
stability of the co-ordinates. As might be expected, the
use of a light pen or light gun allows much faster
positioning of a cursor than is possible with the keyboard
(Goodwin, 1975). Another finding of the same study was
that users strongly preferred the light gun to the pen, as
it was more comfortable to hold and 'fire'. Despite this,
light guns are rarely found.
Touch Displays
There are a variety of ways of detecting the presence
of a finger or other pointer on a display screen. One of
the early approaches used electrically conductive cross
wires. When a wire is touched, the change in capacitance
is detected. Such a system is described by Johnson (1967).
The disadvantage of touch-wires is that the number of
sensors areas must be limited, because they obscure the
display screen.
McEwing (1977) describes a 'live' interactive system
which used touch-wires, finding them to be robust, easy to
use, and acceptable to the operators. Another advantage
was that operators made fewer errors than they did using
ordinary keyboards.
A significant improvement in resolution may be obtained
by replacing the wires with beams of infra-red light (Bird,
1977; Ciarcia, 1978; and the 'Touch Terminal' manufactured
by Carroll Inc.). The device described by Bird has a
resolution of 3mm across the whole screen, and by allowing
vernier adjustments, a final resolution of less than 1mm
An alternative approach is used in a range of touch
panels produced by TSD Display Products, Inc. The
technique used is to generate a wave at the boundary
between the panel and the air. Whenever contact is made
with the screen the wave is reflected, and the position of
the contact obtained in a manner similar to radar. The
active area is 8" by 10" on A 15" diagonal screen, with a
maximum resolution of 0.05".
Stammers and Bird (1980) report a study of the use of
touch panels by air traffic controllers. All the subjects
were in favour of touch input, but concern was noted about
the positioning, size, and angle of the screen (the normal
placing of a display screen is likely to cause fatigue when
a touch panel is used). In addition, several controllers
expressed a desire for more positive feedback, and the need
for easy recovery from erroneous input (e.g. an 'ignore
last entry' command).
Analogue Devices
Devices which provide an analogue of the screen
surface include the joystick, tracker ball, 'mouse', and
tablet.
The first three are similar in that they relate the
position of the cursor to that of the control. Joysticks
and tracker balls will be familiar to many people due to
their use in video games, but the 'mouse' is less popular.
It consists of a small block, fitted with a pair of wheels
at right angles to each other. The 'mouse' is used by
moving it across a surface (e.g. the desk top) thus
rotating the wheels which are connected to potentiometers.
The settings of the potentiometers determine the x and y
co-ordinates generated by the device.
An important factor in the use of these three devices
is that the operator does not have to pick them up (as he
does a light pen), and they stay in the position in which
they are left (although some joysticks have self-centering
mechanisms). English, et al (1967) compare the use of
these and other devices, and conclude that "what is
important to fast, efficient display selection is the
particular feel to the user of the thing he grasps and
moves".
The tablet has features in common with both categories
of device, as it combines pointing with the separation of
display and input areas. It is used by pressing a stylus
(or similar instrument) against its surface, which is very
similar to using a pen or pencil. The tablet has been
found to be most useful when entering graphical information
(i.e. sketching), but it seems less suitable for other
types of communication.
Once a particular device has been selected, thought
should be given to the way in which it will be used. The
effect of layout on keyboarding performance has already
been discussed, so it should not be surprising that the
layout of displays used for data entry by pointing can
affect performance. Long, et al (1977) describe an
using three formats: linear
1 2 3 4 5 6 7 8 9 0
matrix (telephone format), and 'cash register'
1 1 1 1
1 1
2 2 2 2 2 2
3 3 3 3 3 3
4 4 4 4 4 4
5 5 5 5 5 5
6 6 6 6 6 6
7 7 7 7 7 7
8 8 8 8 8 8
9 9 9 9 9 9
The device used was a vertically mounted graphics
tablet, so the task was very similar to using a light pen.
They conclude that all three may be used successfully by
naive users, finding no significant difference in accuracy.
With numbers containing 50% of zeros no difference in speed
was found either, but the cash register arrangement was
significantly slower when 10% were zeros.
Although the conclusions of this study are not
prescriptive, they are important because they show that the
arrangement of items on a display used for data entry by
pointing can have an effect on performance.
Conclusion
What lessons may be drawn from the investigation
discussed above? First of all, whatever type of input
otherwise users will not be bothered with it. Second, the
nature of the interaction has a bearing on the suitability
of a particular device (e.g. keying is preferred to speech
when entering numeric data). Finally, there is a growing
body of human factors information which can be utilised to
help users obtain the best performance from the equipment.
A man-machine dialogue involves communication in two
directions: human to computer, and vice versa. As with
input, a variety of devices may be used for computer
output. At present the medium used most frequently is some
kind of visual display, whether on a video screen or 'hard
copy' (i.e. paper or microform). Where other forms of
output are employed, they are generally used to reinforce
some aspect of a display. Indeed, most computer terminals
have a bell or bleeper which may be sounded to attract the
user's attention.
In view of the primacy of visual displays an
Chapter 4
DISPLAYS
I
As with input devices, the published work on displays
may be divided into two main categories: 'hard'
ergonomics, concerned with factors affecting perception and
physical well-being (such as character heights), and the
'softer' area dealing with the cognitive aspects.
The former is neatly encapsulated in 'The VDT Manual'
(Cakir, Hart, and Stewart, 1979), which deals with both
input and output aspects of video terminals. They describe
the physiology of human vision and the factors by which it
may be affected, in terms of the design of the terminal and
the way it is used. The design considerations involve such
factors as the size and design of the characters, the
separation between lines, the luminance and contrast of the
display, and freedom (or otherwise) from reflections in the
screen.
Workplace design is also considered important. Apart
from any legal requirement to provide a safe and healthy
working environment, insufficient attention to working
conditions could result in a potentially useful simulation
model being ignored. It is not unknown for experimental
sessions to last for hours, involving extensive display
watching punctuated with spells of interactive dialogue.
Under inappropriate conditions this may easily lead to
backache, headache, and other types of discomfort. As a
bare minimum, a variable-height seat and an adjustable
I
Chapter 4
DISPLAYS
As with input devices, the published work on displays
may be divided into two main categories: 'hard'
ergonomics, concerned with factors affecting perception and
physical well-being (such as character heights), and the
'softer' area dealing with the cognitive aspects.
The former is neatly encapsulated in 'The VDT Manual'
(Cakir, Hart, and Stewart, 1979), which deals with both
input and output aspects of video terminals. They describe
the physiology of human vision and the factors by which it
may be affected, in terms of the design of the terminal and
the way it is used. The design considerations involve such
factors as the size and design of the characters, the
separation between lines, the luminance and contrast of the
display, and freedom (or otherwise) from reflections in the
screen.
Workplace design is also considered important. Apart
from any legal requirement to provide a safe and healthy
working environment, insufficient attention to working
conditions could result in a potentially useful simulation
model being ignored. It is not unknown for experimental
sessions to last for hours, involving extensive display
watching punctuated with spells of interactive dialogue.
Under inappropriate conditions this may easily lead to
backache, headache, and other types of discomfort. As a
footrest should be provided, with adequate desk space for
working papers, calculators, and other paraphernalia.
Lighting should be arranged to avoid reflections and glare.
Display formats are touched upon - it is suggested
that simplicity and relevance are important in the design
of an uncluttered display, and that displays should be
consistent with each other and with other items (such as
hard-copy documents). Some guidelines to the related area
of coding are also offered: a maximum of two levels of
brightness should be used (it is unlikely that more levels
could be distinguished reliably), inverse video can be a
very effective means of highlighting, blinking should only
be used to draw the operator's attention to a single item,
and colour coding can be a good way to allow the rapid
discrimination between classes of object, although some
eight percent of the male population are said to be colour
blind.
Display Design
Relatively little published work has been found
dealing with the principles of display design, and much of
it is concerned with the fast and accurate identification
of a target item (e.g Shontz, et al, 1971). However, some
general principles are apparent in the literature, in
particular the notion of compatibility. There are two
principal aspects to this, compatibility between displays,
and compatibility with the user's world-view and
Singleton particularly stresses the need to consider the
purpose for which the user needs the displayed information.
The beneficial effects of displays which provide a familiar
representation of the system under study have been noted in
earlier work at Warwick (e.g. Brown, 1978, page 51).
In view of the availability of an ISC colour vdu, and
the positive feedback obtained from existing users of the
device (although problems had arisen when a thick layer of
dust collected on the screen of a terminal used on a shop-
floor, making a particular colour invisible), it was
decided to investigate the literature on the use of colour
in displays. The suggestion that colour displays were
popular with users was echoed by Hopkin (1977), but again,
much of the emphasis was found to be on search and
identification tasks (e.g. Christ, 1975). Poulton and
Edwards (1980) also report an experimental study of colour
coding in a search context, but they cite studies showing
that colour coding is so effective that it can 'overrule'
other coding dimensions (or to quote from the paper, it can
"reduce the effectiveness of independent orthogonal
codes").
For the purposes of visual interactive simulation, the
most important findings seem to be:
that the use of redundant colour coding can increase
accuracy of identification (Christ, 1975), and may
be used to reinforce another coding dimension (e.g.
that colour stereotypes exist (e.g. red means
danger) and may be exploited;
and that despite the incidence of colour-deficiency,
the manipulation of controllable and/or selectable
parameters allows the accomodation of about 98
percent of the male population (DeMars, 1975), with
women being less prone to colour-blindness.
Conclusion
The material covered in this section suggests that
increased user involvement in the design of displays for
visual interactive simulation models may result in displays
which are more satisfactory by virtue of a better fit
between them and the user's mental model of the system, and
because of their consistency with the user's stereotypes.
Attention should also be paid to the working
environment in which the computer terminal is to be used,
otherwise users may suffer physical discomfort, and coding
Chapter 5
There are two parallel streams to this thesis: one is
practical and problem-oriented; the other theoretical.
This chapter describes a second modelling project.
THE BASIC OXYGEN STEEL-MAKING SIMULATION
The problem described in this chapter was of interest
because it stemmed from the inability of two parties to see
the other's point of view. It was hoped that a visual
interactive simulation model of the system would help to
improve communications across planning boundaries, showing
the participants the effects their actions were having on
the other operational area. The project also provided an
opportunity to put into practice the lessons that had been
learned about man-machine interaction.
Steelmaking at Corby
The Basic Oxygen Steel-making Process (BOSP) converts
iron into steel. Described simply, the process involves
charging the steelmaking vessel with molten iron and scrap
metal, and then passing oxygen through the mixture in at
least two phases (or blows). This removes impurities from
the metal, and then it is analysed and any required
adjustments made in order to obtain steel with the desired
properties. A more detailed description may be found in
Doyle (1969, pages 59-60).
At the British Steel Corporation (BSC) works at Corby,
i t
transported the short distance to the steel-making area by
train. On arrival at the BOSP plant iron was put into
storage vessels known as mixers. There were three mixers,
but at any time only two were in use, while the third was
undergoing maintenance. Once the mixers were full there
was no other storage available for molten iron.
Oxygen was produced on site, by a plant owned by BSC
and operated under contract by the British Oxygen
Corporation (BOC). There were two distinct supplies - one
side operating at high pressure (600 p.s.i.), the other at
350 p.s.i. Each supply had its own storage tanks, but were
linked by an interconnecting valve (ICV). This valve was
intended to ensure that both sets of storage tanks became
full at the same time, as the production rates of the two
supplies were independent. This would only work if the
setting of the ICV corresponded to the ratio of the supply
rates, which varied according to the operating requirements
of BOC. To make matters worse, the ICV was both
inaccessible and awkward to adjust, so it was rarely at the
ideal setting.
The total oxygen storage capacity was 11.2 tonnes,
which was approximately the amount required to produce a
batch of steel. The small storage capacity meant that the
rate at which steel could be produced was largely dependent
on the oxygen supply rate. The working rules were that the
tanks must be at least 70% full before a stage 1 blow could
start; stage 2 blows required 401 of capacity. In
I
addition, a BOSP vessel could not be charged with iron
unless the other was idle, or had reached the stage 2 blow.
This was to prevent both vessels requiring oxygen
simultaneously.
Another effect of the small storage capacity was that
the tanks soon became full when little or no oxygen was
being used. Since the contractual minimum supply rate was
approximately 10 tonnes per hour, the tanks would fill in
little more than an hour. When this happened, incoming
oxygen was wasted as it was simply released into the
atmosphere. The problems with the ICV meant that one side
could start venting before the other set of tanks were
completely full.
It was this wastage of oxygen that was the cause for
concern. The objective of the project was to determine a
way of reducing the losses without disrupting the
production of steel. The line management were acutely
aware of the problem, and plant personnel had agreed to
adopt measures to reduce the wastage. The Fuel Controllers
were responsible for wastage, but their decisions about the
oxygen supply rates were based largely on the estimates of
requirements supplied by the BOSP personnel.
These estimates were usually very optimistic (i.e.
they were based on a higher level of production than that
which was likely to occur), since the BOSP personnel
preferred to have plenty of oxygen available to allow for
the possibility of breakdowns and so they could schedule
shifts per day, Monday to Saturday) had a bearing, as the 6
a.m. to 2 p.m. shift on Saturday was a non-blowing shift,
although the production of iron continued. This resulted
in an increase in iron stocks, which caused a higher rate
of production at the beginning of the week.
The Fuel Controllers were aware of the production
workers' ploy, and therefore tried to second-guess the
estimates, but the feedback from the BOSP personnel when
delays occurred due to a lack of oxygen was much more
immediate than that from the process of accounting for
oxygen losses. These behavioural factors added to the
technical problems, and resulted in a high level of
wastage.
The problem only appeared when steel production was
reduced because when working nearer to capacity, production
tends to be smoother, resulting in a stable demand for
oxygen. At the prevailing production rates the demand was
necessarily irregular. Since the storage capacity and the
freedom to alter the supply rates were both limited, the
result was greater losses. This fact was understood, and a
new 'standard' level of losses set above the old one.
The Simulation Model
The model of the BOSP was simplified by combining the
two active mixers into a single entity. This meant that on
occasions an event could be delayed while the mixer was
busy, when in practice the other could be used for the
second operation. The oxygen tanks were combined in a