RESEARCH ARTICLE
APPLICATION OF STATISTICAL TECHNIQUES TO ANALYSE KEEPING QUALITY OF
GHEE CHARACTERISTICS
1
Revathi, G and
2Subramani, J.
1Sri Subramanya College of Engineering and Technology", Palani 624615
2Department of Statistics, Pondicherry University, R.V. Nagar, Kalapet, Puducherry – 605014, India
ARTICLE INFO ABSTRACT
Ghee has quite a long history, as it has been used in Indian cooking for thousands of years and also in religious ceremonies and various healing arts in Indian culture. Additionally, Ghee's nutritional and health benefits are touted as ideal for anyone from athletes to simple dieters. It is necessary for the Indian families to keep the procured ghee for a longer period due to its fluctuation in the price and the availability in the market. It has motivated us to study the behaviour and to improve the keeping quality of ghee characteristics. For fats, in general, significance of carbonyl compounds in the off-flavour produced is well established. The carbonyl compounds are formed by chain reactions which can be checked by the removal of carbonyls by extraction (with water) method. The purpose of this paper is twofold. The first one is to study the impact of the keeping quality of ghee characteristics to preserve the ghee for a longer period and the second purpose is to use the statistical techniques to analyze the data pertaining to various problems in dairy science. As a result we have used several statistical techniques including graphs, tables, t-tests and one way analysis of variance to analyze the data. This study reveals that the removal of the carbonyls extends the shelf-life of ghee by delaying the formation of undesirable flavour by free fatty acids, phospholipids and phenols.
© Copy Right, IJCR, 2011, Academic Journals. All rights reserved
INTRODUCTION
The quality of ghee is assessed based on its flavour and texture. Carbonyls influence the flavour of ghee through the flavour compounds presented in milk and pass to the cream to some extent. The ripening of cream has greater influence because of the metabolic activities of bacteria. The bacterial action and the total carbonyls present immediately on preparation of ghee are the factors influencing keeping quality of ghee. Using suitable types of bacteria for ripening cream and removal of carbonyl by extraction soon after production of ghee may contribute to the keeping quality of ghee. The carbonyl compounds are the major constituents which are responsible for the flavour of ghee. The carbonyls can be removed from ghee by extraction (Vijayender Rao and Ramamurthy, 1984)). The quality of ghee is assessed in terms of flavour, texture and colour and by the physico-chemical characteristics like free fatty acids (FFA), peroxides values etc. The consumer acceptability of the quality of ghee depends generally on flavour and texture. Flavour is a sensory
perception, a combination of taste and aroma which are perceived respectively by the papillae on the tongue and
*Corresponding author: [email protected]
olfactory epithelium in the nose. The flavours in ghee are due to the presence of various flavouring components namely, carbonyls, lactones, free fatty acids (FFA), alcohols, reducing substances etc,. Among them, carbonyls and lactones play an important role in imparting typical ghee flavour. While smaller amounts provide favourable aroma, larger quantities provide off-flavour like tallowy, rancid, fishy, oily etc. The flavour enhancement in ghee obtained from ripened materials is ascribed to the metabolic activity of the starter bacteria on various cream / butter constituents like lactose, citrate and glucose and not to the cell debris. The lower pH produced by the starter activity also helps in increasing the intensity of chemical reactions like caramalization, tallowy during the heat clarification. These reactions are reported to contribute to the flavour components in ghee. The increase in these flavour components to unbalanced proportions leads to off-flavour in ghee. During the storage periods the flavour deterioration was faster in ripened cream ghee because it contains initially more carbonyls than the unripened cream ghee. When ghee is stored at room temperature, the double bonds of the unsaturated fatty acids absorb oxygen resulting in autoxidation with resultant off- flavours. The initial step in the autoxidation of unsaturated fatty acids and their esters is the formation of free radicals. These free radicals react with oxygen and forms peroxide compound. Peroxide free radicals react with another molecule of unsaturated fatty acids to form hydro-peroxide
ISSN:
0975-833X
International Journal of Current Research Vol. 33, Issue, 6, pp.050-054, June, 2011
INTERNATIONAL JOURNAL OF CURRENT RESEARCH
Article History:
Received 13th
April, 2011 Received in revised form
27th
April, 2011
Accepted 5th
May, 2011
Published online 2nd
June 2011
Key words:
and a free radical. These peroxides immediately break up and the resultant products are aldehydes, ketones, low molecular weight acids, oxy acids etc., and this break down products are called carbonyl compounds. The carbonyl compounds are formed continuously by chain reactions which can be checked by the removal of carbonyls by extraction (with water) method. The total weight of volatile carbonyl compound is about 10 times greater in the tallowy and 100 times greater in the painty butter fat than in the fishy flavoured butter fat (Web Thomson Alford 1983)
In recent times, application of statistics find its way into every scientific study in the area of social, physical, chemical, biological, agricultural sciences, engineering, technology and medicine. Statistical tools such as graphs, diagrams, testing of hypothesis, and analysis of variance techniques are very much used by scientists and researchers in their scientific investigations and their research studies. The present study involves the use of above statistical tools for the comparison of the keeping quantities of ghee prepared by using home culture as a) control and b) carbonyl extracted ghee using statistical tools based on the parameters free fatty acids, phospholipids and phenol at five different storage periods
namely initial, 10th, 20th, 30th and 40th day. Home culture is
used for ripening and the carbonyls from the ghee are extracted before storage and the results studied with appropriate control.
MATERIALS AND METHODS
Preparation of ghee: In this method, cream is separated from
the warm (40oC) milk by using a hand operated cream
separator. In the resultant cream, 3% of home culture is added and is allowed to ripen for 18 hrs. After ripening, it is churned to butter by adding small amount of ice-cold water. The final butter is converted into ghee by direct clarification.
Control and Carbonyls extracted: The ghee is classified into
two categories namely Control and Carbonyls extracted. Before extracting the carbonyls the ghee is called as Control. After extracting the carbonyls the ghee is called as Carbonyls extracted.
Removal of Carbonyls by extraction (with water): Ghee
sample and distilled water are taken in a separating funnel, shaken well and allowed to stand. After clear separation, the washed water is taken-off from the funnel. The ghee sample is washed once again with distilled water. Then the ghee sample is stored at room temperature. The ghee sample is free from carbonyls.
[image:2.612.146.472.368.475.2]Estimation of Free fatty acid (FFA): (Narashimhamurthy and Ramamurthy 1982) A known amount of Ghee is weighed accurately and is dissolved in neutral ethyl ether. It is titrated against 0.02N KOH in methanol using phenolphthalein as indicator until the end point of faint red colour persists.
Table 1: Comparison of FFA content between Control and Carbonyls extracted based on their means and their spreads
Day CONTROL CARBONYLS EXTRACTED
Total Mean SD Mean±3SD Total Mean SD Mean±3SD
0th
1.26 0.21 0.0178 0.21±0.0534
(0.1566-0.2634)
1.00 0.17 0.006 0.17±0.018
(0.152-0.188)
10th
1.68 0.28 0.0178 0.28±0.0534
(0.2266-0.3334)
1.25 0.21 0.016 0.21±0.048
(0.162-0.258)
20th
2.24 0.37 0.0200 0.37±0.06
(0.31-0.43)
1.72 0.29 0.016 0.29±0.048
(0.242-0.338)
30th
2.72 0.45 0.0160 0.45±0.048
(0.402-0.498)
2.26 0.38 0.009 0.38±0.027
(0.353-0.407)
40th
3.06 0.51 0.0140 0.051±0.042
(0.468-0.552)
2.73 0.46 0.015 0.46±0.045
[image:2.612.127.492.503.610.2](0.415-0.505)
Table 2: Comparison of Phospholipid content between Control and Carbonyls extracted based on their means and their spreads
Day CONTROL CARBONYLS EXTRACTED
Total Mean SD Mean±3SD Total Mean SD Mean±3SD
0th
1199.73 199.96 5.75 199.96±17.25
(182.71-217.21)
1192.78 198.80 5.78 198.80±17.34
(181.46-216.14)
10th
1176.36 196.06 6.55 196.06±19.65
(176.41-215.71)
1175.02 195.84 6.62 195.84±19.86
(175.90-215.70)
20th
1147.46 191.24 5.89 191.24±17.67
(173.57-208.91)
1142.16 190.36 5.79 190.36±17.37
(172.99-207.73)
30th
1119.21 186.54 6.16 186.54±18.48
(168.06-205.02)
1112.92 185.49 6.12 185.49±18.36
(167.13-203.86)
40th
1095.60 182.60 5.59 182.60±16.77.
(165.83-199.37)
1088.8 181.47 5.73 181.47±17.19
(164.28-198.66)
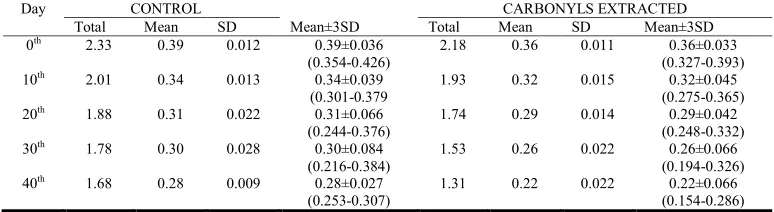
Table 3: Comparison of Phenol content between Control and Carbonyls extracted based on their means and their spreads
Day CONTROL CARBONYLS EXTRACTED
Total Mean SD Mean±3SD Total Mean SD Mean±3SD
0th
2.33 0.39 0.012 0.39±0.036
(0.354-0.426)
2.18 0.36 0.011 0.36±0.033
(0.327-0.393)
10th
2.01 0.34 0.013 0.34±0.039
(0.301-0.379
1.93 0.32 0.015 0.32±0.045
(0.275-0.365)
20th
1.88 0.31 0.022 0.31±0.066
(0.244-0.376)
1.74 0.29 0.014 0.29±0.042
(0.248-0.332)
30th
1.78 0.30 0.028 0.30±0.084
(0.216-0.384)
1.53 0.26 0.022 0.26±0.066
(0.194-0.326)
40th
1.68 0.28 0.009 0.28±0.027
(0.253-0.307)
1.31 0.22 0.022 0.22±0.066
[image:2.612.115.502.639.745.2]
FFA
%
0
.
564
V
/
W
Where V – volume of KOH and W- Weight of ghee sample
Estimation of Phospholipids: For the estimation of total
phospholipids, digest the sample with perchloric acid and estimate the phosphorous content as given in Fiske and Subbarao (1925).
Estimation of Phenol: Folin-Ciocalteau (FC) reagent and 20%
Na2C03 solution are added to the ghee sample and boiled in a
water bath and then cooled. The volume is made up to 25.0ml with glass distilled water and the blue colour is read in Bausch and Lamp Spectonic-20 at 775 nm against the reagent blank (Anonymous 1960).
RESULTS AND DISCUSSION
In the present study the keeping quality of Ghee characteristics namely, FFA, Phospholipids and Phenol are measured at
different storage periods the initial, 10th, 20th, 30th and 40th day
as mentioned earlier. For each of which we have taken 6 samples for both the cases (control and carbonyls extracted). The resulting data are presented in the appendix and are analyzed using t-tests, one way analysis of variance (one way ANOVA) etc., as given below:
Analysis of keeping Quality of Ghee Characteristics before and after removing the carbonyls (Control and Carbonyls
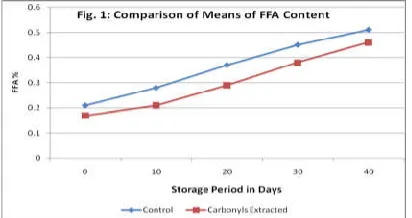
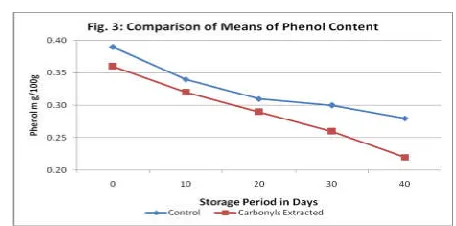
extracted) by Graphical methods: In this section, we have
compared the keeping Quality of Ghee Characteristics FFA, Phospholipid and Phenol contents before and after removing the carbonyls (Control and Carbonyls extracted) for different storage periods based on their mean values using graphical
methods. The various results obtained from the data (given in the appendix) are given below in Table 1 to Table 3 where as the comparison through the graphical methods are presented in the Figure 1 to Figure 3.
[image:3.612.331.537.97.206.2]Analysis of keeping Quality of Ghee Characteristics before and after removing the carbonyls (Control and Carbonyls extracted) using t-tests: As stated earlier, we have compared the keeping Quality of Ghee Characteristics FFA, Phospholipid and Phenol contents before and after removing the carbonyls (Control and Carbonyls extracted) for different storage periods using t-tests. The results are given below in Table 4 to Table 6.
Table 4: Comparison of FFA content between Control and Carbonyls extracted
Storage periods in days
Control Carbonyls
extracted
Pooled SD
Observed Value
Table Value Inference
S/NS*
Mean SD Mean SD to te=t0.05,10
0th
0.21 0.0178 0.17 0.006 0.013282 6.73413 2.228 S
10th 0.28 0.0178 0.21 0.016 0.016924 9.248686 2.228 S
20th
0.37 0.0200 0.29 0.016 0.018111 9.877171 2.228 S
30th 0.45 0.0160 0.38 0.009 0.012981 12.05799 2.228 S
40th
0.51 0.0140 0.46 0.015 0.014509 7.705796 2.228 S
[image:3.612.294.544.98.665.2]*S=Significant and NS=Non Significant
Table 5: Comparison of Phospholipid content between Control and Carbonyls extracted
Storage periods in days
Control Carbonyls extracted Pooled SD Observed
Value
Table Value Inference
S/NS*
Mean SD Mean SD to te=t0.05,10
0th 199.96 5.75 198.80 5.78 5.76502 0.449927 2.228 NS
10th
196.06 6.55 195.84 6.62 6.585093 0.074704 2.228 NS
20th
191.24 5.89 190.36 5.79 5.840214 0.336929 2.228 NS
30th 186.54 6.16 185.49 6.12 6.140033 0.382387 2.228 NS
40th 182.60 5.59 181.47 5.73 5.660433 0.446389 2.228 NS
[image:3.612.319.543.431.647.2]*S=Significant and NS=Non Significant
Table 6: Comparison of Phenol content between Control and Carbonyls extracted
Storage periods in
days
Control Carbonyls extracted
Pooled SD
Observed Value
Table Value
Inference S/NS*
Mean SD Mean SD to te=t0.05,10
0th
0.39 0.012 0.36 0.011 0.011511 5.827715 2.228 S
10th
0.34 0.013 0.32 0.015 0.014036 3.186265 2.228 S
20th
0.31 0.022 0.29 0.014 0.018439 2.425356 2.228 S
30th
0.30 0.028 0.26 0.022 0.025179 3.552224 2.228 S
40th 0.28 0.009 0.22 0.022 0.016808 7.982281 2.228 S
From the above tables, it is observed that the FFA contents and Phenol contents between Control and Carbonyls extracted cases are differing significantly at 5% level for all the different storage periods. However for the case of Phospholipid, there is no significant difference between Control and Carbonyls extracted cases at 5% level for all the different storage periods.
Analysis of keeping Quality of Ghee Characteristics at different storage periods (Using One Way Analysis of Variance)
As stated earlier the keeping quality of Ghee characteristics namely, FFA, Phospholipids and Phenol are measured at
different storage periods the initial, 10th, 20th, 30th and 40th day
and taken 6 measurements in each of the storage periods. Since we are considering each of the keeping quality of Ghee characteristics at 5 different levels with 6 replications we have to use One Way ANOVA model for the simultaneous comparison. Hence the hypotheses to be tested here is as
follows: “There is no significant difference between the
different storage periods (both Control as well as Carbonyls extracted cases) with respect to the keeping quality of ghee characteristics”.
The ANOVA tables and the inferences are given below:
Table 7: ANOVA Table for FFA content before removing the carbonyls (control)
Source SS DF MS F0 Fe=F0.05,4,25
Days 0.3609 4 0.0902 310.3899 2.76
Error 0.0073 25 0.0003
Total 0.3681 29
Inference: From the Table 7, it is observed that the calculated
(observed) value F0=310.3899 is more than the Table
(expected) value Fe=F0.05(4, 25)= 2.76. Hence we have
rejected the Null hypotheses that there is no significant difference between the different storage periods (Control) with respect to the ghee keeping quality characteristics FFA at 5% level of significance. This will agree with the cases happening in real life situations. That is, there is an increase in the amount of flavour inducing components due to the increase in the storage period.
Table 8: ANOVA Table for FFA content after removing the carbonyls (carbonyls extracted)
Source SS DF MS F0 Fe=F0.05,4,25
Days 0.3375 4 0.0844 550.2935 2.76
Error 0.0038 25 0.0002
Total 0.3413 29
Inference: From the Table 8, it is observed that the calculated
(observed) value F0=550.2935 is more than the Table
(expected) value Fe=F0.05 (4, 25)=2.76. Hence we have
[image:4.612.62.290.45.158.2]rejected the Null hypotheses that there is no significant difference between the different storage periods (carbonyls extracted) with respect to the ghee keeping quality characteristics FFA at 5% level of significance. This will agree with the cases happening in real life situations. That is, there is an increase in the amount of flavour inducing components due to the increase in the storage period.
Table 9: ANOVA Table for Phospholipid content before removing the carbonyls (control)
Source SS DF MS F0 Fe=F0.05,4,25
Days 1175.7767 4 293.9442 7.9085 2.76
Error 929.2030 25 37.1681
Total 2104.9797 29
Inference: From the Table 9, it is observed that the calculated
(observed) value F0=7.9085 is more than the Table (expected)
value Fe=F0.05(4, 25)=2.76. Hence we haverejected the Null
[image:4.612.320.546.366.406.2]hypotheses that there is no significant difference between the different storage periods (Control) with respect to the ghee keeping quality characteristics Phospholipid content at 5% level of significance. This will agree with the cases happening in real life situations. That is, there is an increase in the amount of flavour inducing components due to the increase in the storage period
Table 10: ANOVA Table for Phospholipid content after removing the carbonyls (carbonyls extracted)
Source SS DF MS F0 Fe=F0.05,4,25
Days 1224.0461 4 306.0115 8.4577 2.76
Error 904.5385 25 36.1815
Total 2128.5846 29
Inference: From the Table 10, it is observed that the
calculated (observed) value F0=8.4577is more than the Table
(expected) value Fe=F0.05 (4, 25)=2.76. Hence we have
[image:4.612.325.538.572.612.2]rejected the Null hypotheses that there is no significant difference between the different storage periods (carbonyls extracted) with respect to the ghee keeping quality characteristics phospholipid content at 5% level of significance. This will agree with the cases happening in real life situations. That is, there is an increase in the amount of flavour inducing components due to the increase in the storage period.
Table 11: ANOVA Table for Phenol content before removing the carbonyls (control)
Source SS DF MS F0 Fe=F0.05,4,25
Days 0.0423 4 0.0106 31.8424 2.76
Error 0.0083 25 0.0003
Total 0.0506 29
Inference: From the Table 11, it is observed that the
calculated (observed) value F0=31.8424is more than the Table
(expected) value Fe=F0.05 (4, 25)=2.76. Hence we have
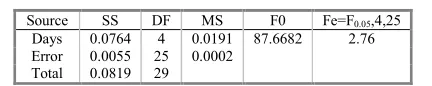
Table 12: ANOVA Table for Phenol content after removing the carbonyls (carbonyls extracted)
Source SS DF MS F0 Fe=F0.05,4,25
Days 0.0764 4 0.0191 87.6682 2.76
Error 0.0055 25 0.0002
Total 0.0819 29
Inference: From the Table 12, it is observed that the
calculated (observed) value F0=8.4577is more than the Table
(expected) value Fe=F0.05 (4, 25)=2.76. Hence we have
rejected the Null hypotheses that there is no significant difference between the different storage periods (carbonyls extracted) with respect to the ghee keeping quality characteristics Phenol content at 5% level of significance. This will agree with the cases happening in real life situations. That is, there is an increase in the amount of flavour inducing components due to the increase in the storage period
REFERENCES
Ananymous, 1960. Influence of growth regulation on chilli plants” Cited in Unpublished M.Sc.thesis, Submitted by Shantha, R to Madurai Kamarajar University, 1979. Fiske, C.H and Subbarao, Y. 1925. The colorimetric
determination of phosphorous. J. Biol. Chem., 66; 375.
Narashimhamurthy, N, and Ramamurthy, M.K. 1982.
“Modified method for free fatty acid in ghee. J. Dairy
Res., 1(2); 109-110
Vijayender Rao, D and Ramamurthy, M.K. 1984. Estimation
of polar carbonyls in ghee. Indian J.Dairy Sci., 37(2):98.
Web Johnson Alford, 1983. The lipids of milk; Deterioration II Autoxidation” Fundamental of dairy chemistry, pp; 240; 1983.