ISSN Print: 1913-3715
DOI: 10.4236/ijcns.2018.116007 Jun. 28, 2018 105 Int. J. Communications, Network and System Sciences
Implementing an Information System Strategy:
A Cost, Benefit, and Risk Analysis Framework
for Evaluating Viable IT Alternatives in the US
Federal Government
Sofia E. Espinoza
1*, Joan S. Brooks
2, John Araujo
11Office of the Associate Director for Science, Centers for Disease Control and Prevention, Atlanta, GA, USA 2PricewaterhouseCoopers Public Sector LLP, Atlanta, GA, USA
Abstract
In the US Federal government, an analysis of alternatives (AoA) is required for a significant investment of resources. The AoA yields the recommended alternative from a set of viable alternatives for the investment decision. This paper presents an integrated AoA and project management framework for analyzing new or emerging alternatives (e.g., Cloud computing), as may be driven by an information system strategy that incorporates a methodology for analyzing the costs, benefits, and risks of each viable alternative. The case study in this paper, about a business improvement project to provide public health and safety services to citizens in a US Federal agency, is a practical ap-plication of this integrated framework and reveals the benefits of this inte-grated approach for an investment decision. The decision making process in the framework—as an integrated, organized, and adaptable set of manage-ment and control practices—offers a defensible recommendation and pro-vides accountability to stakeholders.
Keywords
Analysis of Alternatives, Business Case, Cloud Computing, Cost Benefit Analysis, Information System Strategy
1. Introduction
At the US Centers for Disease Control and Prevention (CDC) and the Agency for Toxic Substances and Disease Registry (ATSDR), oversight of federal scien-tific regulations is housed in the Office of the Associate Director for Science
How to cite this paper: Espinoza, S.E., Brooks, J.S. and Araujo, J. (2018) Imple-menting an Information System Strategy: A Cost, Benefit, and Risk Analysis Framework for Evaluating Viable IT Alternatives in the US Federal Government. Int. J. Communi-cations, Network and System Sciences, 11, 105-132.
http://dx.doi.org/10.4236/ijcns.2018.116007
Received: March 27, 2018 Accepted: June 25, 2018 Published: June 28, 2018
Copyright © 2018 by authors and Scientific Research Publishing Inc. This work is licensed under the Creative Commons Attribution-NonCommercial International License (CC BY-NC 4.0). http://creativecommons.org/licenses/by-nc/4.0/
DOI: 10.4236/ijcns.2018.116007 106 Int. J. Communications, Network and System Sciences
(OADS) within the Office of the Director of CDC. Complying with these regula-tions is cumbersome and time consuming for scientists, programmatic staff, and the OADS personnel who must provide administrative oversight for achieving regulatory compliance. Unintended outcomes of this burden are risks associated with conducting public health science that cannot withstand peer review, public scrutiny, or audits. To achieve a goal of science regulation compliance, OADS committed to a business improvement project that would implement optimal processes, which in turn would serve downstream agency science and, ultimate-ly, public health and safety. This business improvement project was titled the “Science Services Support Project” (S3P) [1].
The S3P business improvement project included the implementation of a new information technology (IT) system. In the US Department of Health and Hu-man Services (DHHS), IT projects are subject to the Policy for Information
Technology (IT) Enterprise Performance Life Cycle (EPLC) [2] [3] which
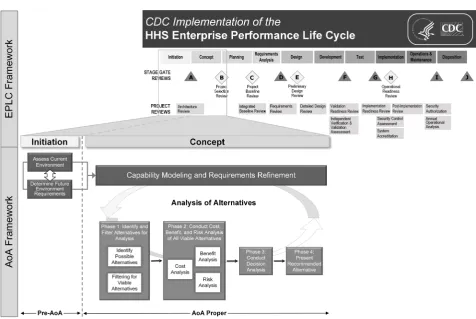
stipu-lates the implementation of the EPLC framework for managing IT projects. The major components of the framework are 10 phases marked by stage gate reviews, project reviews, and deliverables, as illustrated in Figure 1. During the second phase of the EPLC framework, projects must complete a business case, inclusive of an analysis of alternatives (AoA). The AoA sets the stage for the approach to a specific IT system implementation [4].
The US Office of Management and Budget (OMB) guidance in Circular A-11
[5] directs US agencies to develop an AoA for significant investments of re-sources. The underlying drivers of the AoA in the US and how the AoA should be developed and completed include legislation [6], policies [7], reviews [8], and practice guides [9]. In both civilian and non-civilian US agencies, the AoA is a standard effort and deliverable undertaken during an early phase of a project [4] [9] [10] [11] [12]. While the expectation is significant, the federal directives for conducting the AoA do not offer specific guidance for how to incorporate envi-ronmental drivers into the AoA for an IT system implementation, such as cloud computing.
DOI: 10.4236/ijcns.2018.116007 107 Int. J. Communications, Network and System Sciences Figure 1. CDC adaptation of the DHHS EPLC framework [3].
First” policy is the requirement that Cloud computing must be considered when identifying potential alternatives in the AoA, and if the Cloud alternative is se-cure, reliable, and cost effective, then it must be the recommended alternative for the IT project. This predetermined yet conditional AoA outcome of “Cloud First” logically is linked to the principle of cost effective stewardship of public funds.
DOI: 10.4236/ijcns.2018.116007 108 Int. J. Communications, Network and System Sciences
such as “Cloud First”, methods, tools, and experience make initiatives possible that will achieve the goals established for the strategy. Our paper bridges the gap, or clears an impediment, between strategy and implementation by demonstrat-ing how to incorporate an information system strategy into a decision for the in-itiative that will achieve the strategic goals of the organization.
Using a case study, our paper presents the integration of two frameworks for completing an AoA (i.e., the first framework) for an IT project (i.e., the second framework), inclusive of the OMB Cloud imperative, to address a science busi-ness need within an operating division of DHHS, to answer the questions of 1) what is the recommended alternative; and 2) should the recommended alterna-tive be based on cloud computing. We specifically describe how Cloud compu-ting (reflective of an environmental driver appearing in an information system strategy), as one of all possible alternatives, was included in the set of viable al-ternatives in the AoA framework. We also illustrate the integration of the AoA framework into the DHHS IT project management framework entitled the EPLC framework. The systematic integration of the AoA into the overarching IT project management approach makes it possible to accommodate environmental factors, such as Cloud computing, into the viable set of alternatives and achieve strategic goals of an information system strategy.
2. Description of the AoA Framework
The AoA framework, depicted in Figure 2 and overlapping the Initiation and Concept phases within the overarching EPLC framework for IT projects in DHHS, is best viewed as a set of methods and practices that can be tailored to serve the purposes of a specific IT project, as permitted by policy [3]. The “pur-poses” include new or emerging environmental factors, as was experienced by S3P when “Cloud First” appeared. Thus, the articulation of these two frame-works consists of the two concurrent work streams—AoA and overall project management work streams—during the early phases of an IT project in which this articulation provides cross cutting benefits (or advantages) to the concur-rent work streams. Viewing the AoA as distinct and diffeconcur-rent from the overall project effort can lead to additional (duplicative) effort and reduced effectiveness of the AoA per se to effectively guide the project to success [8].
DOI: 10.4236/ijcns.2018.116007 109 Int. J. Communications, Network and System Sciences Figure 2. The AoA framework for conducting an analysis of alternatives within the initiation and concept phases of the EPLC framework.
2.1. Pre-AoA: Assess Current Environment and Determine Future
Environment Requirements
The Pre-AoA section of the framework encompasses two overarching processes: 1) assessing the current environment and 2) determining future environment requirements. These two Pre-AoA activities are inputs for creating a unified work stream composed of “Capability Modeling and Requirements Refinement”. This unified work stream provides a formal approach for establishing “what” must be resolved without the distraction of the “how”. “What” must be resolved is the gap between the current environment and the future requirements, and the objective of the AoA is to identify and recommend a solution that could close this gap, given the constraints of the project environment.
2.1.1. Assess Current Environment
DOI: 10.4236/ijcns.2018.116007 110 Int. J. Communications, Network and System Sciences
The outputs of this process of assessing the current environment assist identi-fication of business requirements and process models and inform the cost, bene-fit, and risk analyses of the alternatives in the second phase in the “Proper” sec-tion of AoA framework.
2.1.2. Determine Future Environment Requirements
In this process, the SMEs refine further the future environment requirements and business processes to articulate clearly what is required to meet the business need and achieve the strategic objectives for business success. The ongoing itera-tive examination of the desired future state serves to cement how each of the ca-pabilities and entities will contribute to meeting the desired business need, al-lowing the business to drive the project requirements. The future requirements identified in this process have sufficient detail to support selecting and evaluat-ing alternatives and then to recommend a solution.
2.2. AoA Proper: Framework for Analyzing Alternatives in IT
Projects
The AoA Proper section of the framework has four signature phases that provide a systematic approach for conducting an analysis of alternatives for IT projects in the US Federal government. It is based on federal guidance documents and policies and incorporates knowledge from past CDC IT projects as well as gov-ernment and industry best practices in the area of IT project management.
2.2.1. Phase 1: Identify and Filter Alternatives for Analysis
The first phase in the AoA consists in generating a set of possible alternatives that could satisfy the project business needs and then screening this set to iden-tify only viable alternatives for further consideration in the subsequent phases of the framework.
1) Identify Possible Alternatives
DOI: 10.4236/ijcns.2018.116007 111 Int. J. Communications, Network and System Sciences
a) Commercial Off-The-Shelf (COTS): A solution based on a commercially developed or proprietary product with configuration and/or customization to meet the business need.
b) Government Off-The-Shelf (GOTS): A solution based on a government developed product with configuration and/or customization to meet the busi-ness need.
c) Suite of Integrated Products and Services (SIPS): A solution based on a suite of integrated COTS and/or GOTS products and services, using configura-tion or customizaconfigura-tion. The SIPS soluconfigura-tion also may integrate Open Source prod-ucts.
d) Custom Build: A solution largely based on original, custom development and programming
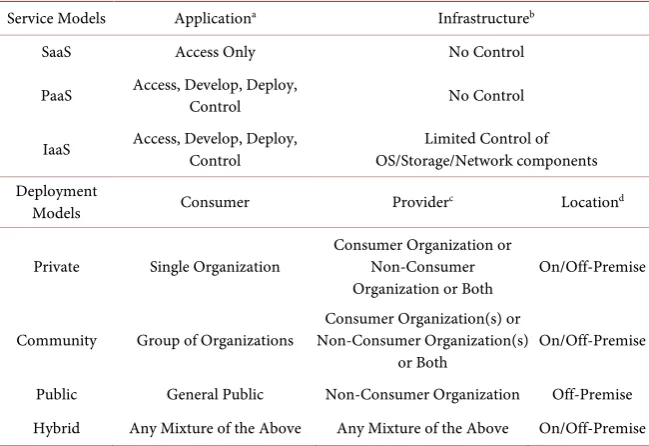
The “Cloud First” policy introduces an SDF based on service and deployment models (see Table 1). The combinations between how a solution can be obtained (COTS, GOTS, SIPS or Custom Build) and the solution delivery framework generally represent all of the possible alternatives for an IT project.
2) Filtering for Viable Alternatives
[image:7.595.210.535.426.649.2]The possible alternatives are narrowed down to a set of viable alternatives through a decision framework based on inputs from the Pre-AoA activities. The decision framework identifies the criteria by which alternatives will be excluded (or included) from further consideration and comprises two consecutive stages or filters.
Table 1. Cloud computing terminology.
Service Models Applicationa Infrastructureb
SaaS Access Only No Control
PaaS Access, Develop, Deploy, Control No Control
IaaS Access, Develop, Deploy, Control OS/Storage/Network components Limited Control of
Deployment
Models Consumer Providerc Locationd
Private Single Organization Consumer Organization or Non-Consumer
Organization or Both On/Off-Premise
Community Group of Organizations Non-Consumer Organization(s) Consumer Organization(s) or
DOI: 10.4236/ijcns.2018.116007 112 Int. J. Communications, Network and System Sciences
Filter 1: Mandatory requirements. The first filter serves to identify the al-ternatives that conform to government mandatory requirements. These re-quirements may be the result of legislation or policies and their compliance by an alternative quickly establishes the feasibility of such an alternative. As an ex-ample, within the US Federal government, agencies must apply the Federal In-formation Processing Standards (FIPS) 199 security standards when determining the security category of their information systems [25]. If an alternative can sa-tisfy all of the mandatory requirements, then it will continue on to the second filter; otherwise, it will be eliminated. The alternatives that pass the first filter are considered feasible.
Filter 2: Project-level requirements. The second filter evaluates the degree to which an alternative can satisfy a set of project-level decision criteria. The deci-sion criteria are based on both functional and nonfunctional requirements. They are defined and assigned weights—representing the importance or priority of the criterion to the project—by the project SMEs, and then reviewed by the inte-grated project team (IPT), especially to establish an exclusion (or inclusion) threshold. Each feasible alternative is scored based on its ability to meet each of the decision criteria, and the weighted scores are calculated and aggregated to obtain a single overall score for each alternative followed by a determination to retain the feasible alternative as a viable alternative.
At the end of the two-step filtering process, at least three viable alternatives must remain, in addition to the current baseline or status quo alternative, to comply with Part 7 (Section 300) of the OMB Circular A-11 [15]. Each of the viable alternatives needs to be defined at a level of detail that can lead to esti-mates of costs, analysis of benefits, and assessments of risks in the subsequent phase of the AoA framework.
2.2.2. Phase 2: Conduct Cost, Benefit, and Risk Analysis of All Viable Alternatives
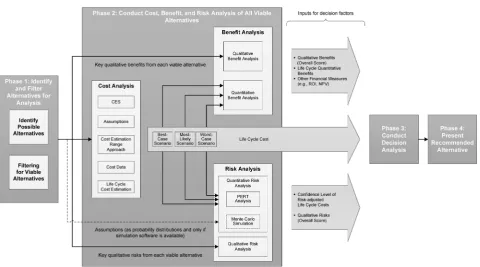
Once viable alternatives are identified, a more detailed analysis is conducted, which is composed of three separate yet related analyses: the cost analysis, bene-fit analysis, and risk analysis (see Figure 3). While each of these has a separate objective, the results of all of these analyses must be evaluated collectively to identify the recommended alternative.
The “Cost Analysis” section estimates the life cycle costs of each viable alter-native for delivering the business IT solution that meets the project’s business needs. Because the cost analysis is an examination of the projected (or antic-ipated) life cycle costs, the model to calculate these costs is assumption-driven.
DOI: 10.4236/ijcns.2018.116007 113 Int. J. Communications, Network and System Sciences Figure 3. Detailed view of the cost, benefit, and risk analysis phase within the AoA proper section of the AoA framework.
The “Risk Analysis” section also includes quantitative and qualitative ele-ments. The quantitative risk analysis uses the same assumption-driven approach as the Cost Analysis. The analysis of qualitative risks is similar to the approach for qualitative benefits. Qualitative risks are about the capability (or likelihood) of a viable alternative to deliver the solution, which was undertaken as a project to meet the business needs, as the impacts of the project.
The outcomes of the analyses conducted in Phase 2 are provided as inputs to the next phase of the framework, Conduct Decision Analysis, wherein the viable alternatives are compared to determine a recommended alternative.
1) Cost Analysis
The five steps for estimating the life cycle costs for each viable alternative typ-ically follow the approach below; however, iterations of any step may be required to satisfy stakeholders or to address gaps in knowledge that appeared during the cost estimating process, such as when updating assumptions.
Implementa-DOI: 10.4236/ijcns.2018.116007 114 Int. J. Communications, Network and System Sciences
tion phase (of the EPLC framework and see Figure 2). The O&M costs capture the recurring costs to support and maintain the system once it becomes opera-tional. Transition costs capture the costs associated with supporting and main-taining the current legacy systems or status quo until a viable alternative achieves an established point in the O&M phase. If the life cycle cost estimate of the recommended alternative is expected to include a disposition phase, then a fourth time related phase of cost, the disposition cost, would be added to the CES.
The cost elements for each major project phase are based on all the antic-ipated costs required to complete an IT project over the defined life cycle. The two main cost elements within the major time related phases are products (or goods) and services, each of which can be decomposed further into sub elements and which are estimated for a WBS element. The level of detail of the final CES should be consistent with the level of detail required by the cost estimation model and approved by the project stakeholders.
Step 2: Define general and specific assumptions. Because of limited infor-mation at the time of performing the AoA, cost estimators must define assump-tions that will support acceptable cost estimates and provide completeness across each viable alternative. Assumptions should address data sources (e.g., previous cost estimates, industry standards, or models), data exclusions or incompleteness (for clarification as to what was used in the cost estimation model), time frames within the project life cycle affecting cost elements, elements of scope not specif-ically called out in the business requirements (e.g., security categorization, availability, and performance), and methods used to calculate costs (e.g., infla-tion, discount rate, and capitalization).
Two types of assumptions can be defined: general and specific. General as-sumptions are defined for all of the viable alternatives and address elements such as the project life cycle time frame, the base year (for presentation of costs), la-bor rates, and the methods used for estimating costs. Specific assumptions are defined for each alternative and involve products and services that are unique to a specific alternative (e.g., allocation of software costs for the various Cloud al-ternatives), as well as the estimated time frames for each EPLC phase.
Step 3: Define cost estimation range approach. To produce a defensible analysis that incorporates the limitations of imperfect information and uncer-tainty, the approach for developing a life cycle cost model adopts the concept of cost estimation ranges. Thus, a defined assumption could have multiple out-comes typically reflecting the “best”, “worst”, and “most likely” outout-comes. The “best-case” scenario captures costs based on the best-case outcome for every as-sumption, while the “worst-case” scenario assumes the worst-case outcome for every assumption. The “most likely” scenario captures costs that are based on the most likely outcome for each assumption. The use of the “most likely” as-sumption is also the definition of the risk-adjusted cost.
com-DOI: 10.4236/ijcns.2018.116007 115 Int. J. Communications, Network and System Sciences
monly used is market research, which, according to the OMB Capital Program-ming Guide, encompasses “research of published information, talking to other agencies that have conducted similar market research, and/or going directly to the market for information” ([26], p. 13). If publicly available information is not sufficient, then surveys or requests for information can be directed to qualified vendors that potentially can provide the identified viable solutions. Following the cost estimation range approach, whenever possible, data should be collected for each case scenario for each cost element. Costs gathered from historical data should be updated for inflation, technology maturity, and any other factors that may affect their value [27]. All collected cost data, including their sources and any adjustments made, should be documented.
Step 5: Estimate life cycle costs for each viable alternative. Once the as-sumptions have been defined and the cost data have been collected, the cost elements identified in the CES can be estimated. A variety of methods are availa-ble for estimating cost elements, among which analogy, parametric estimation, and engineering build-up estimates are the most frequently used [15] [26] [27]. Less common methods include expert opinion, extrapolating (from actual costs), and learning curves. The life cycle costs for each scenario of an alternative can be approximated by aggregating all the corresponding cost elements within each case scenario (i.e., “best”, “worst”, or “most-likely” case scenario), while recog-nizing the potential impact of the underlying probability impact distributions. A standard best practice uses a 10-year timeframe to represent life cycle costs [14]; however, this timeframe may vary depending on the size, complexity, and nature of the project.
2) Benefit Analysis
The approach for the benefit analysis identifies both the quantitative and qua-litative benefits anticipated to be delivered by the solution, defines the manner for estimating the benefits and collecting the necessary data, and analyzes the identified benefits for each viable alternative.
Identify benefits. All identified benefits should align with the project objec-tives and contribute to meeting the project business needs [26]. To allow for a comprehensive understanding of the business and mission value that the alter-native would provide, both quantitative and qualitative benefits should be in-cluded.
DOI: 10.4236/ijcns.2018.116007 116 Int. J. Communications, Network and System Sciences
Qualitative benefits are the expected benefits generated by the alternative that are not assigned a monetary value, but nevertheless contribute to accomplishing the project objectives. Benefits produced by certain government IT projects are qualitative in nature and may not be easily or reliably quantified or monetized.
Quantitative benefits analysis. Benefits are expected to occur in the future, after the delivery of the business product by the project, and should be measured from the time the identified benefit begins to appear through the end of the project life cycle. To provide consistency in the analysis across each alternative, life cycle quantitative benefits are estimated following the same assump-tion-driven approach defined for the cost analysis and using the same set of as-sumptions specified for each of the three case scenarios: “best”, “worst”, and “most-likely”.
There are several financial metrics that can be used to analyze alternatives in terms of their overall quantitative benefits. The most commonly used metric is net present value (NPV), which OMB considers the standard for evaluating in-vestments based on financial factors [14] [26]. In the AoA framework, the NPV of recurring costs is defined as the total present value (PV) of the recurring costs of the status quo minus the total present value of the recurring costs of the al-ternative. As defined, the delta indicates the estimated operational savings (as a positive value) or increases (as a negative value) of the costs that would have been incurred to maintain the status quo compared to the alternative. Other common financial metrics include internal rate of return, return on investment (ROI), benefit cost ratio, and payback period. The ROI metric calculates the projected return generated by an alternative for every investment dollar spent, in PV dollars. The payback period metric calculates the cumulative generation of projected quantitative benefits over the life cycle period relative to the cumula-tive costs over that same period. Unlike previously described metrics which use PV to remove inflationary factors from the calculation, the payback period me-tric is intended to identify the point in time when cumulative quantitative bene-fits exceed cumulative costs from a budgetary perspective, without regard for the time value of money.
Another metric that can be used to evaluate alternatives is the operational dollar cost per investment dollar spent or operational cost burden. It is calcu-lated as the ratio between NPV of recurring costs, as defined above, and the PV investment costs for an alternative. With a finite life cycle period, for example 10-years, a longer investment period invariably results in a shorter duration to capture recurring costs within that 10-year timeframe. Hence, annualized costs may be preferred for this calculation.
DOI: 10.4236/ijcns.2018.116007 117 Int. J. Communications, Network and System Sciences
data) or from historical data from similar projects, and may require some degree of associated data analysis. After the benefits have been estimated using the same unit of measure, they can be compared directly across viable alternatives. To evaluate alternatives based on qualitative benefits measured with ordinal rating scales, a weighted-score method can be used.
3) Risk Analysis
The risk analysis approach identifies the risks potentially incurred by the via-ble alternatives and evaluates them from both quantitative and qualitative pers-pectives.
Identify risks. Risk is defined as an uncertain event or condition that, if it occurs, may have a positive or negative impact on project objectives such as time, cost, scope, and quality [29]. For each viable alternative, the relevant stakeholders should identify the risks that might impact the project and provide a clear description of the risk event. A risk that would apply equally to all viable alternatives could be excluded from the risk analysis because this risk would not contribute to a risk based distinction among all of the alternatives. Like benefits, risks can be segmented into two distinctive classifications: quantitative and qua-litative. The impacts of quantitative risks are measured in financial terms. The impacts from the qualitative risks are not translated into monetary terms, but still are linked to the project successfully achieving its objectives.
Quantitative risk analysis. The objective of the quantitative risk analysis is to model the uncertainty of the primary cost drivers to determine the confidence level associated with the risk adjusted life cycle cost estimate (defined as the cost estimate of the most likely scenario generated during the cost analysis). To in-troduce uncertainty in the life cycle cost model, a probability of occurrence is as-signed to each potential value that the assumption might take. The correspond-ing challenge is to determine the cost impacts linked to these probable occur-rences using the currently available information for each viable alternative. The results of these calculations are a range of potential life cycle cost estimates and their respective probabilities of occurrence.
DOI: 10.4236/ijcns.2018.116007 118 Int. J. Communications, Network and System Sciences
Qualitative risk analysis. One approach for the qualitative risk analysis is to use ordinal scales (e.g., low, medium, and high) to assess the probability of oc-currence of the identified risks and their potential impact to the project. Then, the qualitative risks are assessed for each viable alternative by relevant project stakeholders and assigned levels for probability of occurrence and impact. The combination of the probability and impact values can be used to create a “risk score” to compare alternatives based on their overall qualitative risk.
2.2.3. Phase 3: Conduct Decision Analysis
The Decision Analysis phase provides a framework to leverage the data and in-formation generated from the previous three separate analyses in a holistic anal-ysis across the viable alternatives, as depicted in Figures 2-3. This analysis com-prises two steps leading to a selection of a recommended alternative: identify and define a set of decision factors and then apply a weighted score method to eva-luate the alternatives based on the identified decision factors.
1) Identify and Define the Project Decision Factors
The first step is to identify and define the decision factors that will be used to evaluate alternatives and select the recommended alternative to meet the project’s objectives. These decision factors should be related to functional and nonfunctional requirements identified by the project stakeholders. Their defini-tion should include specific guidance on how to evaluate an alternative against the decision factor.
2) Evaluate the Alternatives Using a Weighted-Score Method
The second step begins with prioritizing the decision factors by assigning them weights based on their relative need or importance to the project’s goals and objectives. This activity requires broad participation and concurrence from the integrated project team to validate the project priorities; thus, minimizing bias to a singular perception or opinion. Next, each viable alternative is rated against each decision factor according to the guidance defined in the first step. Once the scoring for each alternative is complete across all decision factors, the alternative’s scores are multiplied by the corresponding decision factor’s weight and then summed to produce a weighted average score for each viable alterna-tive. The alternative with the highest score will be the recommended alternaalterna-tive.
2.2.4. Phase 4: Present Recommended Alternative
DOI: 10.4236/ijcns.2018.116007 119 Int. J. Communications, Network and System Sciences
for accepting the recommendation, or making the decision, should have the ne-cessary understanding of the assumptions and AoA approach that led to the recommended alternative. They need this knowledge for proper accountability for decision making. The combination of this AoA framework inside the EPLC framework makes full transparency achievable.
The recommended alternative will be judged as most likely to support project success, as has been defined throughout the AoA framework. In the US Federal government, the recommended alternative balances and applies the decision fac-tors in a manner consistent with the objectives of the project and the constraints of federal wide regulations and policies (e.g., “Cloud First”), DHHS mandates and policies, and CDC procedures and best practices, in a cost-effective manner that achieves the tradeoffs among costs, benefits, and risks deemed most accept-able to the federal government.
3. Application to Case Study
The case study is presented and arranged to track back to each primary section and subsection of the AoA framework, as presented above; allowing the reader to cross walk section details with how it was applied by S3P. This cross-walk ca-pability is especially important and useful for understanding how “Cloud First” impacted the comparative analyses in the AoA. The case study can serve as guide posts for future implementations of the integrated framework approach and strengthens the authors’ model for how to disseminate methodologies and man-agement and control practices that promote transparency and accountability by public sector managers for IT projects.
3.1. Pre-AoA: Assess Current Environment and Determine Future
Environment Requirements
To assess the current environment and determine the future state S3P require-ments, the project team assembled an agency-wide team of SMEs from across the functional project areas. Through Capability Modeling sessions, the SMEs identified an initial set of capabilities and evaluated their current value to pro-gram execution and how well the current environment supported the execution of the capabilities (effectiveness). In following sessions, the initial set of capabili-ties was refined to a total of 57, and business enticapabili-ties and high level process flows also were identified.
DOI: 10.4236/ijcns.2018.116007 120 Int. J. Communications, Network and System Sciences
risks. Based on this analysis, the status quo environment was missing 91% of the needed functionality to address S3P goals and objectives. This 91% gap was ac-cepted by the project team and Information Resources (IR) governance and was the basis for pursuing the business case, which incorporated the AoA.
3.2. AoA Proper
3.2.1. Phase 1: Identify and Filter Alternatives for Analysis
S3P identified 11 possible On-Premise alternatives, which included the status quo, and 12 possible Cloud alternatives (the four deployment models across the three service models). As described in this framework, two filters were defined and consecutively applied to the possible alternatives: mandatory requirements and project level (functional and nonfunctional) requirements.
The criterion for Filter 1 was the FIPS 199 Moderate security categorization assigned to the project. At the time of this AoA, no Public Cloud alternatives were able to demonstrate compliance with the FIPS 199 security requirements; thus, the Public and the Hybrid Cloud deployment models were eliminated. The remaining 16 feasible alternatives, excluding the status quo, were evaluated by the second filter.
The criteria for Filter 2 were based on the future environment requirements that were established by the IPT. There were 16 project-level decision criteria based on 9 functional and 7 non-functional requirements. Only the Private Cloud deployment model produced viable Cloud service model alternatives (i.e., SaaS, PaaS and IaaS). The On Premise alternatives, except for the status quo, were evaluated against each of the project level decision criteria and then ranked based on their aggregated weighted scores. The outputs of Filter 2 were six viable alternatives: the status quo, two On-Premise alternatives, and three Private Cloud alternatives.
The PaaS and IaaS Private Cloud alternatives required a special consideration for how the solution would be obtained, which increased the viable Cloud alter-natives to five: one SaaS, two PaaS, and two IaaS alteralter-natives.
The final set of viable alternatives included the status quo plus seven new al-ternatives, as depicted in Table 2. Further market research on the seven new al-ternatives provided the sufficient information to perform the cost, benefit, and risk analysis in the subsequent phase of the AoA framework.
3.2.2. Phase 2: Conduct Cost, Benefit, and Risk Analysis of All Viable Alternatives
S3P conducted cost, benefit, and risk analyses on the final viable alternatives (cf.
Table 2) that emerged from the phase titled “Identify and Filter Alternatives for Analysis” (cf. Figure 2).
1) Cost Analysis
DOI: 10.4236/ijcns.2018.116007 121 Int. J. Communications, Network and System Sciences Table 2. S3P alternatives that were identified as possible, feasible, and viable for the AoA.
Possible
Alternatives Alternatives Feasible Alternatives Viable Final Viable Alternatives Solution
Delivery
Framework How
c
On-Premisea
(Non-Cloud)
SQ Ind Ind Ind Ind
USQ Ind & Int Ind & Int COTS Ind & Int Ind & Int GOTS Ind & Int Ind & Int
SIPS Ind & Int Ind & Int Int Int CB Ind & Int Ind & Int Int Int
11 11 3 3
Off-Premise (Cloudb)
SaaS Private, Community, Public, Hybrid Community Private, Private (COTS ) Private
Paas Private, Community, Public, Hybrid Community Private, Private Private (SIPS), Private (CB)
IaaS Private, Community, Public, Hybrid Community Private, Private Private (SIPS), Private (CB)
12 6 3 5
Total 23 17 6 8
Note. SQ = Status Quo. USQ = Updated Status Quo. COTS = Commercial Off-The-Shelf. GOTS = Gov-ernment Off-The-Shelf. SIPS = Suite of Integrated Products and Services. CB = Custom Build. Individual (Ind) is defined as a solution of various components or vendor products that may have integration points but each of these components or products operates independently. Integrated (Int) is defined as a solution of various components or vendor products that are fully integrated and operate as a “single” cohesive unit as viewed by the end user. aOn-Premise Computing is defined as a computing model, Cloud or not, that deploys locally at the consumer organization. bCloud Computing delivers computing services and technol-ogies matched to acute and/or dynamic thresholds of need types established by the user of the services and technologies [33]. c“How” the solution will be obtained is described in the subsection “Identify Possible Al-ternatives.”
developed for each viable alternative included the time frames for each EPLC phase, the level of software application customization, and the number of con-tractor hours. All assumptions and ground rules were reviewed by the S3P IPT and the Critical Partners (CPs) and approved by the project leadership. S3P es-timated the range, defined by the lower bound (i.e., “best-case”), upper bound (i.e., “worst-case”) and risk-adjusted (i.e., “most-likely case”) estimates, of PV 10-year life cycle costs for each viable alternative.
The PV lower bound 10 year life cycle cost estimate for the SaaS Private Cloud alternative was the least costly, followed by the SIPS On-Premise alternative; the most expensive PV lower bound cost estimates occurred for the custom devel-oped applications in the PaaS and IaaS Private Cloud environments.
DOI: 10.4236/ijcns.2018.116007 122 Int. J. Communications, Network and System Sciences
the total amount of time estimated to deliver the solution, and the greater the degree of customization, the greater the development and integration costs. The third impact on labor costs was requirements specificity: more loosely defined (and accepted) requirements introduce more uncertainty into cost estimating compared to modeling based on requirements that are well understood and amenable to the cost estimation method.
2) Benefit Analysis
S3P identified and analyzed both quantitative and qualitative benefits for all viable alternatives. To determine if any system savings existed, the O&M costs of the status quo was compared to the O&M costs of each of the other viable alter-natives. This comparison indicated that none of the viable alternatives generated savings, even accounting for various O&M durations within the 10 year life cycle cost estimate: the status quo O&M costs were approximately an order of magni-tude less than any of the O&M costs of any alternative. The operational cost per investment dollar was analyzed without annualizing it. The smallest cost burden was observed for the SaaS Private Cloud alternative, as the O&M component of the recurring costs—regardless of upper, lower, or risk adjusted—was the least among all of the alternatives. Overall, the operational cost burden of the Cloud alternatives was less than the On Premise alternatives, but remember that this ratio obscures the actual magnitudes of the numbers forming the ratio, indicat-ing the importance of multiple types of analyses for recommendindicat-ing the alterna-tive to carry forward.
[image:18.595.205.540.544.732.2]A total of ten qualitative benefits were identified from three sources: key bene-fits identified across alternatives, qualitative benebene-fits captured within the project critical success factors (CSFs), and benefits determined by the S3P IPT/CPs. As depicted in Table 3, each benefit was assigned an importance value (or weight) of Minimal (1), Moderate (2), Moderate/High (3) or High (4). After assessing each alternative against each benefit, the overall capability of each of the Cloud solutions (weighted average range: 9.0 - 10.0) was judged to be superior com-pared to the On Premise solutions (weighted average range: 8.6 - 8.9).
Table 3. Ten benefits assessed for each viable alternative.
Qualitative Benefit Importance Value
Ability to leverage “best in breed” across core functional areas High Ability to migrate seamlessly to a Cloud environment Moderate
Ability to incorporate changes/flexible architecture High Ability to provide a single vendor to manage the entire solution Moderate
Ability to rapidly increase capacity Minimal Ability to eliminate and/or reduces hardware ownership and maintenance High
DOI: 10.4236/ijcns.2018.116007 123 Int. J. Communications, Network and System Sciences
3) Risk Analysis
S3P identified potential risks areas and assessed them from a quantitative or qualitative perspective. In the quantitative risk analysis, the objective was to as-sess how well the risk adjusted life cycle cost estimates captured the uncertainty associated with the risk factors. The outcomes of the Monte Carlo simulations were that the risk-adjusted life cycle costs for the On-Premise SIPS alternative were associated with the highest level of confidence of 91%, followed by the PaaS Custom Build alternative at 80.2%. The alternatives with the lowest level of con-fidence in their risk-adjusted cost estimates were the IaaS Custom Build, IaaS SIPS, and On Premise Custom Build alternatives at 20.7%, 27.4% and 44.6% confidence levels, respectively.
The following identified risk areas were assumed to have no direct financial impact on the project and therefore addressed through a qualitative risk analysis:
• Overall Project Failure: The risk of the solution ultimately becoming
“unim-plementable”.
• Information System Security: The risk of increased level of effort needed to
ensure that the information system security requirements are met.
• Stakeholder/Business Owner: The risk of weak, ineffective, or waning
stake-holder buy-in and commitment through the Operations and Maintenance phase.
• Technology: The risk that the rapid evolution of technology can create for
S3P.
• Compliance: The risk that the solution would not be able to satisfy the S3P
mandatory requirements.
For each identified risk area, the combination of impact and probability gen-erated a risk score for each alternative. Based on this analysis, the On-Premise SIPS alternative scored the lowest overall qualitative risk, followed by the On-Premise Custom Build option. On the other side of the spectrum, the Cloud alternatives scored the highest overall qualitative risk.
3.2.3. Phase 3: Conduct Decision Analysis
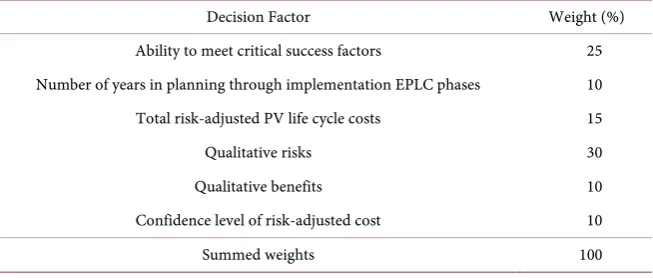
Under the S3P AoA Decision Analysis framework, the S3P IPT identified six de-cision factors, weighted as depicted in Table 4, to evaluate the viable alterna-tives, as reviewed below.
1) Ability to meet critical success factors: The functional and nonfunctional CSFs were used to establish the viable alternatives during Step 2 (Filter 2) of “Filtering for Viable Alternatives”. This decision factor was the second most important factor identified by the project team. Apart from the status quo, each of the viable alternatives was confirmed to be able to successfully meet all of the CSFs and was assigned a High score (4).
DOI: 10.4236/ijcns.2018.116007 124 Int. J. Communications, Network and System Sciences Table 4. Six decision factors and weights for the arriving at the recommended alternative in the decision analysis.
Decision Factor Weight (%)
Ability to meet critical success factors 25 Number of years in planning through implementation EPLC phases 10 Total risk-adjusted PV life cycle costs 15
Qualitative risks 30
Qualitative benefits 10
Confidence level of risk-adjusted cost 10
Summed weights 100
duration of the investment period. The shortest investment period was estimated for On-Premise SIPS and was assigned a Moderate/High score (3). The On-Premise Custom Build was assigned a score of 2. All Cloud alternatives re-ceived the Low score (1).
3) Total present value risk-adjusted life cycle costs: The total present value risk-adjusted life cycle costs for each alternative were scored. This cost was the least for the status quo, scored a 4, followed by the two On Premise alternatives of SIPS and Custom Build of 3 and 2 respectively. The Cloud alternatives were the most costly.
4) Qualitative risks: Qualitative risks were the most important in the decision analysis process. Qualitative risks were deemed most favorable (High or 4) for the On-Premise SIPS alternative, followed by the On Premise Custom Build al-ternative at Moderate/High (3), and then least favorable (Low or 1) for all of the Cloud alternatives.
5) Qualitative benefits: Qualitative benefits scores were tightly bunched among all of the alternatives, save for the status quo and the IaaS alternatives. Each of the On Premise SIPS and SaaS alternatives were judged to deliver the greatest collection of benefits. The On Premise Custom Build and remaining Cloud alternatives were approximately of similar benefit.
6) Confidence level of total PV risk-adjusted life cycle costs: The uncertainty analysis within the Risk Analysis calculates a level of confidence indicating the degree to which the risk-adjusted cost estimate captured the impact of identified risks within the cost analysis. The On-Premise SIPS alternative was assigned a High score (4), followed by the two PaaS alternatives each with a score of 3 (80th - 89th percentile). The cumulative probability distributions associated with the risk adjusted costs for the other alternatives were below the 69th percentile and assigned the Low (1) score.
3.2.4. Phase 4: Present Recommended Alternative
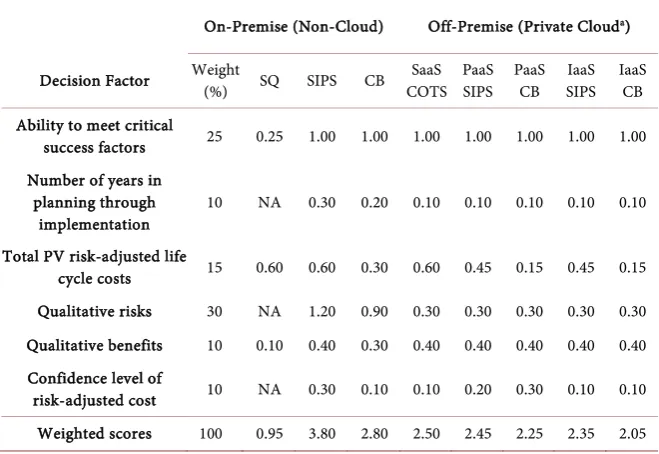
DOI: 10.4236/ijcns.2018.116007 125 Int. J. Communications, Network and System Sciences Table 5. The S3P case study to illustrate the decision analysis.
On-Premise (Non-Cloud) Off-Premise (Private Clouda)
Decision Factor Weight (%) SQ SIPS CB COTS SaaS PaaS SIPS PaaS CB SIPS IaaS IaaS CB
Ability to meet critical
success factors 25 0.25 1.00 1.00 1.00 1.00 1.00 1.00 1.00 Number of years in
planning through
implementation 10 NA 0.30 0.20 0.10 0.10 0.10 0.10 0.10 Total PV risk-adjusted life
cycle costs 15 0.60 0.60 0.30 0.60 0.45 0.15 0.45 0.15 Qualitative risks 30 NA 1.20 0.90 0.30 0.30 0.30 0.30 0.30 Qualitative benefits 10 0.10 0.40 0.30 0.40 0.40 0.40 0.40 0.40 Confidence level of
risk-adjusted cost 10 NA 0.30 0.10 0.10 0.20 0.30 0.10 0.10 Weighted scores 100 0.95 3.80 2.80 2.50 2.45 2.25 2.35 2.05 Note. NA = Not Applicable. SQ = Status Quo. SIPS = Suite of Integrated Products and Services. CB = Cus-tom Build. COTS = Commercial Off-The-Shelf. Cell values are weighted scores. Larger values are more fa-vorable. aSee Table 1 for explanation of Cloud service models.
meet the business need in order to provide a recommended alternative for IR governance to accept, which in turn will lead to an IT project to deliver the recommended alternative as the business solution. In the S3P case study, the overall weighted score for the On-Premise SIPS alternative was observed to be distinctly different from the other viable alternatives. The primary decision fac-tor accounting for this difference was the qualitative risks. Qualitative risks have the potential to derail a project and were judged to be the most important factor for decision making. Because the S3P AoA was conducted during 2011, when the US Federal government was only on the cusp of implementing the “Cloud First” policy, SMEs and stakeholders determined that risks such as overall project fail-ure, information system security, long running stakeholder participation and commitment, hype cycle impact on technology enthusiasm, and achieving com-pliance with all mandatory requirements would be less risky with an On Premise deployment. The second distinguishing factor in Table 5 is the cost: not only was the SIPS solution less costly, but there was more confidence in the cost esti-mate. Thus, the S3P project team recommends the On-Premise SIPS alternative to IR governance at the stage gate review for the Concept phase of the EPLC framework.
4. Discussion
recom-DOI: 10.4236/ijcns.2018.116007 126 Int. J. Communications, Network and System Sciences
mended alternative be based on cloud computing. Of particular interest in the case study was the application of the AoA framework when Cloud computing alternatives were included among the viable alternatives. The integration of the two frameworks offered a roadmap beyond impediments to how to formulate an actual selection decision that could lead to a Cloud computing implementation. The case study illustrated the integration of these two frameworks and resulted in a defensible position with regard to the “Cloud First” policy for the recom-mended alternative. Importantly, and in addition, the AoA framework was careful to emphasize and note that the decision for the recommended alternative is far removed from just a cost focus, and in fact, should be based on and represent the priorities and points of view of the IPT for the benefits to be rea-lized and risks to be managed for the delivery of the recommended alternative as the business solution. This paper illustrated how the combination of the AoA and EPLC frameworks makes it possible to achieve these objectives while meet-ing all federal requirements for benefit-cost analysis [14], budget preparation
[15], and conforming to best practices for cost estimation and assessment [27]. This paper articulates the EPLC framework established by policy [2] [3] with a set of four process, as depicted in Figure 2 and developed further in Figure 3. This set of four processes comprises the AoA Proper section of the entire AoA framework. An important contribution of this articulation is the establishment of the eventual set of viable alternatives based on project objectives and subse-quent capabilities (in the Pre-AoA section) required by SMEs who will be using the implemented solution. The time phased articulation with the EPLC frame-work both during the Concept as well as O&M phases is an important distinc-tion and difference versus the AoA framework as a standalone effort. This time phased articulation enriches both frameworks by bringing techniques and out-puts from one to bear upon the other.
As noted above, the AoA framework described in this paper is the logical or-ganization of actions producing value to the project as the recommended and defensible path forward. This value arises from not conducting the analysis as a separate, standalone effort, but as a work stream integrated and articulated with the overall project work. This view of the AoA framework in the context of the project purpose and the impact of environmental factors, such as “Cloud First”, is a unique aspect and contribution of this work and can provide practitioners with techniques for project management in the federal government context.
DOI: 10.4236/ijcns.2018.116007 127 Int. J. Communications, Network and System Sciences
and “ease of use”, and the integrated framework approach, which accommodates project level preferences via tailoring, welcomes the injection of any relevant criteria that will foster project success. In the case study, the above two barriers to adoption were elements of the S3P qualitative benefits and CSFs (see Tables 3-4). This overarching objective of the integrated framework is in accordance with GAO findings [8] and Keys to Success [34]. Understanding that these frameworks are molded around the business need and project objectives indi-cates that the frameworks are usable whenever there is a need to systematically and defensibly arrive at a recommendation for a path forward.
Although the “Cloud First” policy appeared on the horizon of the US Federal government within the recent decade (i.e., circa 2011), authors with a historical view of Cloud computing point out that it might be more accurate to view Cloud computing as an evolution to its current state rather than as a computing model with a clear, trigger event ([35], p. 12-13), because Cloud computing “is based on … many old and [a] few new concepts” ([36], p. 1). The specific new con-cepts applicable to “Cloud First” are based on delivering computing services and technologies matched to acute and/or dynamic thresholds of need types estab-lished by the user of the services and technologies as provided by Cloud compu-ting [20] [33]. The concept of a Cloud computing taxonomy is useful because it informs or even specifically identifies Cloud alternatives in an IT AoA. EPLC is not a collection of decision frameworks, but it is marked by a series of “Go No-Go” governance decisions at phase boundaries, as indicated by the triangles and diamonds in Figure 1. Systematic approaches for developing recommenda-tions for a governance decision often occur throughout the EPLC framework, as required by the project and its stakeholders, and invariably compare the costs, benefits, and risks associated with a set of choices or alternatives. This paper formalizes the systematic integration of a sub work stream, the AoA, into the overall project management effort. The case study brings AoA details to a great-er undgreat-erstanding via the application and illustration of analyses with actual evi-dence and data.
DOI: 10.4236/ijcns.2018.116007 128 Int. J. Communications, Network and System Sciences
necessary and required defensible decision.
In terms of arriving at the defensible decision for the S3P solution deploy-ment, the AoA framework allowed S3P specifically to address each of these deci-sion making criteria. The first filter in the framework, for the application of mandatory requirements, made it possible to ensure that federal information security requirements would be met by all alternatives passing through this filter. As reviewed and accepted by S3P Critical Partners, the Private Cloud deploy-ment model was capable of meeting FIPS 199 processing standards, and, thus, the three service models within the Private Cloud deployment model became viable candidates. The “Cloud First” criterion of reliability was contained with the project level criteria, and as documented in the S3P case study, the three Cloud service models met it. However, as shared in Table 5, the Cloud alterna-tives were not judged to be cost-effective, as defined via the decision factor anal-ysis. Thus, the S3P AoA was completed and guided by the “Cloud First” policy, but the evidence led to an On Premise recommendation, as guided by the “Cloud First” decision criteria.
The “Cloud First” policy arrived after and also had a context with Transpa-rency and Open Government [40]. To achieve the objective of open government, the Administration sought to establish a system of “transparency, public partic-ipation, and collaboration”. “Cloud First” also sought to promote public partici-pation and collaboration with the US Federal government in order to achieve the Cloud benefits enumerated in the policy. Inherently, transparency, public par-ticipation, and collaboration can strengthen accountability. While the technical aspects of the AoA framework provide practices and methods that can deliver a defensible recommendation, broad, collaborative participation within a govern-ment agency yields transparency and accountability for use of public funds, which in this case was for a project designed to provide public health and safety services to its citizens. As a matter of accountability, direction should be subject to evaluation. Not only does “Cloud First” represent a direction, but so does pursuing the recommended alternative (from the AoA framework) as the solu-tion to meet the business need.
5. Conclusion
DOI: 10.4236/ijcns.2018.116007 129 Int. J. Communications, Network and System Sciences
also provides a starting point for evaluative research because the framework sys-tematically addresses and documents the steps taken by public sector managers to arrive at the AoA objective. An evaluative commitment, made possible by the framework, ultimately shapes and drives performance by the nature of accoun-tability. Thus, a value of this AoA is that it underpins defensible IT project management.
Disclaimer
The findings and conclusions in this manuscript are those of the author(s) and do not necessarily represent the official position of the US Centers for Disease Control and Prevention.
Acknowledgements
Portions of the paper were written when the first author was an Oak Ridge In-stitute for Science and Education (ORISE) fellow. The analytic framework was developed when the second author was under contract to support the Science Services and Support Project for the Office of the Associate Director for Science. However, the paper was written subsequent to the delivery of those services and was not a contractual deliverable. The authors acknowledge Tyler Higgins for his contributions to earlier drafts of this manuscript.
References
[1] Office of the Associate Director for Science (2012) Science Services Support Project (S3P) Business Case. Centers for Disease Control and Prevention, Atlanta.
[2] Department of Health and Human Services (2016) Policy for Information Tech-nology (IT) Enterprise Performance Life Cycle (EPLC). US Department of Health and Human Services: Office of the Chief Information Officer, Washington DC.
https://www.hhs.gov/sites/default/files/eplc-policy-dec-2016.pdf
[3] Department of Health and Human Services (2008) HHS OCIO Policy for Informa-tion Technology (IT): Enterprise Performance Life Cycle (EPLC). US Department of Health and Human Services: Office of the Chief Information Officer, Washing-ton DC. http://www.hhs.gov/ocio/policy/2008-0004.001.html
[4] Enterprise Performance Life Cycle Framework Workgroup (2010) Enterprise Per-formance Life Cycle Framework: Overview Document. Department of Health and Human Services: Office of the Chief Information Officer, Washington DC.
http://www2.cdc.gov/cdcup/library/hhs_eplc/EPLC_Framework_01-25-10.pdf
[5] Office of Management and Budget (2012) Circular No. A-11: Preparation, Submis-sion, and Execution of the Budget. Executive Office of the President, Office of Management and Budget, Washington DC.
http://www.whitehouse.gov/omb/circulars_a11_current_year_a11_toc
[6] 104th Congress (1996) Clinger-Cohen Act.
[7] Kundra, V. (2010) 25 Point Implementation Plan to Reform Federal Information Technology Management. Office of Management and Budget, Office of E-Government and Information Technology, Washington DC.
DOI: 10.4236/ijcns.2018.116007 130 Int. J. Communications, Network and System Sciences
Provided a Robust Assessment of Weapon System Options. Government Accounta-bility Office, Washington DC. http://www.gao.gov/products/GAO-09-665
[9] Office of Aerospace Studies (2008) Analysis of Alternatives (AoA) Handbook: A Practical Guide to Analyses of Alternatives. Office of Aerospace Studies.
[10] Federal Acquisition Institute (2015) Project Manager’s Guidebook. Federal Acquisi-tion Institute.
https://www.fai.gov/drupal/sites/default/files/FAI-Project-Managers-Guidebook.pdf
[11] Indian Health Services (2008) Managing Capital Investments at the Indian Health Service: A “How-To” Guide for an Analysis of Alternatives. Indian Health Services. [12] US Department of Defense (2015) Operation of the Defense Acquisition System.
http://www.esd.whs.mil/Portals/54/Documents/DD/issuances/dodi/500002_dodi_2
015.pdf?ver=2017-08-11-170656-430
[13] Kundra, V. (2011) Federal Cloud Computing Strategy. Office of Management and Budget, Office of E-Government and Information Technology, Washington DC. [14] Office of Management and Budget, Washington DC (1992) Circular No. A-94:
Guidelines and Discount Rates for Benefit-Cost Analysis of Federal Programs. Of-fice of Management and Budget, Washington DC.
https://www.whitehouse.gov/sites/whitehouse.gov/files/omb/circulars/A94/a094.pdf
[15] Office of Management and Budget (2008) Circular No. A-11 Part 7 Planning, Bud-geting, Acquisition, and Management of Capital Assets. Executive Office of the President, Office of Management and Budget, Washington DC.
http://www.whitehouse.gov/omb/circulars_a11_current_year_a11_toc
[16] United States Government Accountability Office (2012) Information Technology Reform: Progress Made but Future Cloud Computing Efforts Should Be Better Planned. Washington DC. https://www.gao.gov/products/GAO-12-756
[17] Alkhalil, A., Sahandi, R. and John, D. (2017) An Exploration of the Determinants for Decision to Migrate Existing Resources to Cloud Computing Using an Inte-grated TOE-DOI Model. Journal of Cloud Computing, 6, 2.
[18] Cardoso, A., Moreira, F. and Simões, P. (2014) A Survey of Cloud Computing Mi-gration Issues and Frameworks. In: Rocha, A., Correia, A.M., Tan, F.B. and Stroet-mann, K.A., Eds., New Perspectives in Information Systems and Technologies, Vo-lume 1, Springer, Berlin, 161-170.
[19] Elena, G. and Johnson, C.W. (2015) Factors Influencing Risk Acceptance of Cloud Computing Services in the UK Government. International Journal on Cloud Com-puting: Services and Architecture, 5, 1-16.
http://airccse.org/journal/ijccsa/papers/5315ijccsa01.pdf
[20] Figliola, P.M. and Fischer, E.A. (2015) Overview and Issues for Implementation of the Federal Cloud Computing Initiative: Implications for Federal Information Technology Reform Management. US Congressional Research Service (CRS), Washington DC.
[21] Greer, M. (2015) FITARA and FedRAMP: Accelerating Federal Cloud Adoption.
IEEE Cloud Computing, 2, 48-52.https://doi.org/10.1109/MCC.2015.90
[22] Jackson, K.L. (2015) IEEE GovCloud: Making a Difference for Global Governments.
IEEE Cloud Computing, 2, 54-59.https://doi.org/10.1109/MCC.2015.81
DOI: 10.4236/ijcns.2018.116007 131 Int. J. Communications, Network and System Sciences
Institute of Standards and Technology, Gaithersburg.
[25] Stine, K., Kissel, R., Barker, W.C., Fahlsing, J. and Gulick, J. (2008) Volume I: Guide for Mapping Types of Information and Information Systems to Security Categories. NIST Special Publication 800-60 Volume I Revision 1, National Institute of Stan-dards and Technology, Gaithersburg.
[26] Office of Management and Budget (2012) Capital Programming Guide v 3.0: Sup-plement to Office of Management and Budget, Washington DC Circular A-11 Planning, Budgeting, and Acquisition of Capital Assets. Executive Office of the President. Office of Management and Budget, Washington DC.
[27] Government Accountability Office (2009) GAO Cost Estimating and Assessment Guide: Best Practices for Developing and Managing Capital Program Costs. Gov-ernment Accountability Office, Washington DC.
http://www.gao.gov/new.items/d093sp.pdf
[28] Capital Planning and IT Investment Committee (1999) ROI and the Value Puzzle. Federal Chief Information Officers Council.
http://enos.itcollege.ee/~linnar/IT-ROI/roi.pdf
[29] Project Management Institute (2008) A Guide to the Project Management Body of Knowledge (PMBOK Guide). 4th Edition, Project Management Institute, Inc., Newtown Square.
[30] Stauber, B.R., Douty, H.M., Fazar, W., Jordan, R.H., Weinfeld, W. and Manvel, A.D. (1959) Federal Statistical Activities. The American Statistician, 13, 9-12.
https://doi.org/10.1080/00031305.1959.10482609
[31] Project Management Institute (2013) Software Extension to the PMBOK Guide. 5th Edition, Project Management Institute, Inc., Newtown Square.
[32] Enterprise Performance Life Cycle Framework Workgroup (2012) Enterprise Per-formance Life Cycle Framework: Overview Document. Department of Health and Human Services: Office of the Chief Information Officer, Washington DC.
http://www2.cdc.gov/cdcup/library/hhs_eplc/EPLC_Framework_09-18-12.pdf
[33] Kaisler, S., Money, W.H. and Cohen, S.J. (2012) A Decision Framework for Cloud Computing. Proceedings 45th Hawaii International Conference on System Sciences, Hawaii, 1553-1562.https://doi.org/10.1109/HICSS.2012.52
[34] Schank, J.F. (2012) Analysis of Alternatives: Keys to Success. Ninth Annual Acquisi-tion Research Symposium, Graduate School of Business & Public Policy at the Na-val Postgraduate School.
[35] Rhoton, J. (2009) Cloud Computing Explained: Handbook for Enterprise Imple-mentation. Recursive Press, London.
[36] Youseff, L., Butrico, M. and Da Silva, D. (2008) Toward a Unified Ontology of Cloud Computing. Proceedings Grid Computing Environments Workshop, Austin, 12-16 November 2008, 1-10.https://doi.org/10.1109/GCE.2008.4738443
[37] Office of Management and Budget (2012) Implementation Guidance for the Federal Data Center Consolidation Initiative (FDCCI). Executive Office of the President, Office of Management and Budget, Washington DC.
https://www.whitehouse.gov/sites/whitehouse.gov/files/omb/assets/egov_docs/cio_
memo_fdcci_deliverables_van_roekel_3-19-12.pdf
[38] Office of Management and Budget (2015) Management and Oversight of Federal Information Technology. Executive Office of the President, Office of Management and Budget, Washington DC.
DOI: 10.4236/ijcns.2018.116007 132 Int. J. Communications, Network and System Sciences
5-14.pdf
[39] 113th Congress (2104) Federal Information Technology Acquisition Reform. US Government Publishing Office, Washington DC.
[40] Obama, B. (2009) Transparency and Open Government: Memorandum for the Heads of Executive Departments and Agencies. The White House, Washington DC.
https://obamawhitehouse.archives.gov/the-press-office/transparency-and-open-gov ernment
[41] Fenn, J. (2008) Understanding Gartner’s Hype Cycles, 2008.
![Figure 1. CDC adaptation of the DHHS EPLC framework [3].](https://thumb-us.123doks.com/thumbv2/123dok_us/9283886.422409/3.595.80.537.73.439/figure-cdc-adaptation-dhhs-eplc-framework.webp)