http://www.scirp.org/journal/aim ISSN Online: 2165-3410
ISSN Print: 2165-3402
DOI: 10.4236/aim.2017.711061 Nov. 28, 2017 760 Advances in Microbiology
Establishment and Application of Digital
RT-PCR Assay for Detection of Avian
Influenza Virus H9 Subtype
Bin Wu
1*, Lin Zhang
1, Liming Su
2, Huijun Zhao
1, Xiaoping Cai
11Liaoning Entry-Exit Inspection and Quarantine Bureau, Dalian, China 2China Certification & Inspection Group Liaoning Co. Ltd., Dalian, China
Abstract
A digital RT-PCR method for rapid detection of H9 subtype influenza was es-tablished by comparing the two methods of digital RT-PCR and real-time quantitative RT-PCR. The sensitivity, specificity and reproducibility of the two methods for H9 were determined by gradient dilution using the same pair of primers and probes. Both methods were able to detect 104 times diluted H9
pathogens, while digital RT-PCR could detect H9 in single droplets, and its sensitivity was higher than real-time quantitative RT-PCR. At the same time, the specificities of both methods were very strong, with no amplification reac-tions for H3N2, H4N2, H6N2. The reproducibility of the two methods were also good. Digital RT-PCR has a higher sensitivity than real-time quantitative RT-PCR and could play an important role in the rapid detection of H9 sub-type influenza virus.
Keywords
Avian Influenza Virus H9 Subtype (H9), Digital RT-PCR, Real-Time Quantitative RT-PCR, Sensitivity, Specificity
1. Introduction
Avian influenza (AI) is a highly contagious avian influenza disease caused by the orthomyxovirus class A influenza virus, with 16 HA subtypes and 10 NA sub-types [1]. According to the avian influenza virus (Avian influenza virus, AIV), pathogenicity can be divided into highly pathogenic avian influenza and low pa-thogenic avian influenza virus [2]. H9 subtype low pathogenic AIV (hereinafter referred to as H9) is widely found in China’s Liaoning, Anhui, Shandong,
How to cite this paper: Wu, B., Zhang, L., Su, L.M., Zhao, H.J. and Cai, X.P. (2017) Establishment and Application of Digital RT-PCR Assay for Detection of Avian In-fluenza Virus H9 Subtype. Advances in Microbiology, 7, 760-768.
https://doi.org/10.4236/aim.2017.711061
Received: October 9, 2017 Accepted: November 25, 2017 Published: November 28, 2017
Copyright © 2017 by authors and Scientific Research Publishing Inc. This work is licensed under the Creative Commons Attribution International License (CC BY 4.0).
DOI: 10.4236/aim.2017.711061 761 Advances in Microbiology
Guangdong, Fujian, Jiangsu, Henan, Hunan, Hubei, Shanghai, Guangxi, Yun-nan, Sichuan, Xinjiang and other regions [3], so it is very important to detect and diagnose it.
As a novel nucleic acid detection method, digital PCR (dPCR) technology in-dependently performs PCR reactions by dividing the reaction system into a large number of reaction units and calculating the number of nucleic acids according to the Poisson distribution and the positive ratio [4].
Currently, there are two kinds of digital PCR tests, droplets and chip. Unlike traditional quantitative PCR techniques, dPCR is independent of the circula-tory threshold (CT) of the amplification curve and is not affected by amplifica-tion efficiency, with good accuracy and reproducibility, and can achieve abso-lute quantitative analysis [5]. In this paper, dRT-PCR was established by com-paring the sensitivity, specificity and reproducibility of dRT-PCR and real-time quantitative RT-PCR (qRT-PCR), and it was applied to the detection of actual samples, so as to achieve rapid detection of H9 subtype low patho-genic avian influenza.
2. Materials and Methods
2.1. Materials
2.1.1. Virus and Samples
The viruses used in the experiments (H9 subtype, influenza virus, H3N2 subtype influenza virus, H4N2 subtype influenza virus, H6N2 subtype influenza virus), and clinical samples were all preserved in our laboratory.
2.1.2. Instruments and Reagents
Real time fluorescence quantitative RT-PCR: Roche’s production of LC4800, Real-time, RT-PCR, System;
Digital RT-PCR: QX200Droplet, Generator, PX1, RT-PCR, Sealer, S1000, Thermal, Cycler, QX200, Droplet, Reader, Plate produced by Bole company;
One step prime script RT-PCR Kit (perfect real time) Kit: from treasure bio-logical company;
One-step RT-ddRT-PCR kit for probes Kit: bought from Bole company.
2.2. Method
2.2.1. Primers and Probes (See Table 1) 2.2.2. Extraction of RNA
TaKaRa RNA extraction kit was used to extract H9 virus RNA. After extraction, RNA was used as the original template and diluted 10−1, 10−2, 10−3, 10−4, 10−5,
10−6, 10−7, 10−8 imes, respectively, and stored in −20˚C refrigerator.
2.2.3. dRT-PCR—Determination of Annealing Temperature
DOI: 10.4236/aim.2017.711061 762 Advances in Microbiology
Table 1. The sequence of H9 PRIMERS AND Taqman probe.
Name Sequence
Forward primer 5’-CCATTGRACATRGCCCAG-3’
Reverse primer 5’-CYATTTATTCGACTGTCGCCTC-3’
[image:3.595.201.541.200.377.2]TaqMan probe 5’–(FAM)-FRGAAGGCAGCRAACCCCATTGCAAP-(TAMRA)-3’
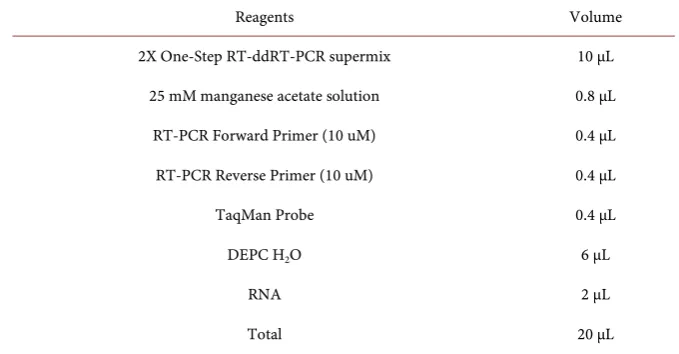
Table 2. The reaction system of digital RT-PCR assay.
Reagents Volume
2X One-Step RT-ddRT-PCR supermix 10 μL
25 mM manganese acetate solution 0.8 μL
RT-PCR Forward Primer (10 uM) 0.4 μL
RT-PCR Reverse Primer (10 uM) 0.4 μL
TaqMan Probe 0.4 μL
DEPC H2O 6 μL
RNA 2 μL
[image:3.595.207.538.407.562.2]Total 20 μL
Table 3. The reaction conditions of digital RT-PCR assay.
Temperature Time Cycle
60˚C 30 min
95˚C 5 min
94˚C 20 s
6
60˚C 35 s
94˚C 20 s
36
50˚C - 60˚C 35 s
98˚C 10 min 1
12˚C ∞ 1
2.2.4. qRT-PCR Test
A qRT-PCR method for the determination of H9 × 100, 10−1, 10−2, 10−3, 10−4, 10−5,
10−6, H3N2, H4N2, H6N2, NTC (H
2O) amplification curve and Ct value,
re-peated three times.
2.2.5. dRT-PCR Test
The sensitivity and specificity of the dRT-PCR method for H9 were determined, wherein the specificity test was controlled by H3N2, H4N2, H6N2, according to
DOI: 10.4236/aim.2017.711061 763 Advances in Microbiology 2.2.6. Detection of Samples
Select the appropriate samples and validate them using the above two methods (2.2.4, 2.2.5).
2.2.7. Data Analysis
After the amplification of dRT-PCR reaction, Droplet Reader was used to read the results, and to judge the presence of amplified droplets as the basis, and to analyze the. qRT-PCR response data, and to determine the result by looking at the amplification curve and Ct value.
3. Results and Analysis
3.1. Determination of Annealing Temperature at dRT-PCR
The amplification of temperature at 50˚C - 60˚C (0.5˚C) was measured. The re-sults showed that when the annealing temperature was 59˚C, the amplification reaction could occur. Therefore, the annealing temperature of the primer was 59˚C.
3.2. Sensitivity Analysis
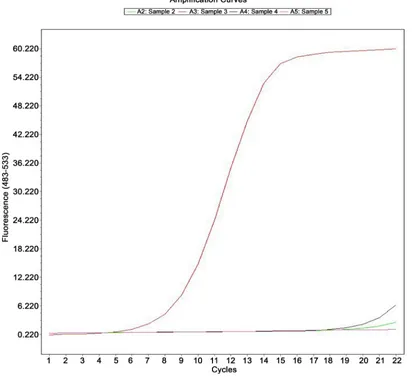
3.2.1. Sensitivity of qRT-PCRH9 RNA will be diluted 10 times, were detected by qRT-PCR. The results showed that (see Figure 1): the concentration of template 100, 10−1, 10−2, 10−3,
10−4, 10−5, 10−6 in the range of 7 orders of magnitude, the growth curve of
qRT-PCR were “S” type, and the exponential growth period of qRT-PCR curve are almost parallel, reflect the amplification efficiency of similar template × 10−5,
10−6 Ct value is greater than 28, similar to the blank control group, Ct value, so
the detection sensitivity for the original template × 10−4.
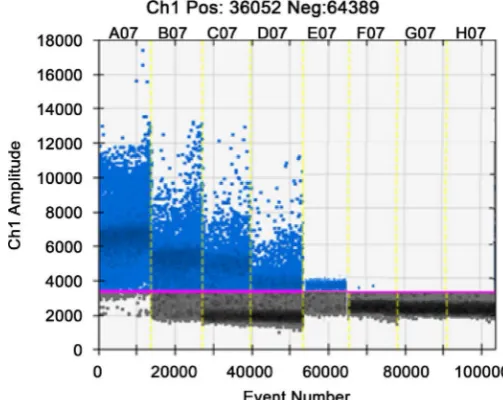
3.2.2. Sensitivity of dRT-PCR
The H9 RNA template 10 times dilution series, dRT-PCR detection. Read each dilution was amplified from Figure 2 can droplet number, with increasing dilu-tion the amplificadilu-tion gradually decreased from 100 to10−4. The number of
am-plified were 3980, 406.3, 60.4, 8.9, 2.2 copies/μL, from the10−5 dilution started
close to the amount of amplification, and in 0 - 1 copies/μL, although the con-tent of the H9 template is very few, but can still detect pathogens.
3.3. Specificity Analysis
3.3.1. The Specificity of qRT-PCRH9 were extracted from H3N2, H4N2, H6N2, RNA, qRT-PCR were detected. The results showed that the amplification curve of H9 is “S” (see Figure 3), while H3N2, H4N2, H6N2 is not a typical “S” shape amplification curve showed that H3N2, H4N2, H6N2 were therefore selected primers amplification. The probe and specificity of H9 is good.
3.3.2. The Specificity of dRT-PCR
DOI: 10.4236/aim.2017.711061 764 Advances in Microbiology Note: Sample A2-A7 represent the original template 100, 10−1, 10−2, 10−3, 10−4, 10−5, 10−6, Sample A2 is blank control.
Figure 1. Amplification plot of real-time RT-PCR assay for the detection of H9.
Note: A07-G07 represent the original template 100, 10−1, 10−2, 10−3, 10−4, 10−5, 10−6, H07: blank control.
[image:5.595.169.421.490.690.2]DOI: 10.4236/aim.2017.711061 765 Advances in Microbiology Note: Sample A2: H9 Sample A3: H3N2 Sample A4: H4N2 Sample A5: H6N2.
Figure 3. Specificity test of real-time RT-RT-PCR assay for H9.
Note: A06: H9 B06: H3N2 C06: H4N2 D06: H6N2.
[image:6.595.165.430.494.692.2]DOI: 10.4236/aim.2017.711061 766 Advances in Microbiology
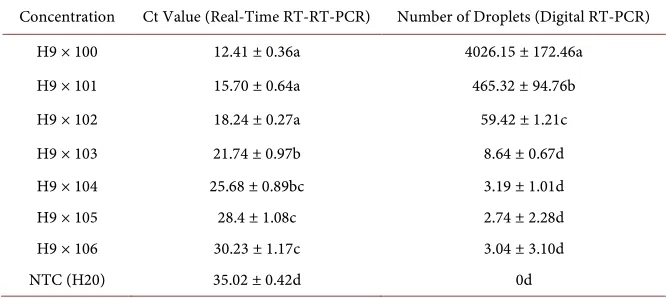
Table 4. The repeatability of Real-time RT-PCR and Digital RT-PCR (mean ± SE).
Concentration Ct Value (Real-Time RT-RT-PCR) Number of Droplets (Digital RT-PCR)
H9 × 100 12.41 ± 0.36a 4026.15 ± 172.46a
H9 × 101 15.70 ± 0.64a 465.32 ± 94.76b
H9 × 102 18.24 ± 0.27a 59.42 ± 1.21c
H9 × 103 21.74 ± 0.97b 8.64 ± 0.67d
H9 × 104 25.68 ± 0.89bc 3.19 ± 1.01d
H9 × 105 28.4 ± 1.08c 2.74 ± 2.28d
H9 × 106 30.23 ± 1.17c 3.04 ± 3.10d
NTC (H20) 35.02 ± 0.42d 0d
the specificity of H9 is better, a large number of droplets occurred in the ampli-fication reaction, while the other three kinds of virus H3N2, H4N2, H6N2 were only 0.23, 0.15, 0.27 copies/μL, can be neglected.
3.4. Reproducibility Analysis
Through the 8 test dRT-PCR and qRT-PCR reproduce the reproducibility of the results obtained, as shown in Table 4. Table 4 shows, 8 small reproduction error test, the test of good reproducibility. The qRT-PCR Ct values of 8 replicates standard error smaller between 0.36 - 1.17, standard error dRT-PCR; droplet number 8 replications is less than the total droplet number (total droplet num-ber Droplet Reader read 2000/μL) 2.4%, good reproducibility.
3.5. Clinical Samples Were Detected
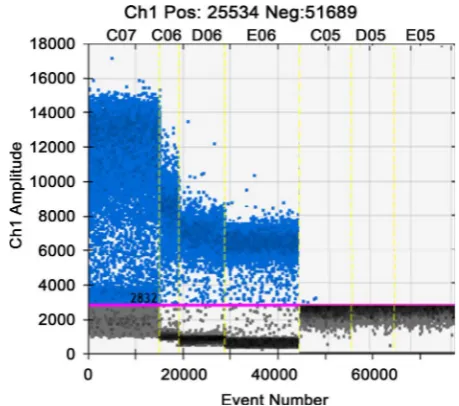
3.5.1. Detection of Samples by dRT-PCRThe dRT-PCR method was used to detect the sample to be detected by H9, RNA, RNA Health Organization, water as a positive control, negative control and blank control. The results showed that samples were amplified, samples con-taining H9 pathogens, see Figure 5.
3.5.2. Detection of Samples by qRT-PCR
The qRT-PCR method was used to detect samples with H9, RNA, RNA Health Organization, water were used as positive control, negative control and blank control. 1 H9 and RNA 2, 3, 4 were observed in the sample of “S” type amplifica-tion curve, showed detectable H9 H9.5 in sample, see Figure 6.
4. Discussion
DOI: 10.4236/aim.2017.711061 767 Advances in Microbiology Note: 1: H9 RNA, 2 - 5: sample, 6: negative control, 7: blank control.
Figure 5. Amplification plot of real-time RT-RT-PCR samples with H9.
Note: C07: H9 RNA, C06-C05: sample, D05: negative control, E05: blank control.
[image:8.595.182.412.490.693.2]DOI: 10.4236/aim.2017.711061 768 Advances in Microbiology
5. Conclusion
In this paper, by comparison of the two methods of qRT-PCR and dRT-PCR, the following conclusions can be drawn: dRT-PCR is more sensitive than qRT-PCR and can detect the target gene in single droplet, and can detect trace pathogen, which is more widely used than qRT-PCT method. The designed primers and probes are specific and have only amplification reaction to H9 and can be used for daily H9 detection. Compared with qRT-PCR, dRT-PCR reproducibility is higher, and can be used as a confirmation method in routine testing.
References
[1] Zhou, J.P. and Liu, J. (2010) Investigation of H9 Subtype Avian Influenza Virus in Live Poultry Wholesale Market in Shanghai. Chinese Journal of Animal Infectious Diseases, 18, 31-33.
[2] Chen, A. and Zhang, Z.J. (1994) Research on Avian Influenza: Chicken I A Avian Influenza Virus Isolation and Identification of Serological. Chinese Veterinary Journal, 22, 3-5.
[3] Wu, H.Y., Li, M.Y., et al. (2010) Special Study on Molecular Epidemiology of 33 Strains of H9 Subtype Avian Influenza Virus. China Animal Quarantine, 27, 31-33. [4] Zhan, C., Yan, L., et al. (2015) Development and Application of Digital PCR
Tech-nology. Journal of Fudan University, 42, 785-789.
[5] Lin, C.Q. and Yao, B. (2012) Advances in Digital PCR Technology. Advances in Chemistry, 24, 2415-2422.