2017, Volume 4, e4094 ISSN Online: 2333-9721 ISSN Print: 2333-9705
DOI: 10.4236/oalib.1104094 Nov. 30, 2017 1 Open Access Library Journal
Seismic Source Modeling
in the Shores of
Western Makran
Mahdi Modiri
1*, Amir Barzegari
2, Amir Sahebalzamani
3, AbdolReza Hashemi
41Malek-Ashtar University of Technology,Shiraz, Iran 2North Tehran Branch of Azad University, Tehran, Iran 3Iran University of Science and Technology, Tehran, Iran 4Tarbiat Moallem University, Tehran, Iran
Abstract
Makran is an active subduction zone with a lower activity rate in comparison with other similar subduction zones. In the extent of Makran seismotectonic province, from coastline up to 70 Km distance onshore, the earthquakes are shallow whilst further inland, focal depths of the earthquakes are deeper. Considering the low seismic activity rate, lack of adequate and reliable seismic data and uncertainty about earthquake hazard contribution ratio of subduc-tion segments and faults, it is intended in this article to determine the most accurate method of seismic source modelling. Estimation of the maximum strong ground motion in this province has been assessed by assuming various combinations of activity rate contribution ratios, i.e. independent activity of either subduction source or faults or simultaneous activity of subduction source and faults. According to the obtained results, the maximum and min-imum limits of the strong ground motion acceleration is related to the inde-pendent seismic activity models and when subduction source and faults are assumed to be contributing simultaneously to the activity rate of the region, the resultant ground motion acceleration will be between the limits obtained based on independent activity models.
Subject Areas
Geophysics
Keywords
Hazard Analysis, Makran Coast, Maximum Acceleration of Strong Ground Motion, Subduction Zone, Sistan and Balouchestan
How to cite this paper: Modiri, M., Barzegari, A., Sahebalzamani, A. and Hashemi, A. (2017) Seismic Source Modeling in the Shores of Western Makran. Open Access Library Journal, 4: e4094.
https://doi.org/10.4236/oalib.1104094
Received: October 30, 2017 Accepted: November 27, 2017 Published: November 30, 2017
Copyright © 2017 by authors and Open Access Library Inc.
This work is licensed under the Creative Commons Attribution International License (CC BY 4.0).
DOI: 10.4236/oalib.1104094 2 Open Access Library Journal
1. Introduction
According to historic and prehistoric evidences, Iran has been struck by many massive earthquakes owing to its location (Alp-Himalaya mountainous belt) and as a result of these earthquakes, many civilizations with thousands of years his-torical backgrounds were eradicated including Komes civilization located in modern day Seimare which was destroyed under heavy impact of the 7.6 surface wave magnitude earthquake at December 22th 856 AD [1]. In recent years, mas-sive earthquakes with surface waves magnitude greater than 6 happened in some parts of Iran including Bam and Zarand in Kerman province, Varzaghan in east Azerbaijan province and Saravan in Sistan and Balouchestan province which were generated due to activities of uncertainly identified faults and also hidden faults, have clearly shown the need for further investigation of the faults along with more hazard analysis assessments. The studied area includes shorelines which are very important especially from geopolitical, geostrategic and geo-economic vantage point. The registered seismic events in Makran zone and Oman sea along with the tsunami event [2] of November 27th 1945 in the Makran coast (with magnitude of 8.2) [1] are proof for unsafety of the region against seismic activities and tsunami hazard.
This region is located in the Makran seismotectonic province, the northern side of which leads to Jazmoorian subsidence, the western side of it is identified with Minab faults, the southern extent ends in Oman sea and the eastern side leads to Pakistan border, albeit it continues after the border (Figure 1) [3]. To-wards the northern part of this zone, there are faults and thrusts with east-ern-western trend of which Beshagerd fault is the most important. Along the di-rection of these fractures, colorful mixtures with extended outcrops are evident. The eldest rocks of this zone are these colorful mélanges which are related to upper cretaceous-Paleocene, after them are thick flysch like sediments of Eocene and Oligocene which are comprised of sandstone, shill and marl sequence and are placed on the aforementioned colorful mixtures and their thickness could be as much as 5000 meters. These sediments were folded before the start of Mi-ocene era and Neogene sediment thickness is large and is around 5000 meters. From geological point of view, reference [4], believes that this mountain range is an ancient crust gap which in the form of a side extending prism, from lower cretaceous or lower tertiary to Holocene, located in the upper wall of a shallow mildly dipped subduction zone. In an overall view, height of this mountain range decreases from north to south.
2. Makran Stratigraphy
DOI: 10.4236/oalib.1104094 3 Open Access Library Journal
Figure 1. Plan of Iran major faults [5]. The blue hatched box is showing the studied area.
sediments or sometimes pseudo molasses which could be as thick as 10 thousand meters [6]. In the northern part of the Makran region, oceanic crust and upper cretaceous pelagic sediments have outcrops but are covered by or mixed with flysch rows of upper cretaceous-Eocene. In the middle extent of Makran, Oligo-cene flysches are covered by numerous parallel multi-dipped inter-formations and an angular multi-dipped upper layer. The youngest Makran sediments con-sist of loose weak cementite sandstones with the age of plié-Pleistocene.
3. Tectonics
DOI: 10.4236/oalib.1104094 4 Open Access Library Journal
Figure 2. Movement mechanism in Makran longitudinal faults and converging faults. (a)
the couple convergent strike slip fault groups; (b) reverse and thrust faults simultaneous with folding [7].
were normal in the beginning when they were generated at the time of basin formation; however, under thrusting regimes which were later imposed on them, they turned into thrusting faults with steep dips directed towards north and northeast. The conjugate faults could be classified into two groups based on their trend and mechanism. The first group has northwest trend and dextral strike slip mechanism. The second group has northeast trend and sinistral strike slip me-chanism. Normal faults which could be seen in the Makran coast. Their creation time has been identified as quaternary and it has been accepted that linearity of the marine terrace northern margin and also elevation of the Makran coasts are results of these faults activities and the vertical movement of these faults have led to formation of the marine terraces in different levels [7].
4. Seismicity
Regarding seismic activity, Makran could be divided into two parts, eastern and western. Owing to descending plate, the eastern side has been struck by earth-quakes with magnitudes ranging from middle to high and middle to surface foc-al depths (e.g. earthquakes of the years 1765, 1851, 1945) whereas no earthquake has been recorded in the coastal zone of the western Makran except maybe for the massive earthquake of 1483 [1] [8] for which there are no concrete evidence available.
Makran as an active subduction zone generally has a very weak seismicity po-tential. Reference [9] attributes the absence of earthquake events in the western Makran, to the presence of huge amounts of non-stiffened saturated sediments which have low internal friction angle and therefore they do not have seismic ac-tivity. However, presence of marine terraces and 9 mud volcanos is a proof for dynamicity of this region, an evidence of which is the Pasty Urama earthquake of 1945 with the magnitude of 8.3 [1].
5. Seismic Sources
DOI: 10.4236/oalib.1104094 5 Open Access Library Journal results have been used. In addition to identification of linear seismic sources, subduction zones have been studied as well. The obtained results indicate that there are 81 linear seismic sources along with three subduction zones present in the studied area which contribute to seismic activity of the region, the characte-ristics of which are presented in the Table 1 and Table 2.
The linear seismic sources of the studied region have different mechanism as well as dip directions in the way that close to the coast, faults generally have normal mechanisms with dip direction towards the south and in the northern parts which have mountain formation, faults generally have reverse mechanisms with dip direction towards the north.
According to the presence of Kuh Sultan volcano (Pakestan), Taftan and Bazman volcanos (Iran), various researchers have come to conclusion that cending plate has ruptured during the subduction process and each part is des-cending into the mantle separately and under different conditions [10] [11]. According to the above explanation and carried out explorations, three subduc-tion zones A, B and C have been identified in the studied area as influencing the region which are introduced as follows.
Zone A: this zone comprises the western boundary of the studied area and due to mild slope (below 10 degrees) of the descending plate, it does not have the volcanic dynamism. In the studied area an extent as large as 29255 square kilo-meter is affected by this zone [12].
Zone B: slope of this descending plate is estimated to be about 38 - 50 degrees and unlike Zone A, it has volcanic activity. Due to stark difference between focal depths of earthquakes recorded in the extent of this zone, it has been divided to two segments B1 and B2. Segment B1 includes the extent between surface trace of Makran deformation fault and the line parallel to the shoreline at the distance of 70 kilometers. Area of this segment is 93,612 square kilometers. In this seg-ment, earthquake focal depths are generally shallow. Segment B2 has been sepa-rated from segment B1 due to having deeper focal depths and the northern boundary of this extent ends in the volcanic arc. Area of this seismic segment in the studied region is 3578 square kilometers [12].
Zone C: like zone B, this zone has volcanic activity as well and constitutes the eastern part of the studied area. Descending plate dip in this extent is estimated to be about 19 - 28 degrees [12].
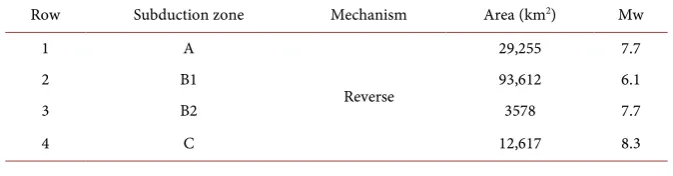
[image:5.595.204.541.642.730.2]It should be noted that based on the assembled earthquake catalogue of the
Table 1. Subduction zones available in the studied region along with their respective
areas and mechanisms.
Mw Area (km2)
Mechanism Subduction zone
Row
7.7 29,255
Reverse A
1
6.1 93,612
B1 2
7.7 3578
B2 3
8.3 12,617
DOI: 10.4236/oalib.1104094 6 Open Access Library Journal
Table 2. Faults available in the studied region with length greater than 10 kilometer,
along with their respective lengths and mechanisms (N: normal fault, R: reverse or thrust fault, S: strike slip fault).
Length of fault (Km) Dip Direction Mechanism Faults Name Row 19 S-SW R Ahvan 1 12 - S Band_e_kalaf 2 53 NE-NW T Bashakerd 1 3 26 N-NE-NW R Bashakerd 2 4 57 N-NE-NW R Bashakerd 3 5 28 N R Bashakerd 4 6 22 Sw-S-SE N Bir 1 7 109 NW T Chan Khan 1
8
150 N-NW
T Chan Khan 2
9 162 N-NW-NE T Chanf 10 19 S-SW-SE N Chekkeh 11 16 SE N Cheshmeh_reshki 12 35 NE R Dar Anar 13 17 - S Darhaman Fault 14 32 S R Darmail1 15 35 SW R Darmail2 16 31 SW T Dazi Fault 17 26 NE R De_gonir 18 12 Sw N Durky 19 13 SW N East Sahran 20 92 N-NW T Firuz Abad 1
21
47 N-NW
T Firuz abad 2
22 26 N-NE-NW R Gabik 23 53 NE R Gabrik 24 49 N-NE-NW R Gahmuh 25 56 N-NE-NW R Gakosh 26 36 N-NW-NE R Garu Char 27 168 N-NW T Gativan 1 28 71 NE-NW T Gativan 2 29 13 S N Gative 30 11 SE N Gava 31 40 N R Gaz 32 11 Sw N Gazidir 33 15 - S Geeshkan 34 92 N-NW T Ghasre Ghand 1
DOI: 10.4236/oalib.1104094 7 Open Access Library Journal Continued
84 N-NW
T Ghasr Ghand 2
36
91 N-NW
T Ghasre Ghand 3
DOI: 10.4236/oalib.1104094 8 Open Access Library Journal Continued
11 S
N Sedich
74
12 S-SE-Sw
N Shame sar
75
25 S
N Shoski
76
10 E
S Siromch
77
10 W-SW
N Sohran
78
30 N-N-NE
R Veranj
79
11 SW
N Zaur
80
72 S-SE-Sw
N Zirdan
[image:8.595.60.544.78.568.2]81
Figure 3. Plan of linear and are seismic sources in the studied area.
region, the maximum magnitude of earthquakes recorded in the subduction zones A, B1, B2 and C is 7.7, 6.1, 7.7 and 8.1 respectively.
6. Modelling
DOI: 10.4236/oalib.1104094 9 Open Access Library Journal different approaches have been considered. The first approach is to attribute all the earthquakes happened in the region to the surface faults. Based on this as-sumption, the activity rate obtained from analysis of the earthquake catalogue is completely assigned to the linear seismic sources. The second approach is related to the subduction zone and all earthquakes have been attributed to it and there-fore, the calculated activity rate is assigned to the subduction model. On the other hand, should the activity rate be divided between subduction model and surface faults with different ratios, the values of the maximum strong ground motion will be between the values obtained using two aforementioned ap-proaches. Results of this assessment are investigated in 12 points inside the stu-died area (Figure 4) and the criterion behind selection of these points was to span all northern, middle and southern parts of the studied area (Figures 5-16 and Tables 3-14). According to the investigation results, in some parts of the re-gion, linear seismic sources are sparse which results in higher maximum strong motion values in comparison with surface faulting model (southern to middle extent). However, in close proximity of the faults, surface faulting model (northern extent) yields higher values. It should be noted that in the tables pre-sented in this article, contribution ration percentage of two seismic models are
DOI: 10.4236/oalib.1104094 10 Open Access Library Journal
Table 3. Results of surface faulting and subduction models along with the intermediate
state for Gwadar Port.
1 Gwadar Port
500 1000 2000
0% 0.37389 0.50414 0.65716
10% 0.35602 0.48263 0.63128
20% 0.33699 0.45914 0.60348
30% 0.31665 0.4339 0.57344
40% 0.29396 0.40648 0.54061
50% 0.26684 0.37396 0.5042
60% 0.23704 0.33702 0.45915
70% 0.19745 0.28791 0.39811
80% 0.15786 0.23717 0.33706
90% 0.10303 0.15887 0.23744
100% 0.03958 0.05132 0.06346
[image:10.595.209.539.553.726.2]Figure 5. Interaction of subduction and surface fault effects in Gwadar port.
Table 4. Results of surface faulting and subduction models along with the intermediate
state for Chabahar city.
2 Chabahar
500 1000 2000
0% 0.37856 0.5084 0.66182
10% 0.3607 0.48738 0.63595
20% 0.34171 0.4639 0.60816
30% 0.32143 0.4387 0.57815
40% 0.29953 0.41135 0.54537
50% 0.27271 0.3795 0.50905
60% 0.24344 0.34291 0.46475
70% 0.20618 0.2906 0.40486
80% 0.16891 0.2463 0.34496
90% 0.12261 0.1784 0.2531
DOI: 10.4236/oalib.1104094 11 Open Access Library Journal
[image:11.595.207.541.324.704.2]Figure 6. Interaction of subduction and surface fault effects in Chabahr city.
Table 5. Results of surface faulting and subduction models along with the intermediate
state for Lirdaf Port.
3 Lirdaf Port
500 1000 2000
0% 0.37414 0.50347 0.65559
10% 0.35723 0.48283 0.63064
20% 0.33935 0.46048 0.60394
30% 0.32041 0.43662 0.57524
40% 0.30018 0.41093 0.54409
50% 0.27583 0.38142 0.50987
60% 0.24974 0.34807 0.46893
70% 0.21976 0.30713 0.41642
80% 0.18978 0.26618 0.36391
90% 0.15278 0.2142 0.29252
100% 0.1161 0.15353 0.20268
DOI: 10.4236/oalib.1104094 12 Open Access Library Journal
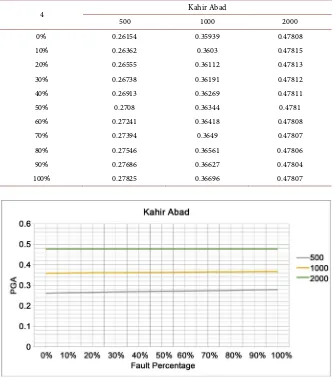
Table 6. Results of surface faulting and subduction models along with the intermediate
state for Kahir Abad.
4 Kahir Abad
500 1000 2000
0% 0.26154 0.35939 0.47808
10% 0.26362 0.3603 0.47815
20% 0.26555 0.36112 0.47813
30% 0.26738 0.36191 0.47812
40% 0.26913 0.36269 0.47811
50% 0.2708 0.36344 0.4781
60% 0.27241 0.36418 0.47808
70% 0.27394 0.3649 0.47807
80% 0.27546 0.36561 0.47806
90% 0.27686 0.36627 0.47804
100% 0.27825 0.36696 0.47807
[image:12.595.209.539.541.726.2]Figure 8. Interaction of subduction and surface fault effects in Kahir Abad.
Table 7. Results of surface faulting and subduction models along with the intermediate
state for Chanf city.
5 Chanf
500 1000 2000
0% 0.26663 0.37 0.49596
10% 0.27205 0.37544 0.5019
20% 0.27715 0.38064 0.50732
30% 0.28201 0.38568 0.51265
40% 0.28667 0.39059 0.51792
50% 0.29113 0.39535 0.52311
60% 0.29542 0.39999 0.52824
70% 0.29936 0.4042 0.53327
80% 0.3033 0.4084 0.53829
90% 0.30693 0.4125 0.54322
DOI: 10.4236/oalib.1104094 13 Open Access Library Journal
[image:13.595.206.541.310.717.2]Figure 9. Interaction of subduction and surface fault effects in Chanf city.
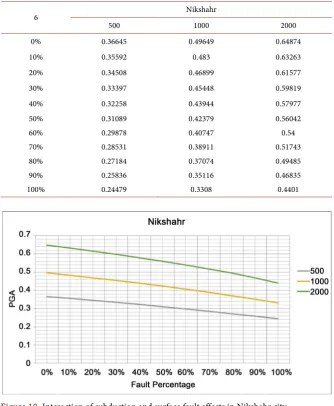
Table 8. Results of surface faulting and subduction models along with the intermediate
state for Nikshahr city.
6 Nikshahr
500 1000 2000
0% 0.36645 0.49649 0.64874
10% 0.35592 0.483 0.63263
20% 0.34508 0.46899 0.61577
30% 0.33397 0.45448 0.59819
40% 0.32258 0.43944 0.57977
50% 0.31089 0.42379 0.56042
60% 0.29878 0.40747 0.54
70% 0.28531 0.38911 0.51743
80% 0.27184 0.37074 0.49485
90% 0.25836 0.35116 0.46835
100% 0.24479 0.3308 0.4401
[image:13.595.207.539.319.706.2]DOI: 10.4236/oalib.1104094 14 Open Access Library Journal
Table 9. Results of surface faulting and subduction models along with the intermediate
state for Pishin city.
7 Pishin
500 1000 2000
0% 0.35745 0.48709 0.63929
10% 0.34411 0.47002 0.61856
20% 0.33025 0.45215 0.59671
30% 0.31587 0.43346 0.5737
40% 0.30094 0.41385 0.54933
50% 0.28354 0.39254 0.5234
60% 0.26552 0.36872 0.49517
70% 0.24668 0.34293 0.46105
80% 0.22784 0.31714 0.42692
90% 0.20834 0.288 0.3876
100% 0.18717 0.25593 0.34281
[image:14.595.209.539.554.726.2]Figure 11. Interaction of subduction and surface fault effects in Pishin city.
Table 10. Results of surface faulting and subduction models along with the intermediate
state for Nour Abad.
8 Nour Abad
500 1000 2000
0% 0.25252 0.34915 0.46639
10% 0.27169 0.36969 0.48897
20% 0.28857 0.38803 0.50866
30% 0.30341 0.4044 0.52605
40% 0.31598 0.41872 0.5423
50% 0.32763 0.43209 0.5576
60% 0.33853 0.44466 0.57206
70% 0.34852 0.45624 0.58548
80% 0.3585 0.46782 0.5989
90% 0.36774 0.47858 0.61144
DOI: 10.4236/oalib.1104094 15 Open Access Library Journal
[image:15.595.209.539.319.707.2]Figure 12. Interaction of subduction and surface fault effects in Nour Abad.
Table 11. Results of surface faulting and subduction models along with the intermediate
state for Remeshk city.
9 Remeshk
500 1000 2000
0% 0.25359 0.34905 0.46439
10% 0.25799 0.35364 0.4697
20% 0.2622 0.35807 0.47485
30% 0.26625 0.36239 0.47993
40% 0.27017 0.36661 0.48491
50% 0.27397 0.37073 0.48982
60% 0.27765 0.37477 0.49465
70% 0.28812 0.37868 0.49924
80% 0.2847 0.38259 0.50383
90% 0.28808 0.38638 0.50816
100% 0.29149 0.39024 0.51263
[image:15.595.206.540.323.705.2]DOI: 10.4236/oalib.1104094 16 Open Access Library Journal
Table 12. Results of surface faulting and subduction models along with the intermediate
state for Jask Port.
10 Jask Port
500 1000 2000
0% 0.3402 0.46666 0.61653
10% 0.32428 0.44658 0.59236
20% 0.30753 0.42528 0.56658
30% 0.28845 0.40257 0.5389
40% 0.2673 0.3761 0.5089
50% 0.24498 0.34735 0.47357
60% 0.22128 0.31608 0.43355
70% 0.19348 0.27781 0.3859
80% 0.16529 0.23759 0.33154
90% 0.13538 0.191 0.26353
100% 0.1073 0.14073 0.18458
[image:16.595.208.538.548.735.2]Figure 14. Interaction of subduction and surface fault effects in Jask port.
Table 13. Results of surface faulting and subduction models along with the intermediate
state for Jagin city.
11 Jagin
500 1000 2000
0% 0.35843 0.48723 0.6387
10% 0.34699 0.47214 0.62008
20% 0.33528 0.45654 0.60067
30% 0.32333 0.44042 0.5804
40% 0.31112 0.42374 0.55918
50% 0.29849 0.40644 0.53689
60% 0.28442 0.38755 0.51339
70% 0.26851 0.36572 0.48561
80% 0.25622 0.34711 0.45919
90% 0.24221 0.32617 0.42943
DOI: 10.4236/oalib.1104094 17 Open Access Library Journal
[image:17.595.204.541.321.709.2]Figure 15. Interaction of subduction and surface fault effects in Jagin city.
Table 14. Results of surface faulting and subduction models along with the intermediate
state for Apsi Khan City.
12 Apsi Kahn
500 1000 2000
0% 0.25924 0.3654 0.49597
10% 0.24649 0.34876 0.4748
20% 0.23331 0.33129 0.45237
30% 0.21971 0.31293 0.42853
40% 0.20568 0.29283 0.40302
50% 0.18995 0.27031 0.37357
60% 0.17346 0.24688 0.34168
70% 0.15735 0.222 0.3047
80% 0.14124 0.19712 0.26771
90% 0.12611 0.16997 0.22638
100% 0.11209 0.14383 0.18456
[image:17.595.206.542.324.705.2]DOI: 10.4236/oalib.1104094 18 Open Access Library Journal indicated based on surface faulting model contribution, meaning that when it is set to zero percent, subduction model contribution is 100 percent. In order to conduct the maximum strong ground motion value hazard analysis in the stu-died are, 81 linear seismic sources (faults) along with 4 subduction zones were identified and in order to estimate the horizontal acceleration induced by linear seismic sources, the following attenuation equations were used: Ambraseys 2005 [13];Campbell and Bozorgnia 2008 [14]; Boore and Atkinson 2008 [15];Chiuo and Youngs 2008 [16] andAbrahamson and Sillva 2008 [17]; and also attenua-tion equaattenua-tions Young 1997 [18];Atkinson-Boore 2008 [19]were used to estimate the horizontal acceleration induced by subduction model. It should be noted that software package EZ-FRISK 7.52 was used to carry out hazard analysis.
7. Discussion of Results and Final Conclusion
In order to assess the seismic hazard in the extent of Makran seismotectonic prov-ince, owing to the presence of linear seismic sources along with subduction zones in the region, three different approaches have been taken to develop the seismic model. The first approach assumes that all earthquakes recorded in the studied area are generated by surface faulting activity. According to this hypothesis, the entire activity rate derived based on earthquake catalogue assessment is assigned to the linear seismic sources. The second approach is related to the subduction zone and all earthquake events happened in the region have been attributed to the sub-duction zone, hence total activity rate was allocated to the subsub-duction model. The third approach is based on the notion that both of these source types contribute simultaneously to the seismicity and the seismic rate has been attributed to each of the sources with various ratios. The results clearly show that in case of separate analysis, the obtained values are conservative estimates of the actual ones and when these two seismic models are considered simultaneously with different dis-tribution of condis-tribution factors, the results will be between those two states. The maximum value of the surface faulting is observed in the northern part of the stu-died area where the fault density is high. However, in the coastal and middle areas, subduction model gives the maximum values of strong ground motion parame-ters. In order to obtain even more accurate data on the material discussed in this paper, it is strongly recommended that a comprehensive paleoseismology study along with an extensive geophysical investigation be carried out through the fault traces and also the subduction lines of influence.
References
[1] Ambraseys, N.N. and Melville, C.P. (1982) A History of PersianEarthquakes. Cam-bridge University Press, CamCam-bridge.
[2] Rabinovich, A.B., Geist, E.L. and Fritz, H.M. (2015) Introduction to “Tsunami Science: Ten Years after the 2004 Indian Ocean Tsunami. Volume I”. Pure and Ap-plied Geophysics, 172, 615. https://doi.org/10.1007/s00024-015-1038-5
[3] Aghanabati, A. (2006) Geology of Iran. Geological Survey, Iran.
DOI: 10.4236/oalib.1104094 19 Open Access Library Journal [5] Berberian, M. and Ashjai, M. (1977) Seismic Risk Map of Iran.
[6] Glennie, K.W., Clarke, M.W.H., Boeuf, M.G.A., Pilar, W.F.H. and Reinhardt, B.M. (1990) Interrelationship of Makran—Oman Mountains Belt of Convergence. In: Robertson, A.H.F., Searle, M.P. and Ries, A.C., Eds., The Geology and Tectonics of the Oman Region, Geological Society,London, Special Publication, No.49, 773-786. [7] Ghorashi, M. (1985) ìLate Cenozoic Faulting in S.E. Iranî, G.S.I. Rep. No.54. [8] Byrne, D.E., Sykes, L.R. and Davis, D.M. (1992) Great Thrust Earthquakes and
Aseismic Slip along the Plate Boundary of the Makran Subduction Zone. Journal of Geophysical Research, 97, 449-478.https://doi.org/10.1029/91JB02165
[9] Bayer, R., Chery, J., Tatar, M., Vernant, P.H., Abbassi, M., Masson, F., Nilforou-shan, F., Doerflinger, E., Regard, V. and Bellier, O. (2006) Active Deformation in Zagros-Makran Transition Zone Inferred from GPS Measurements. Geophysical Journal International, 165, 373-381.
https://doi.org/10.1111/j.1365-246X.2006.02879.x
[10] Gansser, A. (1971) The Taftan volcano (SE Iran). Ecloga GEOL. HELV; CHE; VOL. 64, NUM. 0002, P. 319A 334.
[11] Jacob, K.H. and Quittmeyer, R.C. (1979) The Makran Region of Pakistan and Iran trnch—Are System with Active Plate Subduction. In: Geodynamics of Pakistan, Geological Survey of Pakistan, Quetta, 305-318.
[12] Dykstra, J.D. and Birnie, R. (1979) Segmentation of the Quaternary Subduction Zone under the Baluchistan Region of Pakistan and Iran. In: Geodynamic of Pakis-tan,Elite Publishers, Karachi, 319-325.
[13] Ambraseys, N.N., Douglas, J., Sarma, S.K. and Smit, P.M. (2005) Equation for the Estimation of Strong Ground Motions from Shallow Crustal Earthquakes Using Data from Europe and the Middle East: Horizontal Peak Ground Acceleration and Spectral Acceleration. Bulletin of Earthquake Engineering, 3, 1-53.
https://doi.org/10.1007/s10518-005-0183-0
[14] Campbell, K.W. and Bozorgnia, Y. (2008) NGA Ground Motion Model for the Geometric Mean Horizontal Component of PGA, PGV, PGD and 5% Damped Li-near Elastic Response Spectra for Periods Ranging from 0.01 to 10s. Earthquake Spectra, 241, 139-171.https://doi.org/10.1193/1.2857546
[15] Boore, D.M. and Atkinson, G.M. (2008) Ground-Motion Prediction Equations for the Average Horizontal Component of PGA, PGV, and 5%-Damped PSA at Spectral Periods between 0.01s and 10.0s. Earthquake Spectra, 241, 99-138.
https://doi.org/10.1193/1.2830434
[16] Chiou, B.S.J. and Youngs, R.R. (2008) An NGA Model for the Average Horizontal Component of Peak Ground Motion and Response Spectra. Earthquake Spectra, 24, 173-215. https://doi.org/10.1193/1.2894832
[17] Abrahamson, N.A. and Silva, W.J. (2008) Summary of the Abrahamson & Silva NGA Ground-Motion Relations. Earthquake Spectra, 241, 67-97.
https://doi.org/10.1193/1.2924360
[18] Youngs, R.R., Chiou, S.J., Silva, W.J. and Humphrey, J.R. (1997) Strong Ground Motion Attenuation Relationships for Subduction Zone Earthquakes. Seismological Research Letters, 68, 58-73.https://doi.org/10.1785/gssrl.68.1.58
[19] Atkinson, G.M. and Boore, D.M. (2003) Empirical Ground-Motion Relations for Subduction-Zone Earthquakes and Their Application to Cascadia and Other Re-gions. Bulletin of the Seismological Society of America, 93, 1703-1729.
![Figure 1. Plan of Iran major faults [5]. The blue hatched box is showing the studied area](https://thumb-us.123doks.com/thumbv2/123dok_us/47198.504822/3.595.209.541.62.417/figure-plan-iran-major-faults-hatched-showing-studied.webp)
![Figure 2. Movement mechanism in Makran longitudinal faults and converging faults. (a) the couple convergent strike slip fault groups; (b) reverse and thrust faults simultaneous with folding [7]](https://thumb-us.123doks.com/thumbv2/123dok_us/47198.504822/4.595.217.529.65.197/figure-movement-mechanism-longitudinal-converging-convergent-reverse-simultaneous.webp)