127
Prediction of a Movie’s Success From Plot Summaries Using Deep
Learning Models
You-Jin Kim
Department of Applied Data Science Sungkyunkwan University
Suwon-si, South Korea k01077679687@gmail.com
Jung-Hoon Lee
College of Computing Sungkyunkwan University
Suwon-si, South Korea vhrehfdl@gmail.com
Yun-Gyung Cheong
College of Computing Sungkyunkwan University
Suwon-si, South Korea aimecca@skku.edu
Abstract
As the size of investment for movie produc-tion grows bigger, the need for predicting a movie’s success in early stages has increased. To address this need, various approaches have been proposed, mostly relying on movie re-views, trailer movie clips, and SNS postings. However, all of these are available only after a movie is produced and released. To enable a more earlier prediction of a movie’s perfor-mance, we propose a deep-learning based ap-proach to predict the success of a movie using only its plot summary text. This paper reports the results evaluating the efficacy of the pro-posed method and concludes with discussions and future work.
1 Introduction
Movie industry is a huge sector within the en-tertainment industry. The global movie box of-fice revenue is predicted to reach nearly 50 bil-lion U.S dollars in 2020 (Sachdev et al., 2018). With huge capital investments, the movie business is a high-risk venture (De Vany and Walls,1999). Therefore, an early prediction of a movie’s success can make a great contribution to the film industry, when post-production factors are unknown before the film’s release. This task is extremely challeng-ing, as the success of the movie should be deter-mined based on the scenario or plot of the movie without using the post-production drivers such as actor, actress, director, MPAA rating and etc.
To address this issue, our work attempts to predict a movie’s success from its textual sum-mary. We used the CMU Movie Summary Cor-pus 1, which contains crowd-sourced summaries from the real users. The success of a movie is assessed with the review scores of Rotten Toma-toes 2, an American review-aggregation website
1
http://www.cs.cmu.edu/˜ark/personas/
2https://www.rottentomatoes.com/
for film and television. The scoring system uti-lizes two scores: the tomato-meter and the audi-ence score. The tomato-meter score is estimated by hundreds of film and television critics, apprais-ing the artistic quality of a movie. The audience score is computed by the collective scores from regular movie viewers.
In this paper we present a deep-learning based approach to classify a movie popularity and qual-ity labels using the movie textual summary data. The primary hypothesis that we attempted to an-swer is to predict a movie’s success in terms of popularity and artistic quality by analyzing only the textual plot summary.
The contributions of our research are as follows:
• To prepare a data set to define a movie’s suc-cess
• To incorporate sentiment score in predicting a movie’s success
• To evaluate the efficacy of ELMO embedding in predicting a movie’s success
• To evaluate merged deep learning models (CNN and residual LSTM) in predicting a movie’s success
2 Our Approach
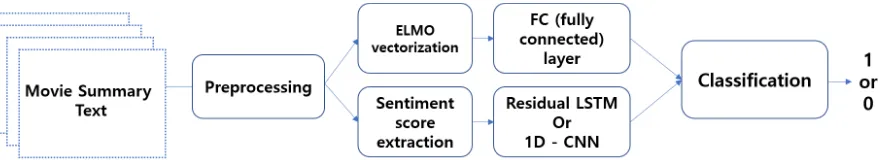
Figure 1 illustrates the system architecture that classifies an input text as successful or non-successful based on the critics score and the au-dience score.
Train Test
Total Genre/Audience Not popular(0) Popular(1) Not popular(0) Popular(1)
All genre 11,635 (62%) 7,122 (38%) 1,292 (62%) 793 (38%) 20,842
Drama 4,506 ( 51% ) 4,375 ( 49% ) 502 ( 50% ) 485 ( 50% ) 9,868
Thriller 2,639 ( 70% ) 1,123 ( 30% ) 295 ( 70% ) 124 ( 30% ) 4,181
Comedy 3,254 ( 65% ) 1,746 ( 35% ) 358 ( 64% ) 198 ( 36% ) 5,556
Romance 1,811 ( 57% ) 1,336 ( 43% ) 196 ( 56% ) 154 ( 44% ) 3,497
Genre/Critics Not Well-made(0) Well-made(1) Not Well-made(0) Well-made(1) Total
All genre 5,493 ( 50% ) 5,324 ( 50% ) 590 ( 49% ) 612 ( 51% ) 12,019
Drama 2,416 ( 42% ) 3,306 ( 58% ) 273 ( 42% ) 363 ( 58% ) 6,358
Thriller 1,349 ( 55% ) 1,078 ( 45% ) 142 ( 52% ) 128 ( 48% ) 2,697
Comedy 1,898 ( 57% ) 1,389 ( 43% ) 222 ( 60% ) 144 ( 40% ) 3,653
Romance 1,103 ( 52% ) 1,015 ( 48% ) 107 ( 45% ) 129 ( 55% ) 2,354
Genre/Compound Not Successful (0) Successful(1) Not Successful(0) Successful(1) Total
[image:2.595.74.530.60.238.2]All genre 3,812 (51%) 3,586 (49%) 440 (53%) 383 (47%) 8,221
Table 1: Training and test data set proportion. Class 1 denotes movies with scores greater than 75. Class 0 denotes movies with scores less than 65.
Figure 1: The overall classification procedure
outputs are merged to classify a movie summary into the success or non-success classes.
2.1 Data
To evaluate our approach, we used the CMU Movie Summary Corpus (Bamman et al., 2013), which contains crowd-sourced summaries from the real users.
The corpus contains 42,306 movie plot sum-maries and their metadata such as genre, release date, cast, character traits, etc. However, we use only the plot summary text feature and the genre. The following example summary which consists of 36 sentences and 660 words, shows a part of the plot summary of ‘The Avengers’ (released in 2012) directed by Joss Whedo.
The Asgardian Loki encounters the Other,the leader of an extraterrestrial race known as the Chitauri. In exchange for retrieving the Tesseract, a powerful energy source of unknown potential, ...
In the first of two post-credits scenes, the Other confers with his master about the attack on Earth and humanity’s re-sistance; in the second, the Avengers eat
in silence at a shawarma restaurant.
We created the classification labels based on the Rotten tomato scores that we crawled from Rotten Tomatoes’ website with the Selenium3and Beau-tiful Soup python packages (Richardson, 2013). These scores serve as a credible indicator of a movie’s success (Doshi et al.,2010). We classify movies following the Rotten Tomato rule; if the review score is greater than 75, the corresponding movie is classified fresh (1); if its score is less than 60, the movie is classified not fresh (0).
As some movies do not have both the audi-ence and the critics score, we collected 20,842 and 12,019 movie plot summary data for the audience score and for the critic score respec-tively. The audience score is assessed by ordi-nary people, we regard the class 1 as representing ‘popular’ movies and the class 0 as representing ‘not popular’ movies. Likewise, since the crit-ics score is assessed by professionals in the in-dustry, we consider class 1 as representing ‘well-made’ movies and class 0 as representing ‘not well-made’ movies. Since these scores indicate the popularity and quality of a movie, we define a successful movie as having the combination of
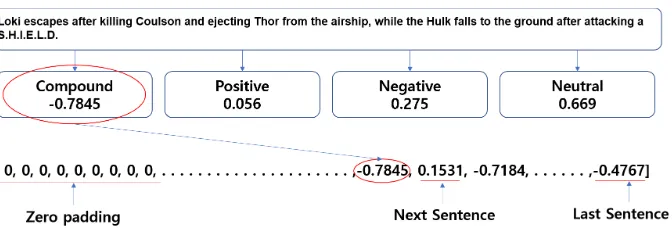
[image:2.595.81.521.280.360.2]Figure 2: The sentiment vector representation of the movie ‘The Avengers’.
these score greater than 75. Finally, we prepared the third data set considering both of the audience and the critics scores. We define movies with each audience and critics score greater than 75 as ‘suc-cessful’ and less than 60 as ‘not suc‘suc-cessful’.
There are two reasons that the number of in-stances in the prepared data is less than the number of summaries in the CMU Movie summary cor-pus. First, movies that have received review scores above 60 and below 75 are filtered out. Second, some movies in the CMU Movie summary corpus have no scores at the Rotten Tomato site.
Table1shows the statistics of the data set. The ratio between class 1 and 0 is approximately 6:4 for the audience score and 5:5 for the critics score and the combination of both scores.
The data sets were also divided into different genres, to test whether the genre of a movie has an impact on the prediction of a performance. The table shows the ratios between class 1 and 0 are balanced except for the thriller and comedy genres in the audience score. Since each movie is tagged with multiple genres, the sum of all the number of summaries of each genre is greater than the total number of summaries.
A simple statistical analysis shows that the max-imum number of sentences in the longest sum-mary in the train set is 198, the minimum is 1, and the average is 18.3. The number of words in the largest summary is 4,264, while that of the short-est summary is 10. The average is 361.2 words.
2.2 ELMO embedding
When the list of sentences representing a movie summary is given as input, the module cre-ates its corresponding word embedding vectors. Traditional word embedding schemes such as Word2vec (Mikolov et al.,2013) and Glove (Pen-nington et al., 2014) produce a fixed vector for each word. While those embedding methods
have been shown effective in many NLP applica-tions, they do not deal with words which mean differently as their contexts vary such as homo-phones. Thus, We applied a contextualized em-bedding method that can generate different word vectors depending on the context. ELMO (Peters et al., 2018) is a popular contextualized embed-ding method, which uses two bidirectional LSTM networks for constructing the vector.
In this work, we utilized the TensorFlow Hub implementation4to represent the word vector. We then fine-tuned the weight for ELMO embedding to gain better performance for the classification task (Perone et al.,2018).
Since the length of the summary varies, we need to set a maximum number of sentences in a sum-mary. We set the maximum number at 198, as it is the number of sentences in the longest summary found in the train set.
2.3 Sentiment score extraction
To extract the sentiment score of each sentence, we applied the NLTK’s Vader sentiment analyzer (Hutto and Gilbert,2014) to each sentence. Figure 2 illustrates a part of the sentiment vector repre-sentation of the movie ‘The Avengers’. A sum-mary is represented as a 198 dimensional vector, where each denotes the sentiment score of a single sentence. A summary shorter than 198 sentences is zero-padded. The highlight of the story (i.e., the conflict and resolution stages) is usually located towards the end of the story. So, we reversed the order as the vector is given as input to the LSTM deep learning model in the next stage which better remember the recent input.
The VADER(Valence Aware Dictionary for sen-timent Reasoning) module computes four scores for each sentence: negative, positive, neutral, and compound scores. In this research, we use the
compound score ranging from -1 (most negative) to 1 (most positive).
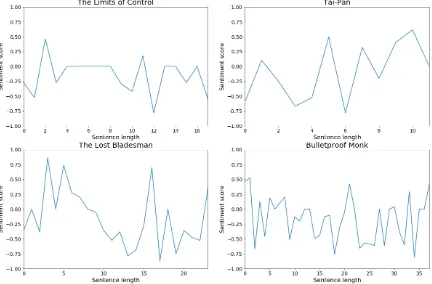
Figure 3: Sentiment flow graphs of successful movies. X axis denotes the sentence index, and the Y axis de-notes the sentiment score of a sentence normalized be-tween -1 and 1.
Figure 4: Sentiment flow graphs of unsuccessful movies. X axis denotes the sentence index, and the Y axis denotes the sentiment score of a sentence normal-ized between -1 and 1.
Figure3and Figure4depict the sentiment plots of successful movies and unsuccessful movies re-spectively. The 4 graphs shown in Figure3exhibit various patterns of successful movies’ sentiment flows. The movieAlice in Wonderlandbegins and ends positively. On the other hand, the movies
Das Boot and A Man for All Seasonsbegin and
end with negatively. The movieGettysburgshows the reversal of fortune pattern which begins neg-atively and ends positively. It is commonly noted that these successful movies have frequence senti-ment fluctuations. On the other hand, the graphs in Figure 4 illustrate unsuccessful movies’ senti-ment flows, which exhibit less frequent sentisenti-ment fluctuations. Both the movieThe Limits of Control
andThe Lost Bladesmanhave negative beginning
and ending. The movieTai-Panbegins negatively
and ends positively. The movieBluetproof Monk
begins and ends positively, however, its majority sentiment scores are negative while the story is be-ing developed. Therefore, it suggests that the fre-quency of sentiment changes may signal the suc-cess of films. Yet, the polarity of sentiment have a little impact on predicting a movie’s success.
2.4 Classification Models
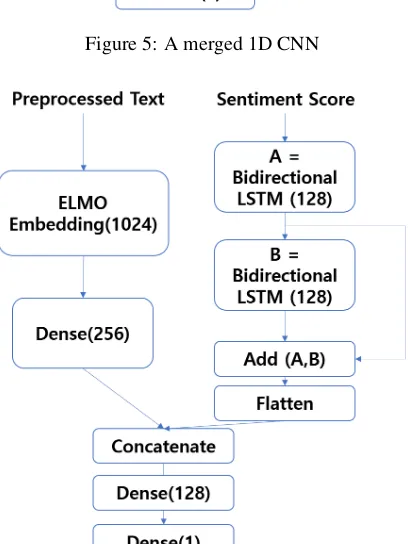
We built an ELMO, a merged 1D CNN (Figure5), and a merged residual LSTM (Figure6) networks. We establish our baseline by calculating a majority class baseline for comparison.
First, we use deep contextualized word repre-sentations created by the ELMO embedding. This network consists of a character embedding layer, a convolutional layer, two highway networks, and two LSTM layers. Each token is converted to a character embedding representation, which is fed to a convolutional layer. Then, it goes through two highway networks to help the deep learning network training. Then, the output is fed to the LSTM layer as input data. The weights of each LSTM hidden layer are combined to generate the ELMO embedding. Finally, a 1024 dimensional ELMO embedding vector is constructed for each sentence, which is put into the 256 dimensional dense network. RELU (Nair and Hinton,2010) is used as its activation function.
Figure 5shows the 1D CNN merged network, where the sentiment score vector is given as input to the CNN network. The model consists of two 1D convolutional layers, with 64-size filters and 3-size kernels. The second CNN layer includes a dropout layer. The next max-pooling layer reduces the learned features to 1/4 of their size. The final flatten layer constructs a single 100-dimensional vector. Then, the output from the ELMO embed-ding and the output from the CNN model is con-catenated and given to the last 1-dense classifica-tion layer.
[image:4.595.74.290.324.466.2]Score Genre Model Recall Precision F1
1 0 1 0 1 0
Audience
All
ELMO 0.54 0.81 0.64 0.74 0.58 0.78 CNN 0.38 0.90 0.70 0.70 0.49 0.79
LSTM 0.56 0.67 0.51 0.71 0.53 0.69
Drama
ELMO 0.62 0.73 0.69 0.67 0.66 0.70
LSTM 0.79 0.39 0.56 0.66 0.65 0.49 CNN 0.77 0.48 0.59 0.68 0.67 0.56
Thriller
ELMO 0.39 0.91 0.65 0.78 0.48 0.84
CNN 0.41 0.79 0.45 0.76 0.43 0.77 LSTM 0.60 0.70 0.45 0.80 0.52 0.75
Comedy
ELMO 0.31 0.94 0.73 0.71 0.43 0.81
CNN 0.41 0.83 0.57 0.72 0.48 0.77 LSTM 0.62 0.63 0.48 0.75 0.54 0.68
Romance
ELMO 0.63 0.68 0.61 0.70 0.62 0.69
[image:5.595.124.474.75.312.2]CNN 0.57 0.67 0.58 0.67 0.58 0.67 LSTM 0.55 0.71 0.60 0.67 0.57 0.69
Table 2: The evaluation results for the audience score. The best performances in F1 score are in bold.
Score Genre Model Recall Precision F1
1 0 1 0 1 0
Critics
All
ELMO 0.72 0.60 0.65 0.68 0.69 0.63 CNN 0.76 0.56 0.64 0.69 0.70 0.62 LSTM 0.71 0.63 0.66 0.68 0.69 0.65
Drama
ELMO 0.79 0.47 0.66 0.63 0.72 0.53
CNN 0.79 0.46 0.66 0.62 0.72 0.53
LSTM 0.71 0.50 0.65 0.57 0.68 0.53
Thriller
ELMO 0.65 0.72 0.67 0.69 0.66 0.71 CNN 0.68 0.77 0.73 0.73 0.70 0.75
LSTM 0.64 0.76 0.71 0.70 0.67 0.73
Comedy
ELMO 0.61 0.77 0.63 0.75 0.62 0.76 CNN 0.52 0.82 0.65 0.73 0.58 0.77
LSTM 0.49 0.80 0.62 0.71 0.55 0.75
Romance
ELMO 0.64 0.62 0.67 0.58 0.65 0.60
CNN 0.64 0.61 0.66 0.59 0.65 0.60
[image:5.595.124.473.367.601.2]LSTM 0.71 0.50 0.63 0.59 0.67 0.54
Table 3: The evaluation results for the critics score. The best performances in F1 score are in bold.
Score Genre Model Recall Precision F1
1 0 1 0 1 0
Audience&Critics All genre
ELMO 0.67 0.74 0.69 0.72 0.68 0.73
CNN 0.68 0.70 0.64 0.67 0.66 0.69 LSTM 0.68 0.67 0.64 0.71 0.66 0.69
[image:5.595.103.493.656.729.2]Figure 5: A merged 1D CNN
Figure 6: A merged bidirectional residual LSTM
3 Evaluation Results
We evaluated the classification performance of our approach for the audience score and for the critics score. We also inspected the performance based on the movie genre. We report the performance in terms of recall, precision, and F1 scores.
3.1 The Results
Table2 shows the performance result for the au-dience score. We use the F1 score as the primary metric for comparison as it is the harmonic means
of recall and precision. Overall, the classifica-tion performance of ‘not popular ’ movies better than that of ‘popular ’ ones. The CNN model per-formed best in ‘all genre ’ with F1 of 0.79, which is 0.17 higher than the majority class baseline (F1 of 0.62). The ELMO model outperformed best in the genres of drama, thriller, comedy, and ro-mance. On the contrary, the ELMO model had the highest performance for ‘popular’ at 0.58 and 0.62 in overall and romance genre respectively, while LSTM and CNN had the highest performance in the rest of the genre
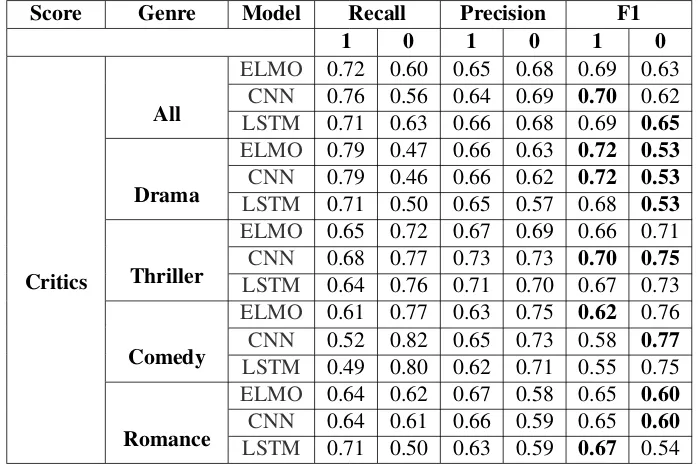
Table 3 summarizes the evaluation results for the critics score.
For all the genres, the deep learning mod-els outperform the majority class baseline (F1 score=0.51) for predicting ‘well-made ’ movies producing its highest F1 of 0.70. The CNN model achieved the highest F1 score of 0.72 in predict-ing ‘well-made’ drama movies when its majority class baseline performance is 0.58. In the thriller, the CNN model also outperformed the baseline (F1 score=0.52) producing an F1 score of 0.75. The LSTM model achieved the best performance in predicting ‘not well-made’ movies, and yet the score is low–0.65.
Inspection of the genre-specific F1 score shows that the best performance was obtained from CNN model when predicting ‘not well-made’ movies for the comedy genre (F1 score of 0.77).
Finally, Table4shows the results when our ap-proach is applied to the combined score. The ELMO embedding model outperforms the major-ity class baseline and the other models, achieving F1 scores of 0.68 and 0.73 when predicting ‘suc-cessful’ and ‘not suc‘suc-cessful’ movies respectively.
3.2 Discussions
Overall, the results suggest that the merged deep learning models proposed in this paper outperform the majority class baseline.
[image:6.595.80.284.283.555.2]out-performs the merged deep learning models that employ the sentiment score in predicting ‘popular’ movies with significant difference.
The CNN model produces a F1 score higher than ELMo does in the thrillers and comedy gen-res and in the drama genre for ‘popular’ movies.
In case of the critics score, the overall perfor-mance was inferior to that of the audience score. Inspection of the F1 score of each genre shows that predicting ‘not well-made’ movies in the thriller and the comedy genre achieved the best perfor-mance (0.75 and 0.77 respectively) when the CNN model was used along with the sentiment score. Generally, the CNN or LSTM models have shown F1 scores higher than the ELMO models at pre-dicting well-made movies using the critics score except the drama genre.
Then, employing the ELMO model outperforms other models that used the sentiment score as well. This may suggest that words are the primary deter-miner of predicting a movie’ success.
The research work by Eliashberg et al. Eliash-berg et al. (2007) is most similar to our work. Their evaluation achieved the F1 score of 0.5 (re-computed from the evaluation metrics reported) in predicting a movie’s success using the CART (Bootstrap Aggregated Classification and Regres-sion Tree) model and the movie spoiler text which is 4-20 pages long. Although our result appear to be superior to their work in terms of yielding higher F1 score, it is not directly comparable since the data sets and the evaluation metrics are differ-ent.
4 Related work
The prediction of movie box office results has been actively researched (Rhee and Zulkernine, 2016;Eliashberg et al.,2007,2010,2014;Sharda and Delen, 2006; Zhang et al., 2009; Du et al., 2014).
Most researches predict a movie’s success us-ing various factors such as SNS data, cost, crit-ics ratings, genre, distributor, release season, and the main actors award history, etc (Mesty´an et al., 2013; Rhee and Zulkernine, 2016; Jaiswal and Sharma,2017). This means that the prediction is made in the later stages of movie production, when the movie has already been produced and released. The evaluation carried out in (Jaiswal and Sharma, 2017) achieved the highest performance with F1 score of 0.79, which is recomputed from
the evaluation metrics reported. However, this per-formance is not directly comparable to our result, since their work employed a small data set which consists of 557 movies and was based on a dif-ferent genre (i.e., Bollywood movie). Their work employs rich feature such as YouTube statistics, lead actor, actress and director ratings, critics re-views, which are mostly available only after the movie is produced. Therefore, movie distributors and investors cannot rely on this approach when they need to make an investment decision.
To overcome this problem, our approach relies on only the plot summary, which can assist the in-vestors in making their invest decisions in the very early stages when they only have the written movie script.
5 Conclusions
In this paper, we propose a deep learning based ap-proach utilizing the ELMO embedding and senti-ment scores of sentences for predicting the success of a movie, based only on a textual summary of the movie plot. To test the efficacy of our approach, we prepared our evaluation data sets: movie plot summaries gathered from the CMU Movie Sum-mary Corpus and their review scores from a movie review website.
Since these plot summaries were obtained from Wikipedia, where the data are crowd sourced vol-untarily. Hence, some movie summaries may have been written by people who like or value the movie. This may complicate our task to predict the movie’s success only from the summary. We built three deep learning models: an ELMO em-bedding and two merged deep learning models (a merged 1D CNN network and a merged residual bidirectional LSTM network).
The evaluation results show that our deep learn-ing models outperform the majority class baseline. For the combination of the audience and the critics scores, the majority class baseline is F1 of 0.53 for ‘not successful’ , and 0 for ‘successful ’. Our best model obtained the highest F1 score of 0.68 for predicting ‘successful’ movies and that of 0.70 for predicting ‘not successful’ movies were obtained.
in funding movie productions.
It seems that predicting ‘not popular’ or ‘not successful’ movies performs better than that of predicting ‘popular’ or ‘successful’ movies. Pre-dicting unsuccessful movies can be useful for the Internet Protocol television (IPTV) content providers such as Netflix. Whereas tens of thou-sands of TV contents are made available, only a small portion of them are actually consumed (Re-format and Yager,2014). Therefore, our approach can be used to filter out such contents that are not appealing to the content viewers.
For future work, we will further investigate the efficacy of our approach in the thriller and the comedy genes, which presented the best perfor-mances. In addition, we will extend our model to deal with the magnitude of a movie’s success. For this, linear regression models can be applied to predict different levels of success.
Acknowledgement
This work was supported by the National Research Foundation of Korea(NRF) grant funded by the Korea government(MEST) (No. 2019R1A2C1006316). This research was sup-ported by Basic Science Research Program through the National Research Foundation of Korea(NRF) funded by the Ministry of Educa-tion(No. 2016R1D1A1B03933002).
References
David Bamman, Brendan OConnor, and Noah A Smith. 2013. Learning latent personas of film char-acters. InProceedings of the 51st Annual Meeting of the Association for Computational Linguistics (Vol-ume 1: Long Papers), vol(Vol-ume 1, pages 352–361.
Arthur De Vany and W David Walls. 1999. Uncertainty in the movie industry: Does star power reduce the terror of the box office? Journal of cultural eco-nomics, 23(4):285–318.
Lyric Doshi, Jonas Krauss, Stefan Nann, and Peter Gloor. 2010. Predicting movie prices through dy-namic social network analysis. Procedia-Social and Behavioral Sciences, 2(4):6423–6433.
Jingfei Du, Hua Xu, and Xiaoqiu Huang. 2014. Box office prediction based on microblog. Expert Sys-tems with Applications, 41(4):1680–1689.
Jehoshua Eliashberg, Sam K Hui, and Z John Zhang. 2007. From story line to box office: A new approach for green-lighting movie scripts. Management Sci-ence, 53(6):881–893.
Jehoshua Eliashberg, Sam K Hui, and Z John Zhang. 2014. Assessing box office performance using movie scripts: A kernel-based approach. IEEE Transactions on Knowledge and Data Engineering, 26(11):2639–2648.
Jehoshua Eliashberg, SK Hui, and SJ Zhang. 2010. Green-lighting Movie Scripts: Revenue Forecasting and Risk Management. Ph.D. thesis, Ph. D. thesis, University of Pennsylvania.
Clayton J Hutto and Eric Gilbert. 2014. Vader: A par-simonious rule-based model for sentiment analysis of social media text. InEighth international AAAI conference on weblogs and social media.
Sameer Ranjan Jaiswal and Divyansh Sharma. 2017. Predicting success of bollywood movies using ma-chine learning techniques. In Proceedings of the 10th Annual ACM India Compute Conference on ZZZ, pages 121–124. ACM.
M´arton Mesty´an, Taha Yasseri, and J´anos Kert´esz. 2013. Early prediction of movie box office suc-cess based on wikipedia activity big data. PloS one, 8(8):e71226.
Tomas Mikolov, Kai Chen, Greg Corrado, and Jef-frey Dean. 2013. Efficient estimation of word representations in vector space. arXiv preprint arXiv:1301.3781.
Vinod Nair and Geoffrey E Hinton. 2010. Rectified linear units improve restricted boltzmann machines. InProceedings of the 27th international conference on machine learning (ICML-10), pages 807–814.
Jeffrey Pennington, Richard Socher, and Christopher Manning. 2014. Glove: Global vectors for word representation. InProceedings of the 2014 confer-ence on empirical methods in natural language pro-cessing (EMNLP), pages 1532–1543.
Christian S Perone, Roberto Silveira, and Thomas S Paula. 2018. Evaluation of sentence embeddings in downstream and linguistic probing tasks. arXiv preprint arXiv:1806.06259.
Matthew E Peters, Mark Neumann, Mohit Iyyer, Matt Gardner, Christopher Clark, Kenton Lee, and Luke Zettlemoyer. 2018. Deep contextualized word rep-resentations. arXiv preprint arXiv:1802.05365.
Marek Z Reformat and Ronald R Yager. 2014. Sug-gesting recommendations using pythagorean fuzzy sets illustrated using netflix movie data. In Inter-national Conference on Information Processing and Management of Uncertainty in Knowledge-Based Systems, pages 546–556. Springer.
Leonard Richardson. 2013. Beautiful soup. Crummy: The Site.
Shaiwal Sachdev, Abhishek Agrawal, Shubham Bhen-darkar, Bakshi Rohit Prasad, and Sonali Agarwal. 2018. Movie box-office gross revenue estimation. In Recent Findings in Intelligent Computing Tech-niques, pages 9–17. Springer.
Ramesh Sharda and Dursun Delen. 2006. Predict-ing box-office success of motion pictures with neu-ral networks. Expert Systems with Applications, 30(2):243–254.