Munich Personal RePEc Archive
Personality traits as an engine of
knowledge: A quantile regression
approach
Polemis, Michael
University of Piraeus, Hellenic Competition Commission
31 July 2018
1
Personality traits as an engine of knowledge: A quantile regression approach
Michael Polemisa,b
a University of Piraeus, Department of Economics, Piraeus, Greece.
b Hellenic Competition Commission, Athens, Greece
Abstract
We use a unique micro-level data set to investigate the impact of personality traits on
education. To the best of our knowledge this is the first study shedding light on the
contribution of each of the Big Five personality traits on the education decision made
by the individuals. Our findings, uncover a significant effect of non-cognitive skills on
the level of education. Specifically, we argue that the estimated signs of the
non-cognitive skills remain stable across the quantiles. It is shown that people with high
emotional stability invest in human capital. Lastly, our model survived robustness
checks under the inclusion of two aggregated higher-order factors.
JEL classifications: I21; J24; C31
2 1. Introduction
During the last decades, economists have tried to disentangle personality traits
as a type of non-cognitive skills that may have significant impact on human behaviour
and adulthood (Raymundo et al, 2018; Cobb-Clark and Schurer, 2012).
Although there is an emergent literature examining the way personality traits
affect various individual economic and social outcomes (e.g wages, job search, criminal
behavior, health, etc), surprisingly little evidence exists on the extent to which the
non-cognitive skills affect the level of education between the individuals.
Most of the existing studies try to link personality traits with academic
performance and adolescence (Hoeschler et al, 2018; Heckman et al, 2013). However,
they fail to provide answers to the following research questions: (a) Do personality
traits affect education? (b) How do personality traits contribute to knowledge
spillovers? (c) Does the equality of the slope coefficients hold across the quantiles?
In this study, we use a unique data set to investigate the impact of personality
traits on education. The empirical findings, provide sufficient evidence that
non-cognitive skills play a significant role in the education level, with the estimated signs
remaining stable across the quantiles. It is shown that individuals with high emotional
stability invest in human capital.
The rest of this paper is structured as follows. Section 2 presents the data and
discusses the methodology employed. The results of our analysis are presented in
Section 3, while Section 4 performs the necessary robustness checks to test for the
3 2. Data and methodology
2.1 Data and descriptive statistics
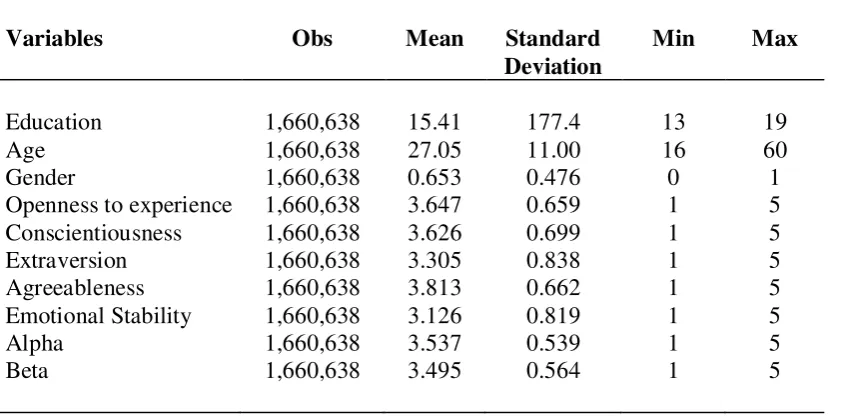
We rely on a specially designed survey of 1,660,638 individuals in the U.S
during the period 2009-2015 (Wei et al, 2017). To measure personality traits, we
employ the widely-used Big Five Inventory (“Five Factor Model”) including Openness
to experience, Conscientiousness, Extraversion, Agreeableness and Emotional
Stability. We supplement our analysis with the use of three socio-demographic
variables representing Education (number of years), Age and Gender (Male = 0, Female
[image:4.595.92.516.343.551.2]= 1). The following table portrays the summary statistics.
Table 1: Summary statistics
Variables Obs Mean Standard
Deviation
Min Max
Education 1,660,638 15.41 177.4 13 19
Age 1,660,638 27.05 11.00 16 60
Gender 1,660,638 0.653 0.476 0 1
Openness to experience 1,660,638 3.647 0.659 1 5
Conscientiousness 1,660,638 3.626 0.699 1 5
Extraversion 1,660,638 3.305 0.838 1 5
Agreeableness 1,660,638 3.813 0.662 1 5
Emotional Stability 1,660,638 3.126 0.819 1 5
Alpha 1,660,638 3.537 0.539 1 5
Beta 1,660,638 3.495 0.564 1 5
2.2 Econometric methodology
Quantile regressions (QR) allow the estimation of various functions of a
conditional distribution where each quantile characterizes a particular (i.e center or tail)
point of the conditional distribution. Putting together a number of different quantile
regressions gives us a more complete description of the underlying conditional
distribution. Moreover, quantile regressions also provide a richer characterization of
4
the dependent variable, not merely its conditional mean. It is worth mentioning that QR
is invariant to monotonic transformations such as natural logarithms.
In simple words, while in the OLS application the estimated parameters
represent the change in the dependent variable caused from a unit change in the
independents, the parameters of the QR estimate the change in a specific quantile of the
dependent variable due to a unitary change in the independent variable. This allows
comparisons among the quantiles in terms of how much they are influenced from
specific characteristics in relation to the other quantiles (Halkos and Polemis, 2018).
This can be seen in the change in the magnitude of the coefficients. QR are extremely
useful when we face heteroskedasticity and/or no normality in the disturbance term
(Buchinsky 1998). Moreover, QR are especially useful when dealing with
non-identically distributed data (Distante et, al, 2018). In these situations one should expect
to observe significant discrepancies in the estimated ‘slopes’ at different quantiles with
respect a given set of covariates (Machado and Mata, 2000). Such discrepancies may
reflect not just into location shifts, but also into scale shifts (i.e., changes in the degree
of dispersion) and/or asymmetry reversals (i.e., changes in the sign of the skewness).
Consider the following conditional quantile function:
) ( ))
( |
(
i
j
Q (1)
where
(
) arg (){
( j
(
))j
j
mm
(2)Similarly to Koenker and Bassett (1978), we show that:
(3)
where
lim(i j j / ) lim(n / )
j
J X X i X X i
(4)2 1
ˆ
( ( )) ( )) ~ (0, (1 ) ( ) )
5
and ( ) 1( ) 11
( ( )) S F f F
(5)
S(λ) is the quantile density function. We can calculate S
with the use of theKernel density estimator. The latter is given as follows:
1
1
1
ˆ( )
ˆ ( )
(1/ ) i j i i j S
i c L
c
(6)where ˆj denotes the residuals of the quantile regression. By defining the coefficient
vector of this procedure as:
1 2
( ( ) , ( ) , , ( ) )
(7)we have i(
ˆ ) ~ (0, ) (8)where ij minimum
i, j
i j H 1( )
i JH 1( )
i
(9)
In the case of i.i.d. Ω becomes 0J where 0as representative element has
)) ( ( ( )) ( ( ) , min( 1 1 j i j i j i ij F f F
f
(10)
Estimation of Ω may be done using the bootstrap method.
The test of slope equality was suggested by Koenker (2005) and it is a robust
heteroskedasticity test ) ( ) ( ) (
:
1
1
2
2
oH
Where we have (p1)(k1) restrictions in the coefficients. The corresponding Wald
test is distributed as
(2p1),(k1). Similarly, the symmetry test was proposed by Jones(1992) and relies on the idea that if
6
then we may estimate this restriction using the Wald test with H0 having p(k1)/2
restrictions and the Wald test is distributed as
2p(k1)/2.1 This test compares theestimates of the first and third quantile with the median specification. Based on the
above, we estimate the following linear model:
1
5
2 3
6
4
7
i i i i i
i
i i i
Conscientiousness Extraversion Agreeableness b Emotional Stabi
Education b Openess b b lity b Age b Gende
b r e
3. Results and discussion
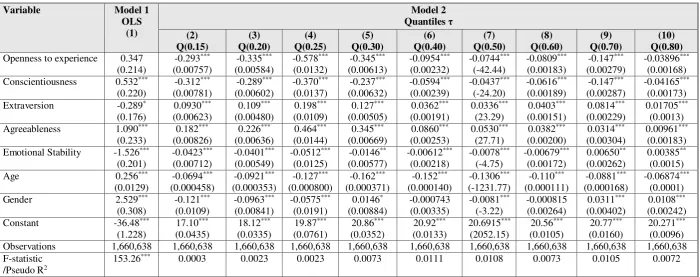
In the case of Model 1 (OLS) it is evident that nearly all the estimated coefficients are
statistically significant. Specifically, the coefficient of conscientiousness is positive as
one would have expected, while extraversion has a negative and statistically significant
estimate of -0.289 (Table 2). Similarly the coefficient of emotional stability is
negatively correlated with the education level (-1.526), which is quite surprising since
individuals with higher levels of neuroticism tend to have worse psychological well
-being (Dwan and Ownsworth, 2017). The remaining trait (Agreeableness) does seem
to have a positive impact on education, at least from a statistical point of view (1.090).
Moreover, the other two control variables (Age and Gender) have positive impact on
education level as indicated by their estimated coefficients. The quantile regression
analysis unveils a more differentiated picture (see Model 2). For instance, Openness to
experience is now significant in all of the estimated quantiles. The sign of this variable
is in line with our expectations since individuals that are characterized by a high level
of openness “tend to lean, in occupation and hobby, towards the arts, being, typically,
creative and appreciative of the significance of intellectual and artistic pursuits”
(Friedman et al, 2016).
7 Table 2: Estimation results
Variable Model 1
OLS (1)
Model 2 Quantiles τ (2) Q(0.15) (3) Q(0.20) (4) Q(0.25) (5) Q(0.30) (6) Q(0.40) (7) Q(0.50) (8) Q(0.60) (9) Q(0.70) (10) Q(0.80) Openness to experience 0.347
(0.214) -0.293*** (0.00757) -0.335*** (0.00584) -0.578*** (0.0132) -0.345*** (0.00613) -0.0954*** (0.00232) -0.0744*** (-42.44) -0.0809*** (0.00183) -0.147*** (0.00279) -0.03896*** (0.00168) Conscientiousness 0.532***
(0.220) -0.312*** (0.00781) -0.289*** (0.00602) -0.370*** (0.0137) -0.237*** (0.00632) -0.0594*** (0.00239) -0.0437*** (-24.20) -0.0616*** (0.00189) -0.147*** (0.00287) -0.04165*** (0.00173) Extraversion -0.289*
(0.176) 0.0930*** (0.00623) 0.109*** (0.00480) 0.198*** (0.0109) 0.127*** (0.00505) 0.0362*** (0.00191) 0.0336*** (23.29) 0.0403*** (0.00151) 0.0814*** (0.00229) 0.01705*** (0.0013) Agreeableness 1.090***
(0.233) 0.182*** (0.00826) 0.226*** (0.00636) 0.464*** (0.0144) 0.345*** (0.00669) 0.0860*** (0.00253) 0.0530*** (27.71) 0.0382*** (0.00200) 0.0314*** (0.00304) 0.00961*** (0.00183) Emotional Stability -1.526***
(0.201) -0.0423*** (0.00712) -0.0401*** (0.00549) -0.0512*** (0.0125) -0.0146** (0.00577) -0.00612*** (0.00218) -0.0078*** (-4.75) -0.00679*** (0.00172) 0.00650** (0.00262) 0.00385** (0.0015)
Age 0.256***
(0.0129) -0.0694*** (0.000458) -0.0921*** (0.000353) -0.127*** (0.000800) -0.162*** (0.000371) -0.152*** (0.000140) -0.1306*** (-1231.77) -0.110*** (0.000111) -0.0881*** (0.000168) -0.06874*** (0.0001)
Gender 2.529***
(0.308) -0.121*** (0.0109) -0.0963*** (0.00841) -0.0575*** (0.0191) 0.0146* (0.00884) -0.000743 (0.00335) -0.0081*** (-3.22) -0.000815 (0.00264) 0.0311*** (0.00402) 0.0108*** (0.00242) Constant -36.48***
(1.228) 17.10*** (0.0435) 18.12*** (0.0335) 19.87*** (0.0761) 20.86*** (0.0352) 20.92*** (0.0133) 20.6915*** (2052.15) 20.56*** (0.0105) 20.77*** (0.0160) 20.271*** (0.0096) Observations 1,660,638 1,660,638 1,660,638 1,660,638 1,660,638 1,660,638 1,660,638 1,660,638 1,660,638 1,660,638 F-statistic
/Pseudo R2
8
Surprisingly, conscientiousness is negatively correlated with the education level
though significant in all of the estimated quantiles. This might indicate that the
underlying true relationship “is non-linear, and that our linear specification captures
some kind of average effect” (Schafer and Schwiebert, 2018).
On the contrary, extraversion has a positive and statistically significant impact
on the dependent variable since it is argued that high extraversion is often perceived as
attention-seeking and domineering which may stimulate the education level of the
individuals (Dwan and Ownsworth, 2017).
Similarly, agreeableness is positively correlated with education in all of the
quantiles, implying that personalities with low agreeableness are often competitive or
challenging people, which can surpass the education incentive. While emotional
stability seems to negatively affect the level of education, it alternates its sign from the
70th percentile (0.00650) remaining positive across the rest quantiles. The positive sign
denotes that people with high emotional stability manifest themselves as stable and
calm personalities more eager to invest in human capital (education). Moreover, the
two socio-demographic variables (Age and Gender) are statistically significant
imposing a negative impact on education at least up to the 70th quantile.
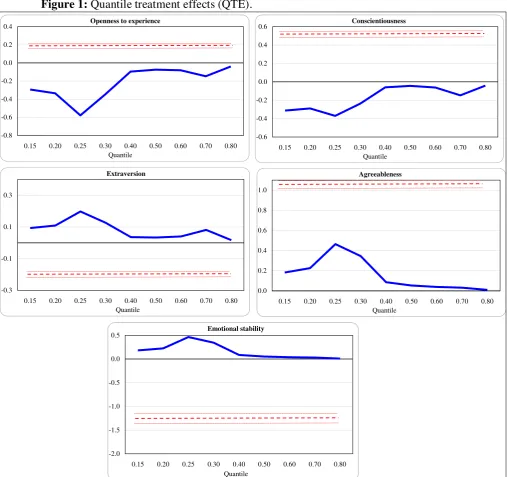
Figure 1 illustrates the quantile treatment effects (QTE) associated with the
personality traits, along with the OLS estimates. As it is evident the magnitude of the
effects at various quantiles differs considerably from the OLS coefficient estimates.
Lastly, we perform the test for the equivalence of the quantile estimates. According to
the p-value (0.001), the null hypothesis of equality of the slope coefficients at the three
representative quantiles (0.25, 0.50, 0.75) are rejected at the 1% level of significance
for each of the estimated coefficients suggesting that personality traits do not appear to
9 Figure 1: Quantile treatment effects (QTE).
Notes: The blue line is the estimated QTE, while the dashed (red) line denotes the OLS estimates. The red dotted lines denote the confidence bands.
Emotional stability
-2.0 -1.5 -1.0 -0.5 0.0 0.5
0.15 0.20 0.25 0.30 0.40 0.50 0.60 0.70 0.80 Quantile
Conscientiousness
-0.6 -0.4 -0.2 0.0 0.2 0.4 0.6
0.15 0.20 0.25 0.30 0.40 0.50 0.60 0.70 0.80 Quantile
Extraversion
-0.3 -0.1 0.1 0.3
0.15 0.20 0.25 0.30 0.40 0.50 0.60 0.70 0.80 Quantile
Agreeableness
0.0 0.2 0.4 0.6 0.8 1.0
0.15 0.20 0.25 0.30 0.40 0.50 0.60 0.70 0.80 Quantile
Openness to experience
-0.8 -0.6 -0.4 -0.2 0.0 0.2 0.4
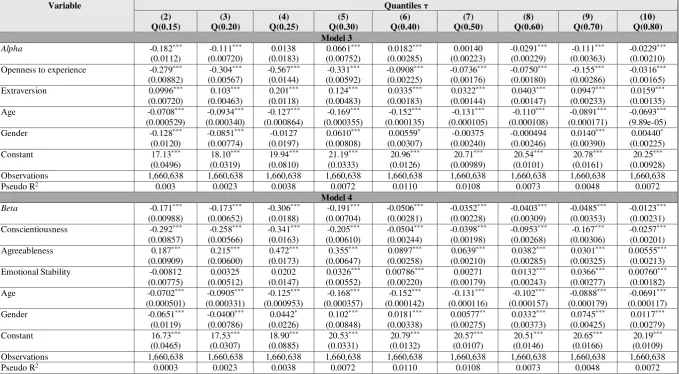
10 4. Robustness checks
To check for the robustness of our findings, we re-estimate our model by
aggregating the Big Five personality traits into two higher-order factors namely ‘Alpha’
(agreeableness, conscientiousness, and emotional stability), and ‘Beta’ (extraversion
and openness to experience). The former, represents the socialization and stability
factor, while the latter denotes the personal growth and plasticity factor (Wei et al,
2017).
Overall, we find similar results from the inclusion of these factors (Table 3).
Specifically, we confirm the stability of the signs of the estimated coefficients for all
the personality traits across the quantiles. Moreover, we argue that the socialization
factor is negative and significant at the lower and higher quantiles of the conditional
education distribution (Model 3). However, it remains positive and significant around
the median (Q50). Lastly, the other factor is negatively correlated with the education
11 Table 3: Robustness results
Variable Quantiles τ
(2) Q(0.15) (3) Q(0.20) (4) Q(0.25) (5) Q(0.30) (6) Q(0.40) (7) Q(0.50) (8) Q(0.60) (9) Q(0.70) (10) Q(0.80) Model 3
Alpha -0.182***
(0.0112) -0.111*** (0.00720) 0.0138 (0.0183) 0.0661*** (0.00752) 0.0182*** (0.00285) 0.00140 (0.00223) -0.0291*** (0.00229) -0.111*** (0.00363) -0.0229*** (0.00210)
Openness to experience -0.279***
(0.00882) -0.304*** (0.00567) -0.567*** (0.0144) -0.331*** (0.00592) -0.0908*** (0.00225) -0.0736*** (0.00176) -0.0750*** (0.00180) -0.155*** (0.00286) -0.0316*** (0.00165)
Extraversion 0.0996***
(0.00720) 0.103*** (0.00463) 0.201*** (0.0118) 0.124*** (0.00483) 0.0335*** (0.00183) 0.0322*** (0.00144) 0.0403*** (0.00147) 0.0947*** (0.00233) 0.0159*** (0.00135)
Age -0.0708***
(0.000529) -0.0934*** (0.000340) -0.127*** (0.000864) -0.169*** (0.000355) -0.152*** (0.000135) -0.131*** (0.000105) -0.110*** (0.000108) -0.0891*** (0.000171) -0.0693*** (9.89e-05)
Gender -0.128***
(0.0120) -0.0851*** (0.00774) -0.0127 (0.0197) 0.0610*** (0.00808) 0.00559* (0.00307) -0.00375 (0.00240) -0.000494 (0.00246) 0.0140*** (0.00390) 0.00440* (0.00225)
Constant 17.13***
(0.0496) 18.10*** (0.0319) 19.94*** (0.0810) 21.19*** (0.0333) 20.96*** (0.0126) 20.71*** (0.00989) 20.54*** (0.0101) 20.78*** (0.0161) 20.25*** (0.00928)
Observations 1,660,638 1,660,638 1,660,638 1,660,638 1,660,638 1,660,638 1,660,638 1,660,638 1,660,638
Pseudo R2 0.003 0.0023 0.0038 0.0072 0.0110 0.0108 0.0073 0.0048 0.0072
Model 4
Beta -0.171***
(0.00988) -0.173*** (0.00652) -0.306*** (0.0188) -0.191*** (0.00704) -0.0506*** (0.00281) -0.0352*** (0.00228) -0.0403*** (0.00309) -0.0485*** (0.00353) -0.0123*** (0.00231)
Conscientiousness -0.292***
(0.00857) -0.258*** (0.00566) -0.341*** (0.0163) -0.205*** (0.00610) -0.0504*** (0.00244) -0.0398*** (0.00198) -0.0953*** (0.00268) -0.167*** (0.00306) -0.0257*** (0.00201)
Agreeableness 0.187***
(0.00909) 0.215*** (0.00600) 0.472*** (0.0173) 0.355*** (0.00647) 0.0897*** (0.00258) 0.0639*** (0.00210) 0.0382*** (0.00285) 0.0301*** (0.00325) 0.00555*** (0.00213)
Emotional Stability -0.00812
(0.00775) 0.00325 (0.00512) 0.0202 (0.0147) 0.0326*** (0.00552) 0.00786*** (0.00220) 0.00271 (0.00179) 0.0132*** (0.00243) 0.0366*** (0.00277) 0.00760*** (0.00182)
Age -0.0702***
(0.000501) -0.0905*** (0.000331) -0.125*** (0.000953) -0.168*** (0.000357) -0.152*** (0.000142) -0.131*** (0.000116) -0.102*** (0.000157) -0.0888*** (0.000179) -0.0691*** (0.000117)
Gender -0.0651***
(0.0119) -0.0400*** (0.00786) 0.0442* (0.0226) 0.102*** (0.00848) 0.0181*** (0.00338) 0.00577** (0.00275) 0.0332*** (0.00373) 0.0745*** (0.00425) 0.0117*** (0.00279)
Constant 16.73***
(0.0465) 17.53*** (0.0307) 18.90*** (0.0885) 20.53*** (0.0331) 20.79*** (0.0132) 20.57*** (0.0107) 20.51*** (0.0146) 20.65*** (0.0166) 20.19*** (0.0109)
Observations 1,660,638 1,660,638 1,660,638 1,660,638 1,660,638 1,660,638 1,660,638 1,660,638 1,660,638
Pseudo R2 0.0003 0.0023 0.0038 0.0072 0.0110 0.0108 0.0073 0.0048 0.0072
12 5. Conclusions
By utilizing a flexible quantile regression analysis, we investigate the impact of
non-cognitive skills on education. To the best of our knowledge this is the first study
shedding light on the contribution of each of the Big Five personality traits on the
education decision made by the individuals.
Our findings, uncover a significant effect of non-cognitive skills on the level of
education, with the signs remaining stable across the different quantiles. Lastly, our
model survived robustness checks under the inclusion of two aggregated higher-order
factors.
Acknowledgments
The author would like to thank Dr Jackson G. Lu from Columbia Business
13 References
Buchinsky M. (1998). “Recent advances in quantile regression models”. Journal of
Human Resources, 33(1), 88–126.
Cobb-Clark, D.A., Schurer S. (2012). “The stability of big-five personality traits”,
Economics Letters, 115(1): 11-15.
Distante, R., Petrella, I., and Santoro, E. (2018). “Gibrat’s law and quantile regressions:
An application to firm growth”, Economics Letters,164: 5–9
Dwan, T.,Ownsworth, T. (2017). “The Big Five personality factors and psychological
well-being following stroke: a systematic review”. Disability and Rehabilitation: 1–
12. doi:10.1080/09638288.2017.1419382
Friedman, Schustack, Howard and Miriam (2016). Personality: Classic theories and
modern research. Pearson.
Halkos, G., and Polemis, M (2018). “Does market structure trigger efficiency? Evidence for
the USA before and after the financial crisis” Munich Personal RePEc Archive, MPRA Paper
No. 84511.
Heckman, J,. Pinto, R., and Savelyev, P. (2013). “Understanding the Mechanisms
through Which an Influential Early Childhood Program Boosted Adult Outcomes”.
American Economic Review, 103(6):2052-2086.
Hoeschler P., Balestra S., Backes-Gellner U., (2018). “The development of
non-cognitive skills in adolescence”. Economics Letters. 163: 40-45.
Jones M.C. (1992). Estimating densities, quantiles, quantiles densities and density
quantiles. Annals of the Institute of Statistical Mathematics, 44(4), 721-727.
14
Koenker, R., Bassett, G. Jr (1978). “Regression Quantiles”. Econometrica 46(1):
33-50,
Machado, J.A.F., Mata, J., (2000). “Box–Cox quantile regression and the distribution
of firm sizes”. Journal of Applied Econometrics, 15 (3): 253–274.
Raymundo M Campos-Vazquez and Eduardo M Medina-Cortina and Roberto
Velez-Grajales, (2018) ''Cognitive ability and economic preferences: evidence from survey
and experimental data in Mexico'', Economics Bulletin, 38(3): 1406-1414
Schafer K.C., Schwiebert J. (2018). “The impact of personality traits on wage growth
and the gender wage gap”. Bulletin of Economic Research. 70(1): 0307-3378.
Wenqi W. et al. (2017). “Regional ambient temperature is associated with human