Proceedings of the 5th Workshop on Natural Language Processing Techniques for Educational Applications, pages 103–107 103
Joint learning of frequency and word embeddings
for multilingual readability assessment
Dieu-Thu Le Institute for Natural Language Processing (IMS)
University of Stuttgart [email protected]
Cam-Tu Nguyen National Key Laboratory for
Novel Software Technology Nanjing University [email protected]
Xiaoliang Wang National Key Laboratory for
Novel Software Technology Nanjing University [email protected]
Abstract
This paper describes two models that em-ploy word frequency embeddings to deal with the problem of readability assessment in multiple languages. The task is to de-termine the difficulty level of a given doc-ument, i.e., how hard it is for a reader to fully comprehend the text. The pro-posed models show how frequency infor-mation can be integrated to improve the readability assessment. The experimental results testing on both English and Chi-nese datasets show that the proposed mod-els improve the results notably when com-paring to those using only traditional word embeddings.
1 Introduction
Readability assessment is the task of determin-ing how difficult a given document is to under-stand. It is useful in many applications such as selecting learning material for children of differ-ent grade levels, for language learners, for com-prehension tests, skills training, text summarisa-tion, simplification systems and so on. Readability assessment has a long research history, and many methods have been developed in the last couple of decades (Dale and Chall, 1948; Mc Laughlin, 1969;Kincaid et al.,1975;Chall and Dale,1995; Si and Callan,2001;Heilman et al., 2007;Jiang et al.,2015;Wang and Andersen,2016). These ap-proaches, however, rely on hand-crafted features that depend heavily on the languages and require adjustment when applying to a new language. Our aim is to develop a universal method that can be used in a multilingual setting, which involve little effort when extending to other languages.
Recent machine learning techniques, such as convolutional neural networks (CNN) (Collobert
et al., 2011) typically do not have to be supplied with hand-crafted features. These models often use pre-trained word embeddings for NLP tasks and have been proven to achieve good results on multiple benchmarks (Mikolov et al.,2013b; Pen-nington et al., 2014;Mikolov et al., 2013a). The pre-trained word embeddings are generally de-signed in a way that they can capture word mean-ing and topics. Though they are useful since top-ics are good indications of whether a document is difficult to comprehend, word embeddings do not directly reflect the frequency levels of words.
In our scenario, it is desirable that the sys-tem can take into account the frequency level of words rather purely focusing on their meanings. It is based on the assumption that more frequent words are supposed to be easier to understand. We therefore propose two models that jointly repre-sent words based on their meanings with tradi-tional word embeddings and their frequency levels with the so-called frequency embeddings. These two embedding layers are employed in a CNN ar-chitecture to determine the readability level of a given document. Since this model does not depend on hand-crafted features, it can be easily adapted to multiple languages.
2 Related Work
tra-ditional metrics/formulae are designed with some specific language in mind, and thus they may not work well when applying to other languages.
The data driven approach treats readability as-sessment as a machine learning problem, that is to automatically learn the mapping from documents to difficulty levels based on training examples (Si and Callan, 2001; Heilman et al., 2007; Jiang et al.,2015;Wang and Andersen,2016). In these studies, documents are represented by different types of features such as bag of words, lexical and grammatical features extracted from parse trees (Heilman et al., 2007), grammatical templates (Wang and Andersen, 2016), word frequency smoothed by correlation information (Jiang et al., 2015). Most of these studies however require hand-crafted, language-dependent features, and not readily applicable to multilingual setting.
3 Our method
While traditional methods are simple to imple-ment, they focus mostly on Latin languages such as English. These methods are not easily trans-ferred to other languages especially Asian. Moti-vated by the recent success of Convolutional Neu-ral Network (CNN) models in many text classifi-cation tasks, we employ the models for learning and classifying a given text to its difficulty level.
Word embeddings are used transferrably in many general NLP tasks. They take into account the context in which a word appears to learn the representation of words. Although they can reflect word meaning and topics, they do not take directly frequency information of a word into account. In the readability assessment scenario, frequency in-formation is important in deciding whether a doc-ument is hard to read or not (Jiang et al.,2015).
From this observation, we propose a model that takes into account also word frequency informa-tion besides word embeddings. Our hypothesis is that the model can learn better from knowing words’ difficulty levels besides their meanings. Word embeddings help associating the topics of documents, which are important to assess the read-ability levels (e.g., there are topics that are more difficult to understand than others from their na-tures). In addition, frequency information plays the role of pointing out which words are more dif-ficult to understand1.
1We have not taken into account rare words that are easy
to understand, for examples names, locations
The three common metrics representing word frequency information are raw counts (number of times a word appears in the whole corpus), rank-ing (i.e., rank 0 for the most common word) and frequency classes. We take these metrics directly as an embedding vector represents words in the corpus. Among these metrics, the word frequency class information is the most generalised one.
In particular, the frequency class FC(w) of a word w describes the frequency freq(w) of the word in relation to the frequency freqmax of the most frequent word, i.e., the word with ranking 0 (Sabine Fiedler and Quasthoff,2012):
FC(w) = log2freqmax
freqw (1)
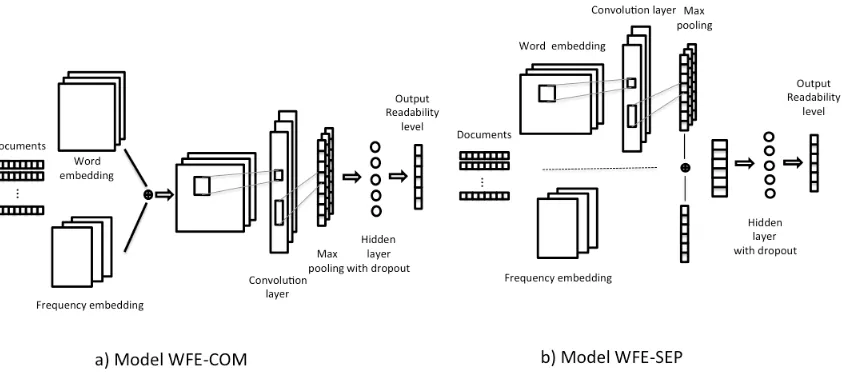
Our architecture is slightly different from the CNN architecture presented in (Kim, 2014). In particular, we propose two models (Figure 1) WFE-COM (left) and WFE-SEP (right).
WFE-COM Model. In this model, the filters are applied to the concatenated embeddings of word and frequency. The network learns these filters’ weights that activate features extracted from the these embeddings.
Letxwi ∈ Rkw andxf
i ∈Rkf, wherexi is a word in a sentence of lengthn,kw is the word embed-ding dimension and kf is the frequency embed-ding dimension. xwi represents the word embed-dings of wordwiwhilexfi represents its frequency embeddings.
Note that in the frequency embeddings, instead of randomly assigning values to unknown words as in word embeddings, we set them to the highest frequency class adopted from the training corpus. The sentence with lengthnis then represented by a matrix:
[xw1 ⊕xf1, ..., xwi ⊕xfi, ..., xwn⊕xfn] (2)
andxE
i =xwi ⊕x f
i represents the final embedding of wordxi, which is a concatenation of word and frequency embeddings. A feature map is gener-ated using filters of window sizehto the sentence matrix in Eq. 2, where a featureciis obtained us-ing a non-linear activation functionf:
ci =f(w·xEi:i+h−1+b) (3)
wherexi:i+h−1 represents the matrix which
com-poses of vectors fromxi toxi+h−1. This
convo-lution operation in Eq. 4 is applied on the win-dow size h from xi to xi+h−1, and the weights w∈Rhke wherek
Figure 1: Convolutional Neural Network architecture with word frequency embedding
We then apply max-over-time pooling opera-tions in the feature map.
WFE-SEP Model. In this model, word em-beddings and frequency emem-beddings are learned separately before being fetched into a fully con-nected layer. Convolutional layers and max pool-ings are applied to the word embeddpool-ings as these layers help finding and representing features of interests, while these layers are omitted for fre-quency embeddings.
The feature map extracted from applying the fil-ters on word embeddings is then computed as:
ci =f(w·xwi:i+h−1+b) (4)
Finally this feature map is concatenated with the frequency embeddings, and then use dropout for regularisation similar to the architecture described in (Kim,2014) (see section4.2).
4 Evaluation
4.1 Dataset
We evaluate our methods for English and Chinese readability assessment on two datasets collected by (Jiang et al., 2015). The first dataset, ENCT, was built with four reading levels from English New Concept textbook. The second dataset, CPT, was collected from Chinese primary textbook and contains six difficulty levels. In total, there are 279 documents with 4671 sentences in ENCT and 637 documents with 16145 sentences in CPT. In both datasets, the difficulty levels were assigned by hu-man experts. We split randomly the dataset 70% for training, 27% for testing and 3% for a devel-opment set.
4.2 Experiment setup
NDC-Level. The New Dale-Chall Readability level (Chall and Dale,1995) is a traditional read-ability test. PDW is the percentage of difficult words in a document, calculated as the number of difficult words divided by the total number of words in the document. Raw scoreΦis calculated
as: Φ = 0.1579×PDW + 0.0496×
nw
ns where
nw is the number of words andns is the number
of sentences in the whole corpus, hence nw
ns
rep-resents the average sentence length in the corpus. Finally, ifPDW is above 5%, then add 3.6365 to the raw scoreΦto get the adjusted score.
We implemented the New Dale-Chall Readabil-ity level (NDC) and converted the raw scoreΦto corresponding readability levels as follows:
Φ Dale-Chall Notes English Chinese
≤4.9 Grade 4 and Below level 1 level 1 5.0 to 5.9 Grades 5 - 6 level 1 level 2 6.0 to 6.9 Grades 7 - 8 level 2 level 3 7.0 to 7.9 Grades 9 - 10 level 3 level 4 8.0 to 8.9 Grades 11 - 12 level 3 level 5 9.0 to 9.9 College level 4 level 6
≥10 College Graduate level 4 level 6
Word embeddings (WE). For English, we used the pre-trained word2vec by (Mikolov et al., 2013b) on Google News. For Chinese, we col-lected a dataset consisting of news (≈320K doc-uments) and Wikipedia, tokenised and trained the word embeddings on it.
Model English Chinese
NDC-Level 55 17
Random-WE 64 32
Static-WE 80 41
Non-Static-WE 74 37
Multichannel-WE 76 37
Static-FE-class 75 39
Static-WFE-COM 77 40
[image:4.595.72.292.62.207.2]Static-WFE-class-COM 83 42 Static-WFE-class-SEP 93 49
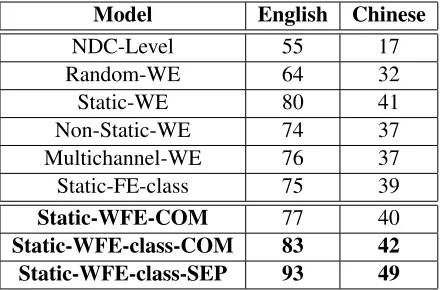
Table 1: Accuracy of readability assessment with different settings
dataset used for Chinese word embeddings.
CNN architecture. We followed the setting as suggested in (Kim, 2014). The filter windows’ sizes are 3, 4, 5 with 100 feature maps each. We used rectified linear units as activation functions for the convolutional layers, dropout rate of 0.5 and mini-batch size of 50.
Static and non-static WE.These two settings fol-lowed the method in (Kim,2014), where all words are kept either static (in static setting) or updated (in non-static setting) including the unknown ones while others parameters are learned.
Random-WE.All words are randomly initialised and modified while training.
Multichannel-WE.Each static and non-static WE is treated as one channel while gradients are back-propagated only through one of the channels.
Static-FE. Only frequency embeddings are used in this setting (without word embeddings).
Word Frequency Embeddings (WFE).We con-catenate the pre-trained word embeddings and the frequency embeddings as explained in section 3. In the WFE setting, we use the three frequency metrics: raw counts, ranking and frequency class, while in the WFE-class setting, we use only the frequency class metric. In both settings, the fre-quency embeddings are kept static during training.
4.3 Result and discussion
The result shows that the traditional method NDC works much better for English dataset (50%) than for Chinese (17%), which is probably explained by the fact that the formulae was originally de-signed for English language. Their results are still much lower than the CNN methods using pre-trained frequency and word embeddings.
The random-WE method works better for En-glish and much better for Chinese in compared
to the NDC, but lower than when using pre-trained frequency and word embeddings. It shows that pre-trained embeddings play an important role in determining the difficulty levels. Among three WE methods (using pre-trained word em-beddings), the static model achieves the best re-sults. Non-static model is supposed to fine-tune to the specific given task. However, in our case, it does not work as well as when keeping the embed-ding vectors static for both English and Chinese.
When using all frequency levels, word ranks and number of occurrences together for frequency embedding, the results are better than other mod-els. This model is however worse than when using only frequency class information. Since frequency class information is more representative than word counts and word ranks, it perhaps helps the model learn to classify the difficulty levels better in more general cases.
The result suggests that model WFE-SEP works better than WFE-COM. It means that it is not nec-essary to apply filters and max poolings on the fre-quency embeddings and the frefre-quency and word embeddings can be learned separated and finally concatenate before going to the fully connected layer. Finally, it shows that the frequency embed-dings help improving the results in both English (to 93% ) and Chinese (to 49%) when we con-catenate the frequency embeddings and word em-beddings, using the frequency class information. It proves our hypothesis that frequency informa-tion is useful in judging the difficulty level of a document. This method is extensible and can eas-ily be applied to different languages without prior knowledge about these languages.
5 Conclusion
References
Jeanne S Chall and Edgar Dale. 1995. Readability re-visited. The New Dale-Chall Readability Formula. Brookline: Brookline Books.
Ronan Collobert, Jason Weston, L´eon Bottou, Michael Karlen, Koray Kavukcuoglu, and Pavel Kuksa. 2011. Natural language processing (almost) from scratch. J. Mach. Learn. Res., 12:2493–2537.
Edgar Dale and Jeanne S Chall. 1948. A formula for predicting readability: Instructions. Educational re-search bulletin, pages 37–54.
Robert Gunning. 1952. The technique of clear writing.
Michael Heilman, Kevyn Collins-Thompson, Jamie Callan, and Maxine Eskenazi. 2007. Combining lexical and grammatical features to improve read-ability measures for first and second language texts. In Human Language Technologies 2007: The Con-ference of the North American, pages 460–467.
Zhiwei Jiang, Gang Sun, Qing Gu, Tao Bai, and Daoxu Chen. 2015. A graph-based readability assessment method using word coupling. InProceedings of the 2015 Conference on Empirical Methods in Natural Language Processing, pages 411–420.
Yoon Kim. 2014. Convolutional neural networks for sentence classification. InProceedings of the 2014 Conference on Empirical Methods in Natural Lan-guage Processing (EMNLP), pages 1746–1751.
J Peter Kincaid, Robert P Fishburne Jr, Richard L Rogers, and Brad S Chissom. 1975. Derivation of new readability formulas (automated readability in-dex, fog count and flesch reading ease formula) for navy enlisted personnel. Technical report, Naval Technical Training Command Millington TN Re-search Branch.
G Harry Mc Laughlin. 1969. Smog grading-a new readability formula. Journal of reading, 12(8):639– 646.
Tomas Mikolov, Kai Chen, Greg Corrado, and Jeffrey Dean. 2013a. Efficient estimation of word represen-tations in vector space.CoRR, abs/1301.3781.
Tomas Mikolov, Ilya Sutskever, Kai Chen, Greg Cor-rado, and Jeffrey Dean. 2013b. Distributed repre-sentations of words and phrases and their composi-tionality. In Proceedings of the 26th International Conference on Neural Information Processing Sys-tems - Volume 2, NIPS’13, pages 3111–3119, USA. Curran Associates Inc.
Jeffrey Pennington, Richard Socher, and Christo-pher D. Manning. 2014. Glove: Global vectors for word representation. InEmpirical Methods in Nat-ural Language Processing (EMNLP), pages 1532– 1543.
Dirk Goldhahn Sabine Fiedler and Uwe Quasthoff. 2012. Frequency Dictionary English. Uwe Quasthoff, Sabine Fiedler and Erla Hallsteindttir (eds.). Leipziger UniversitŁtsverlag.
Luo Si and Jamie Callan. 2001. A statistical model for scientific readability. InProceedings of the tenth international conference on Information and knowl-edge management, pages 574–576. ACM.