Munich Personal RePEc Archive
Natural disasters and economic growth
in Africa
Adjei-Mantey, Kwame and Adusah-Poku, Frank
Graduate School of Economics, Kobe University
1 March 2019
Online at
https://mpra.ub.uni-muenchen.de/95588/
Natural Disasters and Economic Growth in Africa
Kwame Adjei-Mantey*1, Frank Adusah-Poku *
Abstract
The continent of Africa has experienced its fair share of natural disasters historically and in contemporary times. The effect of natural disasters on economic growth has generated useful but inconclusive debates in the literature. Different studies have found positive, negative or no significant effects at all in some cases of disasters on growth. This makes the question of what
impacts natural disasters have on an economy’s growth a purely empirical one and more meaningful to be examined on a case by case basis. Using panel data solely for the continent of Africa from 1980-2015, our regression results show a significant negative effect of natural disasters on economic growth, growth in agricultural value-added and growth in industrial value-added. Additionally, our results also show that disaster effect appears and persists in the post-year periods. The negative relationship between economic growth and disasters is also robust to different disaster measures. We recommend the need to invest in the modernization of the agricultural sector in Africa with the goal of withstanding the negative effects of natural disasters.
Keywords: Africa, economic growth, disaster measures, natural disasters, climate change.
1Corresponding Author
*Graduate School of Economics, Kobe University, Japan.
1. Introduction
The occurrence of a natural disaster in any part of the world is troubling. Individual countries, regional bodies and other groups have become more concerned about the experiences of natural disasters irrespective of where they occur and have gotten more involved in helping deal with the ramifications of these disasters on the disaster locations. This is proof of the importance the global economy attaches to natural disasters. Though the occurrence of natural disasters dates back to history, contemporary times have experienced their own share of disasters. Recent experiences of natural disasters around the world include the 2011 earthquake that hit northeast
Japan of magnitude 9.0. Confirmed number of deaths according to the country’s reconstruction
agency stood at nearly 15,900 persons as of 2016 with many other persons unaccounted for. The 2010 earthquakes in Haiti and Chile, the 2004 tsunami in the Indian ocean as well as the devastating hurricane Katrina in 2005 are other examples of disaster happenings in recent times. These natural disasters together with many others usually lead to the loss of human lives and property causing economic and social damages to countries that suffer such disasters. Data from the Emergency Events Database (EM-DAT) for instance suggest that flood disasters alone in the past two decades have resulted in economic losses of an estimated $662 billion globally.
In Africa, there have been experiences of natural disasters as well. In August 2017, three days of heavy rainfall led to flooding and mudslide in Sierra Leone in which over one thousand died and many were unaccounted for. The 2011 drought that hit the East African countries of Kenya, Eritrea, Ethiopia, Somalia and Djibouti has been described as the worst drought to have been experienced in those countries in over 60 years. A volcanic eruption in Eritrea in 2011 and severe flooding suffered in Southern Africa in 2011 are just a few examples of many natural disasters that Africa has recorded in its recent history.
While natural disasters in general have been a major cause for concern, conclusions about its economic implications on disaster locations have been far from definite. The inconclusiveness of findings about the economic implications of natural disasters is confirmed by Klomp (2016) who posits that while about 25% of studies on this subject matter report a negative effect of disasters on per capita real GDP figures, 15% report the opposite. Evidence from the literature show that natural disasters can impact economic growth through such variables as capital accumulation (Leiter et al., 2009); trade (Gassebner et al., 2010; Oh and Reuveny, 2010) and employment (Umezawa, 2014). While some studies report that natural disasters positively affect economic growth (Albala-Bertrand, 1993; Skidmore and Toya, 2002; Ahlerup, 2013), others report that natural disasters affect economic growth negatively (MacDermott et al., 2014; Klomp, 2016) and others find no effect at all (Guo et al., 2015). The diversion in these findings can be well grounded in the theory of growth. On one hand, because natural disasters usually lead to loss of human lives and property, inputs into production including physical and human capital are reduced thereby reducing the capacity for productivity and production and hence subsequently, an expected fall in economic growth results. On the other hand, attempts to rebuild an economy that has suffered from a natural disaster may lead to better structures and systems as well as enhanced technologies being introduced which have the tendency to improve productivity and subsequently increase economic growth. Since both schools of thought are valid, it leaves the conclusion of the impact of disasters on a particular economy or region a purely empirical one.
It is in this light that our study attempts to empirically measure what the effect of natural disasters that have occurred in Africa have been on the economic situation of Africa.
looked at particular disaster events (Shabnam, 2014 [floods]; Cavallo et al., 2013 [earthquakes, floods and windstorms]; Strobl, 2012 [hurricanes] etc.) or studied together many countries across different parts of the globe with different characteristics. Loayza et al. (2012) have observed that economic growth in developing economies are more sensitive to disaster shocks with significant magnitudes of impacts. The assertions above make a study such as this for the African continent alone which is composed of mostly developing economies relevant to the literature. Indeed, current data from the International Monetary Fund (IMF) reveals that the region of Africa has an average GDP per capita at current prices of US$ 1,990 with most of these countries in the region being developing countries. It is estimated that more than 90% of disasters occur in low income countries (Klomp, 2016) and they are worse affected by these natural disasters in terms of economic losses in that a bigger share of their GDP is affected as opposed to developed countries; whose economic losses though may be huge in absolute terms, may form a relatively smaller share of their total output. Another important contribution of this study is in the different ways we examine the variable natural disaster. Among other measures, we also look at the intensity of the disaster.
Further, considering the increasing significant role of cross-country trade and economic relationships in Africa, and the unique similarities that African economies tend to exhibit, a study that attempts to examine the impacts of disasters particularly on the continent as a unit gives useful insights into how the economy of the continent is affected and subsequently, provides evidence to support policies that will benefit all African economies mutually.
1.1 Trends in disaster occurrences in Africa over the past two decades by subregion
[image:4.595.70.506.453.721.2]Figure 1 shows the trend in the occurrences of disasters in Africa by subregion in the past two decades.
Figure 1: Disaster trends in Africa by subregion, 1997-2017
Source: Authors’ compilation with data from EMDAT, 2018 0
10 20 30 40 50 60 70 80 90 100
Fre
q
u
e
n
cy
Trend in Disaster occurrences by subregion, 1997-2017
North Africa East Africa West Africa
From the figure, it can be observed that on average, the Southern Africa region recorded the least number of occurrences of disasters over the period followed by countries in the North African region. Save the years 2000, 2004, 2010 and 2014 the East African region appears to have recorded the greatest number of disasters over the period. It is worthy to note, however, that the East African region has the largest number of countries in its composition while the Southern Africa region has the least number of countries in its composition. This could perhaps be responsible for the differences in the total occurrences in the subregions. That notwithstanding, the figure reveals that the entire continent of Africa has had its fair share of disaster occurrences. These disasters include droughts, flooding, fire disasters, bacterial and viral disease spreads, tsunamis, explosions, cyclones among others.
The rest of the paper is organized as follows. Section 2 reviews literature in this area of study; section 3 details the methodology of the empirical analysis; section 4 discusses the results from the study and section 5 concludes this paper.
2. Literature Review
Skidmore and Toya (2002) examined the relationship among disasters, capital accumulation, total factor productivity and economic growth in a multi country study. They noted that climatic events had a positive relationship with economic growth while geological events had a negative relationship correlation with growth. Overall, they found a positive relationship between natural disasters and growth. They argued that although disaster risk reduces return to physical capital, it increases return to human capital. They further argue that subsequent to disaster happenings, capital stock is updated and newer technologies are adopted leading to an overall positive effect on total factor productivity and economic growth. Guo et al. (2015) conducted a study to examine the impact of recorded disasters in 30 provinces of China on economic growth subsequently. While meteorological class of disasters were found to promote growth through human capital, there was no overall significant impact of disaster on economic growth.
Both studies of Skidmore and Toya (2002) and Guo et al. (2015) suggest that through human capital, natural disasters can have a positive impact on economic growth. The former study, further emphasizes total factor productivity as a channel through which increased economic growth can result from natural disasters. The latter study, however, finds that overall, there is no significant effect of disasters on growth. This is in agreement with the study of Cavallo et al. (2013) discussed in the following.
Cavallo et al. (2013) used data on 196 countries to examine the impact of what they termed
“catastrophic” natural disasters on economic growth. They found that when they controlled for
political changes, even extremely large disasters did not have any significant effect on economic growth. In the absence of such controls, they found that only extremely large events had negative effect on growth.
for every 0.1% of the population affected by floods, there is a decrease in GDP per capita of 0.005% and this was attributed to the fact that floods most obvious effect is the destruction of the livelihoods of persons affected. Klomp (2016) examined the effects of natural disasters on economic development using night time light intensity as a measure of economic development. He found a negative relationship between these variables. He further found that climatic and hydrological disasters are more significant determinants of development in developing countries while for advanced economies, the more significant determinants were disasters in the geophysical and meteorological class. He found the degree of financial development in a country as well as the quality of political institutions as relevant in partly explaining the impact of disasters.
MacDermott et al. (2014) highlight the level of financial sector development as an important
determining factor in the effect that disasters would have on an economy’s growth. This points
out that when examining the effects of disasters on economies, it is important to study economies with similar characteristics together rather than lump up economies with different economic characteristics together in a single study. The study of Klomp (2016) interestingly examines the impact of disasters on economic development rather on economic growth only and thus uses night light intensity rather than GDP figures alone. As interesting as this is, it is important to note that not all economies especially economies with weaker institutions would necessarily translate increases in output into tangibles such as increased physical luminosity. Again, for many developing countries, even when institutions are not weak, development needs are multiple and it only takes policy discretion to decide how to channel proceeds from increases in growth. That said, it is important to examine, separately from such infrastructure
as night light intensity, what natural disaster effects are on the economy’s growth.
Strobl (2012) examined the growth impacts of hurricanes on developing economies in the Central American and Caribbean regions. The paper argues against investigating disaster impacts without paying specific attention to the region within which disasters occur due to the fact that different geographical regions suffer from different probabilities of experiencing a disaster for which reason it focuses solely on the geographical region it used for its study. After controlling for country specific economic conditions and timing of the disaster occurrence, the author finds that on average a hurricane strike resulted in loss in output growth by 0.84 percentage points in the study area. Felbermayr and Groschl (2014) also show in their study of over 100 countries that natural disasters unequivocally have negative effects on growth. They find that a disaster in the top 1 percentile disaster index causes a reduction in per capita GDP by almost 7% at the minimum the top 5 percentile index leads to a reduction of 0.46% in per capita GDP. They argue, though that factors such as stronger institutions, greater trade openness and financial openness help to reduce the negative effects of disasters on growth by speeding up the economic recovery process.
3. Empirical Analysis
3.1 Empirical Specification
We estimate the following empirical specification:
𝑌𝑖𝑡 = 𝛼 + ∑1𝑗=0𝐷𝑖𝑠𝑎𝑠𝑡𝑒𝑟𝑖𝑡−𝑗+ 𝑋𝑖𝑡+ 𝛾𝑖 + 𝜀𝑖𝑡 (1)
where 𝑌𝑖𝑡 is the log GDP per capita, growths in agricultural, industrial and services value added in country i at time period t, and 𝐷𝑖𝑠𝑎𝑠𝑡𝑒𝑟𝑖𝑡−𝑗 denotes either an occurrence of a disaster, disaster intensity, the number of deaths resulted or the number of people affected. Log GDP per capita is used as a proxy for economic growth. We make use of all the different types of disasters including droughts and floods. Control variables such as trade openness, quality of institutions, population and capital investment are captured by 𝑋𝑖𝑡, and country-specific effects are captured by 𝛾𝑖 controlling for unobserved heterogeneity across countries. We allow up to a one-year lag because of the possibility for the effects of disasters to persist for more than the current period of the disaster.
3.2. Data Description
Most studies on the growth effects of natural disasters (Loayza et al. 2012; Felbermayr and Groschl, 2014; Dell et al. 2012) have utilized the Emergency Events Database (EM-DAT) provided by the Center for Research on the Epidemiology of Disasters (CRED). This study also makes use of this data for our disaster variables. The EM-DAT is compiled from various sources including UN agencies, non-governmental organizations, national governments, insurance companies, research institutes and press agencies. There are more than 22,000 disasters in the EM-DAT ranging from natural to technological disasters. For an event to be termed as a disaster in the EM-DAT, it should meet one of the following criteria: 10 or more people were reportedly killed, 100 or more were reportedly affected, a state of emergency was declared, or international assistance was called for.
We also include some control variables used in related papers of Loayza et.al (2012) and Felbermayr and Groschl (2014). These authors make use of a set of structural and domestic policy variables. Structural factors include variables such as total population (variable of the size of the economy), polity index (an index of democratization) and trade openness (defined as imports plus exports divided by GDP). Capital investment (defined as gross capital formation) is used as a proxy for domestic policy in a country. Data on control variables such as population, trade openness and investment capital are drawn from the World Development Indicators. Data on quality of institutions are taken from the Polity IV project. The study uses an unbalanced panel data covering 50 sub-Saharan African countries. Data covers the period, 1980-2015.
250,000 people are affected by a disaster in Africa with about 449 people losing their lives or found missing. We also construct a variable called disaster intensity to measure the intensity of a disaster. This variable is defined as the ratio of the number of people affected and left homeless (people affected) to the population of a country.
Table 1: Summary Statistics
Variable Obs. Unit Mean S D Min. Max.
GDP per capita 1732 USD 1833.26 2535.25 115.44 20172.31
Growth Industrial sector 1416 % 4.25 10.87 -73.65 127.44
Growth Services sector 1420 % 4.46 7.20 -57.12 66.12
Growth Agric. sector 1423 % 3.26 10.65 -44.62 73.58
Population 1796 1000 people 15400 22400 220.605 182000
Polity index 1771 Index -1.18 5.95 -10 10
Trade openness 1705 share 0.73 0.49 0 5.32
Capital Investment 1514 Million USD 4160 1050 -20.6 97400
Disaster occurrence 1800 dummy 0.65 0.48 0 1
Death toll 1800 people 449.0 8254.84 0 300000
People affected 1800 1000 people 250.373 1164.063 0 23300
Disaster intensity 1796 ratio 0.022 0.088 0 1.051
4. Empirical Results
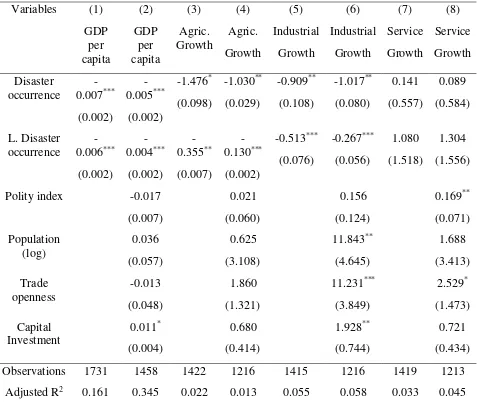
not statistically significant with the exception of capital investment. The negative correlation between disasters and growth still holds with the inclusion of the full battery of control variables. Although the effect is still negative and statistically significant, the magnitude of the effect reduces.
We also find a negative relationship between an occurrence of a disaster and the growth in agricultural value-added. Specifically, an occurrence of a disaster reduces growth in agricultural value-added by 1.48 percentage points in the first year with a 0.36 percentage points decline in the second year. The coefficients of disaster occurrence and its first lag are still negative and statistically significant even after we have controlled for other factors as shown in column 4. Our results are consistent with the results of Dell et.al (2012) who found a negative impact of temperature on industrial valued-added. The agricultural sector is a key backbone of economies of many African countries. Industrial production is also often dependent on inputs from the agricultural sector. One of the channels through which disasters affect agricultural growth rates is its effects on access to raw materials and intermediate inputs. Disasters such as floods, drought and bacteria disease decrease access to agricultural raw materials like seedlings and unharvested plants or fruits, thereby leading to a decline in the growth of the agricultural sector. Another possible channel is the effect of disaster on total factor productivity. Disasters like storm, floods and landslide could destroy agricultural infrastructure such as dams and irrigation canals which could slow down the growth of the sector via the productivity of these infrastructure. Extreme weather events such as floods and drought could lower agricultural yields resulting in a reduction in the growth of agricultural value-added.
Table 2: The effect of disasters on different growths, measured by disaster occurrence.
Variables (1)
GDP per capita (2) GDP per capita (3) Agric. Growth (4) Agric. Growth (5) Industrial Growth (6) Industrial Growth (7) Service Growth (8) Service Growth Disaster occurrence -0.007*** (0.002) -0.005*** (0.002) -1.476* (0.098) -1.030** (0.029) -0.909** (0.108) -1.017** (0.080) 0.141 (0.557) 0.089 (0.584) L. Disaster occurrence -0.006*** (0.002) -0.004*** (0.002) -0.355** (0.007) -0.130*** (0.002) -0.513*** (0.076) -0.267*** (0.056) 1.080 (1.518) 1.304 (1.556)
Polity index -0.017
(0.007) 0.021 (0.060) 0.156 (0.124) 0.169** (0.071) Population (log) 0.036 (0.057) 0.625 (3.108) 11.843** (4.645) 1.688 (3.413) Trade openness -0.013 (0.048) 1.860 (1.321) 11.231*** (3.849) 2.529* (1.473) Capital Investment 0.011* (0.004) 0.680 (0.414) 1.928** (0.744) 0.721 (0.434)
Observations 1731 1458 1422 1216 1415 1216 1419 1213
Adjusted R2 0.161 0.345 0.022 0.013 0.055 0.058 0.033 0.045
*p < 0.1, **p < 0.05, ***p < 0.01. robust standard errors are clustered by country and reported
in parentheses.
Note: Agric. Growth, Industrial Growth and Service Growth are annual % growth in Agricultural value added, Industrial value added and Services value added.
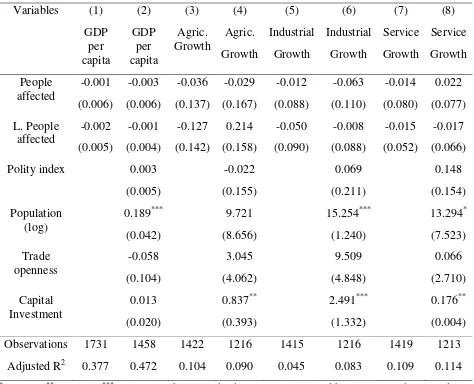
not find a statistical relationship in the case of service value-added confirming our earlier results in table 2.
Table 3: The effect of disasters on different growths, measured by disaster intensity
Variables (1)
GDP per capita (2) GDP per capita (3) Agric. Growth (4) Agric. Growth (5) Industrial Growth (6) Industrial Growth (7) Service Growth (8) Service Growth Disaster intensity -0.014** (0.054) -0.009** (0.002) -7.540** (1.424) -9.006** (1.973) -2.754* (0.865) -3.110** (0.102) 1.262 (1.557) 1.486 (1.689) L. Disaster intensity -0.012** (0.053) -0.008** (0.017) -1.929* (0.079) -0.596** (0.055) -0.365* (0.030) -1.359** (0.095) 1.182 (3.585) 1.151 (3.768)
Polity index -0.054
(0.017) 0.023 (0.063) 0.161 (0.125) 0.163** (0.072) Population (log) 0.081 (0.596) 0.081 (3.036) 11.078** (4.522) 2.464 (3.219) Trade openness 0.122 (0.090) 2.117 (1.340) 11.401*** (3.847) 2.410 (1.478) Capital Investment 0.118* (0.010) 0.667 (0.415) 1.932** (0.757) 0.716 (0.427)
Observations 1731 1458 1422 1216 1415 1216 1419 1213
Adjusted R2 0.151 0.338 0.022 0.017 0.045 0.058 0.030 0.040
*p < 0.1, **p < 0.05, ***p < 0.01. robust standard errors are clustered by country and reported
in parentheses.
Note: Agric. Growth, Industrial Growth and Service Growth are annual % growth in Agricultural value added, Industrial value added and Services value added.
Table 4: The effect of disasters on different growths, measured by death toll
Variables (1)
GDP per capita (2) GDP per capita (3) Agric. Growth (4) Agric. Growth (5) Industrial Growth (6) Industrial Growth (7) Service Growth (8) Service Growth
Death toll -0.0013** (0.002) -0.0019* (0.002) -0.201** (0.001) -0.396** (0.099) -0.111** (0.001) -0.351** (0.150) -0.004 (0.002) -0.318 (0.299)
L. Death toll -0.008**
(0.001) -0.0041* (0.002) -0.409* (0.093) -0.828*** (0.282) -0.228*** (0.080) -0.500*** (0.041) 0.111 (0.178) 0.083 (0.136)
Polity index 0.004
(0.005) 0.044 (0.163) 0.286 (0.202) 0.098** (0.001) Population (log) 0.230** (0.066) -2.763 (7.177) 14.847 (9.005) 1.493** (0.740) Trade openness 0.009 (0.094) 1.629 (2.434) 12.770 (9.769) 1.369 (2.180) Capital Investment 0.013 (0.019) 0.684 (0.475) 2.638** (1.300) 0.346 (0.610)
Observations 1731 1458 1422 1216 1415 1216 1419 1213
Adjusted R2 0.421 0.496 0.041 0.058 0.078 0.056 0.033 0.059
*p < 0.1, **p < 0.05, ***p < 0.01. robust standard errors are clustered by country and reported
in parentheses.
Table 5: The effect of disasters on different growths, measured by people affected
Variables (1)
GDP per capita (2) GDP per capita (3) Agric. Growth (4) Agric. Growth (5) Industrial Growth (6) Industrial Growth (7) Service Growth (8) Service Growth People affected -0.001 (0.006) -0.003 (0.006) -0.036 (0.137) -0.029 (0.167) -0.012 (0.088) -0.063 (0.110) -0.014 (0.080) 0.022 (0.077) L. People affected -0.002 (0.005) -0.001 (0.004) -0.127 (0.142) 0.214 (0.158) -0.050 (0.090) -0.008 (0.088) -0.015 (0.052) -0.017 (0.066)
Polity index 0.003
(0.005) -0.022 (0.155) 0.069 (0.211) 0.148 (0.154) Population (log) 0.189*** (0.042) 9.721 (8.656) 15.254*** (1.240) 13.294* (7.523) Trade openness -0.058 (0.104) 3.045 (4.062) 9.509 (4.848) 0.066 (2.710) Capital Investment 0.013 (0.020) 0.837** (0.393) 2.491*** (1.332) 0.176** (0.004)
Observations 1731 1458 1422 1216 1415 1216 1419 1213
Adjusted R2 0.377 0.472 0.104 0.090 0.045 0.083 0.109 0.114
*p < 0.1, **p < 0.05, ***p < 0.01. robust standard errors are clustered by country and reported
in parentheses.
Note: Agric. Growth, Industrial Growth and Service Growth are annual % growth in Agricultural value added, Industrial value added and Services value added.
5. Conclusion
The regression results show a significant negative effect of natural disasters on economic growth, growth in agricultural value-added and growth in industrial value-added. However, we do not find evidence of a statistically significant negative relationship between disasters and growth in services value-added. We also find that the growth effects of disasters are largely robust to different disaster measures such as disaster intensity and death toll. Our results also show that disaster effect appears and persists in the post-year periods.
References
Ahlerup, P. (2013). Are natural disasters good for economic growth? Working papers in
Economics No 553. University of Gothenburg. ISSN 1403-2465
Albala-Bertrand, J. M. (1993). Natural disaster situations and growth: A macroeconomic model for sudden disaster impacts. World Development 21 (9): 1417-1434
Cavallo, E., Galiani, S., Noy, I. and Pantano J. (2013). Catastrophic natural disasters and economic growth. The Review of Economics and Statistics, 95(5): 1549-1561
Dell, M., Jones, F.B., and Olken, A. B. (2012). Temperature shocks and economic growth: evidence from the last half century. America Economic Journal:
Macroeconomics, 4(3): 66-95.
Felbermayr, G., and Groschl, J. (2014). Naturally negative: The growth effects of natural disasters. Journal of Development Economics, 111: 92-106.
Gassebner, M., Keck, A. and Teh, R. (2010). Shaken, not stirred: The impact of disasters on international trade. Review of International Economics 18(2): 351-368.
Guo, J., Liu, H., Wu, X., Gu, J., Song, S. and Tang, Y. (2015). Natural disasters, economic growth and sustainable development in China—An empirical study using provincial panel data. Sustainability 2015 (7): 16783–16800
Klomp, J. (2016). Economic development and natural disasters: A satellite data analysis.
Global Environmental Change 36: 67-88
Leiter, A. M., Oberhofer, H. and Raschky, P. A. (2009). Creative disasters? Flooding effects on capital, labour and productivity within European firms. Environmental
Resource Economics 43: 333-350.
Loayza, N., Olaberria, E., Rigolini, J., and Christiaensen, L. (2012). Natural disasters and growth: Going beyond averages. World Development 40 (7): 1317-1336
McDermott, T., Barry, F., and Tol, R. (2014). Disasters and development: natural disasters, credit constraints, and economic growth. Oxford Economic Papers 66 (2014), 750-773. Oxford University Press
Oh, C. H., and Reuveny, R. (2010). Climatic natural disasters, political risk, and international trade. Global Environmental Change 20(2010) 243-254
Shabnam, N. (2014). Natural disasters and economic growth: A review. International Journal
of Disaster Risk Science 5: 157-163.
Skidmore, M. and Toya, H. (2002). Do natural disasters promote long run growth? Economic
Strobl, E. (2012). The economic growth impact of natural disasters in developing countries: Evidence from hurricane strikes in the Central American and Caribbean regions.
Journal of Development Economics 97: 130-141
Umezawa, S. (2014). The great East Japan earthquake: Its damages, impacts on the labour economy and restoration measures of the government. Labour Market Impacts of Natural and Environmental Disasters. Japan Institute for Labour Policy and