Munich Personal RePEc Archive
Capital deepening and efficiency in
Morocco
EZZAHID, Elhadj and NIHOU, Abdelaziz
Mohammed V University, Faculty of Law and Economics, Rabat,
Prime Minister Administration, Rabat
3 October 2017
Online at
https://mpra.ub.uni-muenchen.de/82143/
1
Capital deepening and efficiency in Morocco
Elhadj Ezzahid
1and Abdelaziz Nihou
21 Mohammed V University, Faculty of Law and Economics, Rabat 2 Prime Minister Administration, Rabat
October 3, 2017
e-mail: [email protected]
Abstract
Investment is at the heart of economic growth. It increases the available stock of capital for productive activities and allows the introduction, in the productive process, of improved technology embedded in new capital items. Monitoring accumulation and use of this capital is a big issue. Our paper aims to bring a diagnostic of the Moroccan case by responding to these two questions: is capital stock sufficient? Is it efficiently used? Our results show that Morocco recorded an overinvestment in the 1970s, an underinvestment in the period 1982-2004 and an overinvestment since mid-2000s. The estimation of the rate of return to capital in the Moroccan economy indicates that RRK was under 10% until the beginning of the 1990s. Since then, it recorded a steady increase that culminated at 18% around 2004. After this date, it began to decrease. We attribute the low level of capital-labor ratio in Morocco to the high price of investment goods compared to consumption goods especially before 2000, to the insufficiency of human capital accumulation and absorption, and to the low level of TFP. The major conclusion of this paper is that the debate about the efficiency of capital use must go hand in hand with an exploration of why capital accumulation in Morocco is insufficient.
Key words: Investment, capital, efficiency of capital use, rate of return to capital,
2
1. Introduction
T
he growth performance of an economy depends on the volume of mobilized resources, on the mix/pool of projects (uses) to which these resources are allocated, and on the efficiency with which resources are used in these projects (World Bank, 1993). Capital and labor (respectively K and L) are the two main factors of production used in productive activities in any economy. In many countries, the mobilized quantity of those factors is not the problem but the concern lies in the quality of their use to obtain the maximum production (Easterly and Levine, 2001). As argued by many authors (Young, 1992), accumulation of resources can go hand in hand with less efficiency in their use and, henceforth, with low total factor productivity (TFP).Efficiency in resources use is vital for developing countries that struggle to accumulate more physical and human capital so as to be able to increase their per capita GDP and, consequently, converge to the standards of life prevailing in developed countries. One of the striking features of the economies of developing countries is their low capital-labor ratios (Lucas, 1990). Thus, scarcity of resources, borrowed for many countries, is a major incentive to use them efficiently. On the other hand, the neoclassical theory of growth predicts that scarcity of capital in less developed countries leads to a higher physical marginal product of capital (MPK) comparatively to what prevails in developed countries. Consequently, the rate of return to capital, hereafter RRK, in developing countries will be higher. This is a major argument in favor of more aid (financial assistance) for development from rich to poor countries. Furthermore, advocates of foreign direct investment use the neoclassical prediction, concerning higher MPK in developing countries, to convince developing countries policy-makers to open their capital account and devise adequate policies to attract foreign savings. They argue that this will have benefits for both developing countries that receive more capital, with embedded and transferred technology, and developed countries, that will receive more return from their savings.
The observation of R. Lucas (Lucas, 1990), concerning the drastic differences between developed and developing countries capital-labor ratios and the absence of the expected huge flows of capital from rich countries to poor ones, is the catalyst of a burgeoning literature that proved the equality of inter-countries financial MPKs when they are properly measured (Casselli and Feyrer, 2007).
post-3
independence period and accentuated under the structural adjustment program carried over the period 1983-1993. This mainly public effort has resulted in/to a high rate of aggregate investment. The high level of aggregate investment raises many questions such as: is this level of investment financially sustainable? Does the aggregate investment (public and private) produce the expected growth?
Many measures are used to estimate the pace of capital accumulation in an economy. There are the rate of investment (ratio of investment to GDP: I/Y) and the capitalistic intensity or capital-labor ratio K/L. I/Y and K/L are indicators that measure efforts to increase the available stock of capital in an economy. To estimate the efficiency of capital use in Morocco, the rate of return to capital (Casselli and Feyrer 2007, Bai and al. 2006), labor productivity (Y/L), and total factors productivity (TFP) are used. The objective is to answer the following questions. Is capital stock efficiently used in the Moroccan economy? Are there any indices that provide evidence on the existence of overinvestment? Our ultimate objective is to build a thorough and coherent picture about the extent of capital accumulation and the degree of efficiency in its use in the Moroccan economy.
The remaining part of this paper is as follows. The second section draws a descriptive picture of the stock of capital and the level of the aggregate rate of investment over a period of more than 40 years. The third section presents a bundle of indices to assess the efficiency of capital use in the Moroccan economy. In the fourth section, we provide some elements that explain the low speed of capital accumulation and hence the low level of capital-labor ratio in Morocco. The fifth section contains some concluding remarks.
2. Capital accumulation in Morocco: is there overinvestment in Morocco?
The World Bank classifies Morocco as a low middle-income country. The Moroccan per capita GDP oscillated around10% of the USA’s one over the period 1970-20101. The capital-labor ratio in Morocco is about 36 000 2005US$ whereas this
ratio is 288 3482005US$ in USA (PWT 8.1). A Moroccan worker uses almost 12% of the capital used by an American. This impedes the convergence of Moroccan per capita GDP to the level of American one. Graph 1 provides per capita GDP’s evolution in Morocco and a sample of countries.
4
Graph 1. Per capita GDP (PWT 8.1)
In order to catch up, Morocco intensified investment2 efforts since the outset of
the 2000s. The rate of investment (I/Y), that fluctuated around 23% all over the 1980s and the 1990s, began to increase steadily since the beginning of the millennium. Consequently, the annual average investment rate3 jumped to 32% during the period
2000-2013.
Growth rate and investment rate danced differently in last years (Graph 2). Remark that the 1980s and the 1990s are periods of a declining growth trend with an erratic and instable pattern. Since the beginning of the new millennium, a more stable pattern of growth emerged. The striking feature is that growth was not strongly and clearly linked with investment effort. The absence of correlation between growth and investment rate raises worries about the efficiency of resources’ use, especially of the accumulated capital in the economy.
2 Investment I is defined, in national accounting system, as the sum gross fixed capital formation
(GFCF) and variation in/of inventory S: I=GFCF+∆S.
3 For a comparative perspective, the investment rate in China was 37% during the period 1978-2000.
In Singapore, the investment rate in fixed asset attained 35.4% during the period 1966-1998 (Jun, 2003, p. 715).
0
10000
20
000
30
000
1970 1980 1990 2000 2010 Morocco South Korea
Poland South Africa Turkey Spain
5
Graph 2. Growth and investment rate (Morocco)
To find the quantity of investment that is above or below equilibrium investment-an unobservable quinvestment-antity, it is necessary to use a methodology to estimate this optimal or equilibrium investment. We will use the methodology developed by Qin and Song (2008) to estimate the volume of overinvestment in Morocco. This methodology proceeds as follows. In a first step, we estimate the equilibrium or optimal level of investment I* given the main determinants of the decision to invest. Overinvestment is just the difference between observed investment and optimal investment I* (overinvestment=I-I*). If this quantity is positive then the economy overinvests.
The two determinants of the decision to invest are demand change (accelerator effect), measured by the variation of GDP, and the cost of installing a new unit of capital measured by the Hall-Jorgensen user cost of capital. To derive a functional form between investment and its two major above fundamental determinants, Qin and Song (2007) suppose that the economy uses a CES production function with constant returns to scale as follows:
Y=f(K, L)=[αKρ+(1-α)Lρ]1/ρ
The elasticity of substitution is σ=1/(1-ρ) with ρ non null, strictly below 1, and different from 0. The parameter α (0<α<1) is the share of capital in income. The representative maximizes her profit PyY-PKK-PLL. The equilibrium conditions state
that profit is maximized when PYfK=PK and PYfL=PL. Consequently, at equilibrium the
equality fK/fL=PK/PL holds. This equality means that the rate of substitution and the
rate of transformation are equal. This result and the two first order conditions are used to derive the formula of the required capital at equilibrium K*. Indeed, we have:
K*=ασY(P K/PY)σ
10
20
30
40
50
Investment_Ra
te
2
3
4
5
6
GD
P_Gro
wth (s
mo
oth
)
1970 1980 1990 2000 2010
6
If the economy is at its steady state, then optimal investment is just what is necessary to replace depreciated capital. Henceforth, we will have: I*=δK*. Consequently, the two precedent equations lead to the following expression of optimal investment: I*=δασY(P
K/PY)σ. We log-linearize to obtain the following:
lnI*=lnA+lnY-σlnC⇔ lnI*-lnY=lnA-σlnC⇔ln(I*/Y)=lnA-σlnC Here A=δασ and C=P
K/PY. To find the volume of optimal investment, we run the
equation between I/Y and the relative price of capital in terms of GDP price (transformed to their logarithms). We use the PWT 8.1 dataset for the period 1970-2011. The resulting regression is:
ln(I/Y)=0.18-0.12lnC+ζt
(7.8) (-4.2)
R2=0.57 (t-statistics in parentheses)
To back up the amount of investment that is above what is predicted by its fundamental determinants in percent of GDP, we use the following equation lnI/Y-ln(I*/Y)=ζt. Thus, the rate of over-investment is the exponent of ζt. (exp(ζt)).For
Morocco, the resulting rate of excessive investment is depicted in graph 3.
Graph 3. Overinvestment in Morocco as % of GDP
The second half of the 1970s was characterized by overinvestment that attained its highest level in 1978. The 1970s high investment rate followed the boom of government investment boosted by the increase of the price of phosphates. Since then, overinvestment decreased and transformed to underinvestment in the 1980s, the 1990s, and the first years of the 2000s. This period main feature is the austerity dictated by the Structural Adjustment Program. The third period, that began around 2004, featured an overinvestment. This period coincided with the availability of huge resources due to the privatization of public firms and the surge of FDI’s inflows.
-5
0
5
10
1970 1980 1990 2000 2010
7
When we state that the data provide evidence that, during a given period, there was overinvestment that does not imply that resources are inefficiently used. This only raises concerns on the quality of resources’ use. Indeed, the scarcity of resources is a major incentive to care about their efficiency, especially if investment is above what is predicted by its main determinants.
3. Efficiency of capital use in Morocco
Efficiency of reproducible capital is measurable by its rate of return. It can also be measured by the average labor’s productivity Y/L. The respective contributions of capital and TFP to growth, measured by the growth accounting technique4, are two
other available metrics to gauge the quality of resources’ use in the economy.
To estimate the rate of return to capital, we suppose that the economy uses two factors of production, namely labor (L) and capital (K), and is sufficiently competitive. We do not assume any technological relationship between inputs and output but we do require that the economy is operating under constant returns to scale technology. Only the institutional hypothesis of perfect competition is necessary. Thus, the value added of the economy Y is shared between the two contributing factors proportionally to their marginal productivity. The share of capital is denoted α.
The hypothesis of perfect competition of the economy implies that economic agents continue to invest, i.e. increase the stock of capital, until the marginal revenue of the investor from the added/incremental capital, PYMPK (gain), equals its unitary
cost PK(loss). Consequently, PY×MPK×K will be capital total remuneration and
(MPK×K)/Y is its (relative) share in value added already denoted α. If we know the share of capital α in income, we can recover the unobservable variable MPK as follows:
= =
Data used in this paper are from the PWT 8.1. We measure the rate of return using a rough estimation of the share of capital in income. It’s one minus the share of labor as provided by PWT 8.1 (Feenstra et al. 2015). The RRK depends on three variables: the share of capital in Y: α, the relative price of value added compared to
4To separate the contribution of capital, labor, and TFP to growth, we suppose a constant
returns to scale Cobb-Douglass production function with two productive factors K and L so as
Y=AKαL1-α. A is total factors productivity denoted TFP. The growth version of this formula is
8
capital goods: PY/PK, and the inverse of the capital-output coefficient: K/Y. Graph 4
depicts RRK evolution in Morocco over the period 1970-2011.
Graph 4. Marginal product of capital
In Morocco, the evolution of the rate of return to capital exhibits three different periods. In the first period, spanning from 1969 to 1986, the rate of return to capital fluctuated around 7%. Since then, RRK began steadily to increase and attained its maximum of about 18% in 2004. This evolution was parallel to the structural reforms of the Moroccan economy implemented since mid-1980s. Recall that these reforms had as objectives to liberalize the economy, to open it to foreign trade, to improve investment climate, and to reduce the prevalence of distortionary regulations. At the end of the period 1986-2004, the RRK started a decreasing trend. This decrease, since 2004, is probably due to microeconomic distortions such as faster increase of the prices of capital goods compared to the price of consumption goods approximated by the GDP price index (graph 4).
Examining the joint evolution of TFP and labor productivity (Y/L) provides insights on the excessiveness or not of investment in Morocco since the outset of 2000s. If K increases more rapidly than Y this may be symptomatic of a substantial decrease of TFP. Furthermore, if the accumulated capital partly substitutes labor and Y does not decrease; labor productivity(Y/L) increase.
The high investment rate levels, during the periods 1970-1977 and 2000-2012, induced an increase of capital intensity by respectively 2.8% and 5.4%. These two periods are also characterized by substantial growth of labor productivity and of total factor productivity. During the period 1984-2000, K/L remained practically constant. Over the periods 1978-1983 and 1991-2000, Y/L decreased. Given positive growth rates of Y/L and of TFP along the period 2001-2012, we can not conclude that investment was not efficiently allocated compared to the 1990s (table 1).
5
10
15
20
1970 1980 1990 2000 2010
9
Table 1. Growth accounting
The increase of capital at a higher rate compared to labor growth rate induces a process of capital deepening materialized by a growing per worker stock of capital k=K/L. This is a common stylized fact widely documented since it was signaled out by N. Kaldor (1960). Remark that it’s expected that productivity of labor y (Y/L) increases when the capital endowment of each worker k(K/L) increases. If capital increases faster than output with a growing productivity of labor Y/L, it may be informative of a process of substitution of capital to labor or a decreasing TFP.
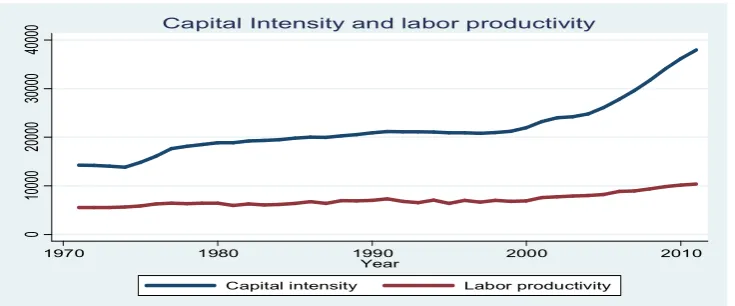
It’s possible that during a growth period such as the period 2001-2012 in Morocco, capital and labor increase simultaneously. That is, they are roughly complements. When a crisis erupts, capital and labor may become substitutes. In a downturn period and if employment brakes terribly and investment continue to be at momentum for multiple reasons, we will observe over-accumulation and less recruitment. In Morocco, increase of capital intensity was accompanied with an improvement of labor productivity since 2007 (Graph 5). This is due to an increase of investment and a reduction of net jobs creation since 2007 that attained in 2012 a record hollow with only100 additional jobs.
Graph 5. K/L and Y/L
This analysis proves that investment was relatively productive and would been more productive if its complementary factors were available. Indeed, comparing
0
10000
20000
30000
40000
1970 1980 1990 2000 2010
Year
Capital intensity Labor productivity Capital Intensity and labor productivity
Growth rate of Y Y/L growth Growth of K/L Growth of TFP
1970-1977 6,0% 2,2% 2,8% 0,9%
1978-1983 3,0% -1,0% 1,3% -1,1
1984-1990 4,6% 2,0% 1,1% 1,2%
1991-2000 2,5% -0,2% 0,2% -0,2%
10
capital-labor ratio in Morocco and in other developing countries showed that, in Morocco, the accumulation of capital is elementary and is far from providing the basics necessary for a permanent increase of labor productivity (Graph 6).
Graph 6. K/L in comparative perspective
4. Why capital-labor ratio is so low in Morocco?
We discuss below the probable links between relative cost of investing compared to the cost of consuming, availability of human capital, and magnitude of TFP and the low capital-labor ratio in Morocco. Our objective is to discuss what we judge as the most constraining variables on capital accumulation and efficiency in the Moroccan economy.
4.1. Relative price of capital goods compared to consumption goods
Available empirical literature shows that the higher the price of investment goods relative to the price of consumption goods the lower will be the rate of economic growth (Sala-i-Martin and al., 2003). E. Artadi and X. Sala-i-Martin (2003) showed that North African countries are the locations where capital goods are the most expensive in the World.
Developing countries produce simple products and few of them are able to produce capital goods. Available results provide evidence that these countries are less productive in tradable goods comparatively to their ability to produce non-tradable goods (Casselli and Feyrer, 2007; Hsieh and Klenow, 2003). These non-tradable goods are generally used as consumption goods. For this, it’s plausible to think that the relative price of investment goods to consumption goods is high (Alfaro and Ahmed, 2009). The later authors provide evidence showing a higher capital price in developing
0
100000
2000
00
3000
00
Ca
pital intensity K/L
1970 1980 1990 2000 2010 Morocco South Korea
Poland Turkey Spain
11
countries. Recall that Morocco imports the major part of equipment, machinery, and other items considered as investment goods.
Graph 7. Relative cost of investment
Available data about Morocco suggest that until mid-1990s, the price of capital goods compared to the price of consumption goods is abnormally higher (Graph 7). Until mid-1990s, investment is expensive in Morocco compared to Poland, Turkey, Spain and South Korea. Reforms undertaken in the SAP allowed to correct many distortions and to bring down the relative price of investment compared to the price consumption. Currently, the price of investment is anymore a barrier to capital accumulation; the problem is elsewhere.
4.2. Scarcity of skilled labor and insufficiency of TFP : bottlenecks in
complementary factors
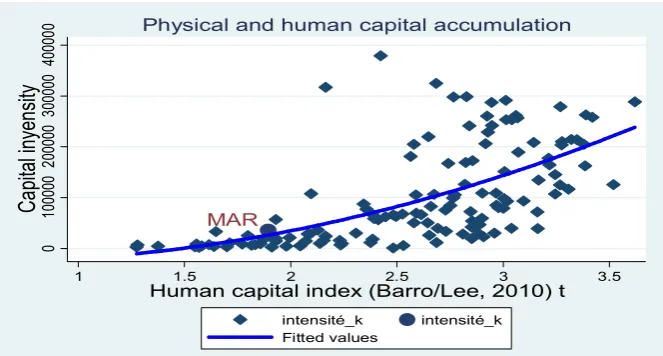
As it has been highlighted by Lucas (1990) and Casselli and Feyrer (2007) for developing countries, the low level of capital-labor ratio in Morocco, and hence insufficient accumulation, may be due to the low level of available human capital or the low level of TFP. Indeed, data show a positive link between human capital availability and capital-labor ratio (Graph 8).
Graph 8. Physical capital v.s. human capital
.5
1
1.5
2
2.5
Price investment /Price consumption
1980 1990 2000 2010
Morocco South Korea Poland Turkey Spain
12
[image:13.595.133.465.72.250.2]Concerning the insufficiency of human capital in the Moroccan economy. Table 2 provides for the whole economy, disaggregated into 5 economic sectors, the distribution of labor force by level of education. The low level of capital-labor ratio in Morocco can be explained by the low rate of return of capital resulting from the low quality of the complementary factor that is labor. Indeed, one third of the Moroccan labor force was endowed with no educational qualifications in 2012. Created jobs in the economy benefit to no qualified workers or to those with low level of qualifications. This is the case of the formal sector and, at a higher proportion, of the informal sector. Those with high qualifications are allocated/attracted to rent seeking activities where productivity, innovation and upgrading are far from being the rule.
Table 2. Education of employed population (%)
1999 2012
Agric
. Indus. BPW Serv. Infor Total Agr Indus. BPW Servi.. Infor. Total
Without 68,7 30,2 40,0 24,5 24,6 46,7 56,3 18,5 26,6 15,8 10,3 33,1 Koranic and
pre-school 5,7 2,8 6,8 5,6 2,4 5,3 5,0 3,0 5,0 4,4 9 4,5 Fondament
al 23,6 52,8 45,7 40,2 37,7 34,7 34,5 56,2 57,1 43,8 38,1 42,9 High
school 1,5 9,9 5,4 16,1 15,6 7,8 2,6 13,8 8,1 17,8 22,4 10,4 University ,3 4,1 1,9 13,4 18,7 5,3 ,5 7,7 3,0 17,5 23,7 8,3
Other ,0 ,1 ,1 ,1 0,0 ,1 1,1 ,8 ,3 ,6 0,0 8
Not known ,0 ,0 ,0 ,0 1,0 ,0 ,0 ,0 ,0 ,0 4,6 0
Total 100 100 100 100 100 100 100 100 100 100 100 100
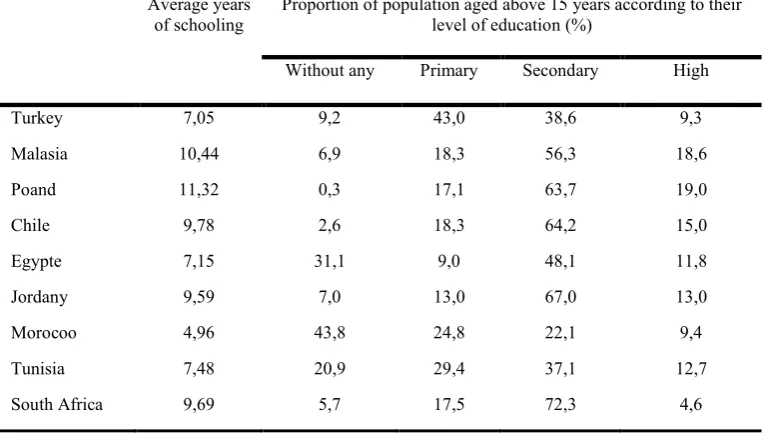
Agri. Agriculture, Indus. Industry, BPW: building and public works, Serv. Services, A comparative perspective provides a strong idea about how low is the quality of labor in Morocco. Indeed, the average number of years of education of each Moroccan is the lowest among a sample of 9 comparable countries (Table 3). This low average number of years of schooling is the consequence of the high proportion of population that has never been educated or was drop out of educational system in the first years of schooling.
MAR
0
100000
200000
300000
40000
0
Ca
pital inyen
sity
1 1.5 2 2.5 3 3.5
Human capital index (Barro/Lee, 2010) t
intensité_k intensité_k Fitted values
13
[image:14.595.107.489.272.489.2]Human capital underutilization is reflected in unemployment indicators. Unemployment rate of educated people is 30% whereas the unemployment rate of the uneducated is 15%. Furthermore, higher education is under-supplied in engineering, sciences, and technology. Only 4% of laureates are trained in these areas in Morocco compared to 15% in emerging countries. The analphabetism rate is high and 8 millions of Moroccans neither read, write nor perform the basic computation operations. Even if the educated persons are recruited, their productivity remains low due to the quality of their education, to the mismatching between their education and the jobs they fulfill, or to the inefficiency of the on the job training necessary to adapt workers competencies to their activities.
Table 3. Education of population
Average years
of schooling Proportion of population aged above 15 years according to their level of education (%)
Without any Primary Secondary High
Turkey 7,05 9,2 43,0 38,6 9,3 Malasia 10,44 6,9 18,3 56,3 18,6 Poand 11,32 0,3 17,1 63,7 19,0 Chile 9,78 2,6 18,3 64,2 15,0 Egypte 7,15 31,1 9,0 48,1 11,8 Jordany 9,59 7,0 13,0 67,0 13,0 Morocoo 4,96 43,8 24,8 22,1 9,4 Tunisia 7,48 20,9 29,4 37,1 12,7 South Africa 9,69 5,7 17,5 72,3 4,6
Morocco has to care about the process of human capital accumulation and its absorption in the economy. This requires partially adequate physical capital. Foreign experience show that one of the paradox is how high capital intensity is in Spain compared to the case of South Korea (data from PWT 8.1). Spain followed a strategy that relied on huge investment in physical capital without commensurate investment to increase human capital. South Korea’s prudent physical capital accumulation cares about it’s matching with available human capital. The lesson for Morocco is the necessity to match the process of physical capital accumulation with the nature and volume of available human capital.
14
work an important part of the labor force. In Morocco, human capital is accumulated for low medium sophisticated activities. Another factor that explains the low use of qualified labor in Morocco is the fact that this labor is relatively expensive. Indeed, the cost of this labor is approximately above the level of its comparators by about 30%.
It’s probable that the low level of capital-labor ratio is in part the result of a lower TFP in Morocco. Empirical evidence shows that there is a positive link between TFP and K/L worldwide (Graph 10).
Graph 9. Physical capital vs TFP
Partially because the low level of human capital stock in Morocco and it’s insufficient absorption, the Moroccan economy is insufficiently spurred by TFP growth compared to other countries. It’s evident that Morocco is performing less in terms of increasing the part of growth due to TFP during the period 1970-2012. If in South Korea and Poland, TFP contributes by almost half to its rate of growth all over the period, this contribution in Morocco is less than one third in the period 2001-2012 and one tenth in the period 1970-1977. During the periods 1978-1990 and 1994-2000 it oscillated between 0.15 and 0.25.
Graph 10. TFP, a comparative perspective (TFP1970=1)
MAR
-1000
00
0
1000
00
200000
300000
400000
Capital intensi
ty K/L
0 .5 1 1.5 2
TFP level at current PPPs (USA=1)
15
5.
Concluding remarksThis paper provides elements about accumulation and efficiency of aggregate capital in Morocco. The results indicate that the Moroccan economy had been characterized, all over the second half of 1970s, by an overinvestment that transformed into underinvestment in the period 1982-2000. This trend reversed in the period 2006-2012 with a resurgence of overinvestment.
The correct evaluation of RRK necessitates to make the necessary/required adjustments and precautions to evaluate the true stock of reproducible capital used to produce output, to estimate the share of output that accrue to this reproducible capital, and to take account of the higher price of capital in developing countries. In Morocco, the rate of return to capital depicted a changing trend over the period 1970-2012. It was stagnant from the beginning of the 1970sup to the beginning of the 1990s. Then began an upward trend that culminated around 2004. After this peak, a declining trend took the way.
In Morocco, accumulation of physical capital is at its early stages. Claiming that capital is lacking because its return is low is incorrect, unwise, and misleading. It’s necessary to explore the reasons behind the low return to capital and remove them. Institutional factors, microeconomic distortions, quality of human capital, and absence of transformative reforms are the main impediments to capital efficiency and consequently its deepening in Morocco.
References
Alfaro, L. and F. Z. Ahmad, (2009), “The Price of Capital: Evidence from Trade Data”, Harvard Business School Working Paper 07-073
Artadi, E. V. and Sala-i-Martin, X., (2003), “The economic tragedy of the XXth century:
growth in Africa”, NBER working paper No. 9865
1
1.5
2
2.5
3
1970 1980 1990 2000 2010 Poland South Korea
Morocco Spain Turkey
16
Bai, C.-E., Hsieh, C.-T., Qian, Y., (2006), “The return to capital in China”, Brookings papers on economic activity, 2 :2006, pp. 61-101
Casselli, F. and Feyrer, J. (2007), “The marginal product of capital”, The QuarterlyJournal of Economics, May 2007, pp. 535-568
Easterly, W. and R. Levine, (2001), “It’s Not Factor Accumulation: Stylized Facts and
Growth Models”, World Bank Economic Review, No. 15, no. 2.
Feenstra, Robert C., R. Inklaar and Marcel P. Timmer, (2015), "The Next Generation of the
Penn World Table" forthcoming American Economic Review, available for download
at www.ggdc.net/pwt
Hsieh, C.-T., and P. J. Klenow. 2007. “Relative Prices and Relative Prosperity” American Economic Review, 97(3): 562–85
Il Houng Lee, I. H., Syed,M., and Xueyan, L., (2012), “Is China Over-Investing and Does it Matter?” IMF Working Paper, WP/12/277
Jun, Z., (2003), “Investment, investment efficiency, and economic growth in China”, Journal of Asian Economics 14, pp. 713-734
Kaldor, N (1961),“Capital Accumulation and Economic Growth,” in F. A. Lutz and D. C. Hague, eds., The Theory of Capital, New York: St. Martins Press
Lucas, R., (1990), “Why doesn’t capital flow from rich to poor countries?” American Economic Review, AEA papers and proceedings, vol. 80, No. 2, pp. 92-96
Qin, D., and Song, H., (2007), “Sources of investment inefficiency: the case of fixed-asset investment in China”, Working paper No. 584, Queen Mary University of London Sala-I-Martin, X., Doppelhofer, G. and R. I. Miller. 2004. "Determinants of Long-Term
Growth: A Bayesian Averaging of Classical Estimates (BACE) Approach." American
Economic Review, 94(4): 813-835.
World Bank (1993), The East Asian Miracle: Economic Growth and Public Policy, New York: Oxford University Press.