Abstract
A sward-based technique for quantifying the spatial hetero- geneity in herbage mass and consumption was developed and tested in a bahia grass (Paspalum notatum Flügge) pasture grazed by cattle. For five, 2-day grazing periods from May to October, pre- and post-grazing herbage masses were nondestruc- tively estimated with an electronic capacitance probe at 182, 50 x50 cm locations along 2 permanent line transects. At the same time, undisturbed herbage accumulation during grazing was measured inside exclosures and the results used to estimate accu- mulation under grazing at each location. Estimation of herbage mass was relatively good; R2= 0.88 to 0.98. Spatial heterogeneity in herbage mass and the stability of the spatial pattern were well quantified. The pattern of spatial heterogeneity observed early in the grazing season remained quite stable for 5 months until the late grazing season. Spatial heterogeneity in the rate of defolia- tion was also well quantified in spite of some negative values. The technique is of potential value for quantifying the spatial hetero- geneity in herbage mass and consumption by animals in grazed pastures, though further studies are necessary for testing the applicability of the technique to pastures of other plant species or of multiple species.
Key Words: electronic capacitance probe, patch grazing, patch stability, rate of defoliation, spatial pattern, Paspalum notatum
Vegetation of grazing systems is spatially heterogeneous (Vallentine 1990). Even in virtually monospecific pastures, vege- tation forms a mosaic in which short, heavily grazed patches hav- ing small herbage mass alternate with tall, ungrazed or lightly grazed patches having large herbage mass, with a transitional zone of intermediate height, utilization and mass (Illius et al.
1987, Liu and Hirata 1995, Hirata and Fukuyama 1997, Cid and Brizuela 1998, Hirata 1998).
It is well known that such heterogeneity is created and main- tained by selective (spatially heterogeneous) grazing by animals:
i.e., animals visit and graze heavily grazed patches more fre- quently than the surrounding patches (Illius et al. 1987), prefer- ring the higher digestibility and nitrogen concentration in heavily grazed patches (Illius et al. 1987, Cid and Brizuela 1998).
However, few workers have measured the utilization of individ- ual patches in terms of herbage consumption or intake. Frequent grazing of heavily grazed patches does not necessarily mean that herbage consumption in these patches is greater than that in other patches, because low herbage availability of heavily grazed patches may limit the intake rate of animals. Since herbage con- sumption, as well as herbage accumulation, is a factor determin- ing the changes in herbage mass, information on the herbage con- sumption in individual patches in a pasture is important in under- standing the mechanisms behind patch development and stability.
Hirata and Fukuyama (1997) developed a sward-based technique for estimating herbage consumption by grazing animals at a small patch scale and used the technique on a bahia grass (P a s p a l u m
n o t a t u m Flügge) pasture grazed by cattle. An electronic capaci-tance probe was used to estimate herbage mass in a number of fixed locations (50
×50 cm) along permanent transects before andafter grazing, and herbage consumption in each location was esti- mated from the change in the herbage mass with g r a z i n g .
J. Range Manage.53: 315–321 May 2000
Quantifying spatial heterogeneity in herbage mass and consumption in pastures
MASAHIKO HIRATA
Author is associate professor, Grassland and Animal Production Division, Faculty of Agriculture, Miyazaki University, Miyazaki 889-2192, Japan. E-mail:
The author is grateful to Mr. Takuya Iwamoto, Mr. Waka Otozu and Mr.
Daisuke Kiyota for field assistance, and to Mr. Kiichi Fukuyama and Mr. Shirou Kuroki of the Sumiyoshi Livestock Farm for pasture and animal management.
Manuscript accepted 6 Sept. 1999.
Resumen
Se desarrollo una técnica basada en la pradera para cuan- tificar la heterogeneidad espacial de la masa de forraje y el con- sumo, y se probo en una pradera de "Bahia grass"(P a s p a l u m n o t a t u m Flügge) apacentada por bovinos. En 5 periodos de apacentamiento de 2 días comprendidos entre mayo y octubre, se estimo la masa de forraje antes y después del apacentamiento mediante el método no destructivo de la sonda de capacitor elec- trónico, la estimación se realizó en 182 cuadrantes de 50 x 50 cm localizados en 2 transectos de línea permanentes. Al mismo tiem- po se midió la acumulación de forraje sin disturbio ocurrida durante el apacentamiento, lo cual se hizo dentro de exclusiones y los resultados se utilizaron para estimar la acumulación de for- raje bajo apacentamiento en cada localidad. La estimación de forraje fue relativamente buena; R2 = 0.88 a 0.98. La hetero- geneidad espacial de la masa de forraje y la estabilidad del patrón espacial se cuantificaron bien. El patrón de la hetero- geneidad espacial observado al inicio de la estación de apacen- tamiento permaneció muy estable durante 5 meses hasta finales de la estación de apacentamiento. La heterogeneidad espacial de la tasa de defoliación también fue bien cuantificada a pesar de algunos valores negativos. La técnica es de valor potencial para cuantificar la heterogeneidad espacial de la masa de forraje y consumo por animales en praderas apacentadas, aunque son necesarios mas estudios para probar la aplicabilidad de esta téc- nica en praderas de otra especies vegetales o praderas con mas de una especie.
However, the results had limitations because the herbage consumption was estimated without taking the herbage accumulation during grazing into account.
The aims of the present study were to overcome such limitations and examine the usefulness of the technique for quanti- fying the spatial heterogeneity in herbage mass and consumption in a grazed pasture.
Materials and Methods
Study site and grazing and pasture management
The same paddock as in the previous study (Hirata and Fukuyama 1997), i.e., a 1.1-ha paddock of a bahia grass pasture at the Sumiyoshi Livestock Farm (31°59'N, 131°28'E), Faculty of Agriculture, Miyazaki University, Japan, was used.
The paddock was 1 of 5 paddocks rota- tionally grazed by Japanese Black Cows.
The vegetation was highly dominated by bahia grass. According to the measure- ments in the previous year (1995), bahia grass accounted for 87% of herbage mass (above a 3 cm height; on a dry matter (DM) basis) in May, and 97 to 100% from June to October (Hirata and Fukuyama 1997).
During the grazing season (May- October) of 1996, the paddock was grazed by 28 to 32 animals with a 2 to 6-day duration at intervals of 11 to 37 days. The total duration of grazing periods was 23 days. The annual fertilization rates in the paddock were 77 kg N (split application in
March and August), 20 kg P (March) and 30 kg K (March) ha
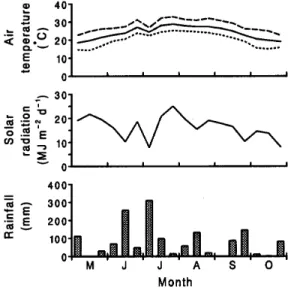
-1. The meteorological conditions during the study are shown in Fig. 1.
Measurement periods
Five, 2-day periods at approximately monthly intervals were selected from the rotational grazing periods as Periods 1 to 5 (Table 1), representing the first 2 days of a grazing period. Pre- and post-grazing herbage mass, herbage accumulation and rate of defoliation were estimated for these 5 selected periods. The duration of 2 days was selected to ensure enough reduction in herbage mass by grazing for detection with a capacitance probe.
Electronic capacitance probe An electronic capacitance probe ( P a s t u r e P r o b e
T M, Mosaic Systems Ltd., N e w Z e a l a n d ) w a s u s e d t o e s t i m a t e herbage mass. PastureProbe
TMis a single probe capacitance meter, which is light in weight and highly portable (Hirata et al.
1993). There have been many reports eval- uating electronic capacitance probes, and results indicate that the single-probe capacitance meter is at least as good and more labor saving than any other alterna- tives for indirect herbage mass measure- ment (Frame 1993). The accuracy of PastureProbe
TMin estimating herbage mass of bahia grass swards was tested by Hirata et al. (1993). Because the relationship between herbage mass and corrected meter reading of electronic capacitance probe
(CMR) is known to vary with such factors as sward type, season of growth (develop- mental stage), herbage moisture content and ratio of green to dead material (Frame 1993, Hirata et al. 1993), and was antici- pated to vary also with grazing, calibration equations were developed separately for individual measurement occasions as described later.
Pre- and post-grazing herbage mass Horizontal distribution of herbage mass was measured both at the beginning and the end of the 5 selected periods, i.e., on 10 occasions. On each occasion, CMR was measured at 1-m intervals along 2 permanent line transects crossing the pad- dock. Each transect was 90 m long and, therefore, the CMR was determined at 182 locations (including both ends of the tran- sect). For each location, the CMR was mea- sured at 6 points within an area of 50
×5 0 cm (4 at individual corners and 2 in the center), irrespective of the vegetation of the points (plant species and plant parts), and the mean value was recorded as the CMR of the location. The area of 50x 50 cm was selected based on the feeding station (Coleman et al. 1989) of cattle used.
Immediately after the measurements of CMR along the transects, ten, 50
x 50 cmlocations whose CMR values covered the CMR range of the transects were selected in the paddock, avoiding the proximity of the transects, and the herbage was cut to a 3-cm height. The samples were oven-dried at 85°C for 72 hours for dry matter deter- mination. In Period 5, the number of sam- ples was decreased to 5 to reduce labor requirement.
Calibration equations for estimating herbage mass (M, g DM (2500 cm
2)
- 1) from CMR were developed fitting the fol- lowing model to data:
M = a
0+ a
1×CMR + a2×CMR2(1)
where a
0, a
1and a
2are constants. The independent variables, CMR and CMR
2, were incorporated into the equation only when their partial regression coefficients ( a
1and a
2, respectively) were significant (P
Fig. 1. Ten or 11 day average of maximum (- - - - -), mean ( – – – – –), and minimum ( . . . . .)air temperatures, daily total shortwave solar radiation, and 10 or 11 day totals of rainfall during the study period.
Table 1. Outlines of selected grazing periods for measurements.
Period Date Number of Mean cows liveweight
(kg cow-1)
1 25-26 May 28 462
2 29-30 Jun. 28 454
3 3-4 Aug. 28 446
4 14-15 Sep. 29 452
5 26-27 Oct. 32 468
<0.05). Using the equation developed for each measurement occasion, the CMR at each location along the transects was con- verted into herbage mass (DM in an area of 5 0
x 50 cm and above a height of 3 cm).Characteristics of the spatial distribution of herbage mass were expressed by the mean, minimum, maximum, SD and C.V.
of data from the 182 locations along the transects. Similarity of the spatial patterns of herbage mass on 2 occasions was repre- sented by a correlation coefficient (n=182).
Herbage accumulation
Undisturbed herbage accumulation dur- ing each selected period was measured at 6 different herbage masses using exclosure cages (1
×1 m i n a r e a a n d 7 5 c m i n height), to develop the relationship between the accumulation rate and herbage mass (described later as Equation 2, also see Fig. 6 and Equations 4 to 8). At the beginning of each selected period, six, 50
×50 cm areas whose CMR values cov- ered the CMR range of the transects at approximately equal intervals were select- ed in the paddock, avoiding the proximity of the transects, and the cages were placed on these areas. Then, the CMR of the areas was measured again 7 to 10 days after the end of the selected period.
Initially, I intended to measure the final CMR at the end of the selected periods, but herbage accumulation during the 2 days was too small to detect with the capacitance probe. The initial and final CMR of each area was determined as the mean of 5 measurements (4 at individual corners and 1 in the center), and converted into herbage mass (DM in an area of 50
×50 cm and above a height of 3 cm) as described above.
The rate of undisturbed herbage accu- mulation (G
u n d i s t, g DM (2500 cm
2)
- 1d
- 1) was related to the mean herbage mass dur- ing the accumulation period (M
mean, g DM (2500 cm
2)
- 1) assuming the following model:
G
undist= b
0+b
1×Mmean+b
2×Mmean2 (2)where b
0, b
1and b
2are constants. The independent variables, M
meanand M
mean2, were selected in the same way as in Equation 1.
Rate of defoliation
Rate of defoliation or daily herbage con- sumption (D, g DM (2500 cm
2)
- 1d
- 1) at each location along the transects was cal- culated as:
D = (M
pre- M
post)/t
g+ G
dist (3)where M
preand M
postare respectively the
pre- and post-grazing herbage masses at the location (g DM (2500 cm
2)
-1), t
gis the duration of the selected grazing period (d), and G
d i s tis the rate of disturbed herbage accumulation at the location during graz- ing (g DM (2500 cm
2)
- 1d
- 1). The first term, (M
p r e- M
p o s t) / t
g, corresponds to the rate of decrease in herbage mass during grazing (apparent consumption). In this study, t
g= 2 (Table 1). G
distwas estimated from the mean herbage mass during the selected grazing period (M
mean= (M
pre+
M
p o s t)/2) using Equation 2. Thus, the use of the model assumes that G
dist, the rate of herbage accumulation under grazing, equals the rate of undisturbed herbage accumulation when the herbage mass is the same.
Characteristics of the spatial distribution of the rate of defoliation were expressed by the mean, minimum, maximum, SD and C.V. of data from the 182 locations along the transects.
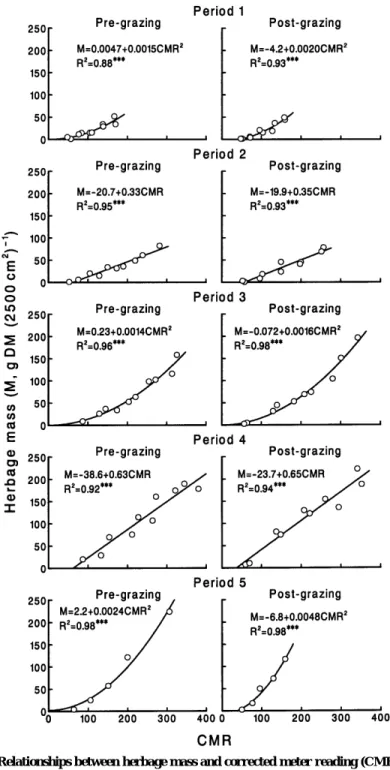
Fig. 2. Relationships between herbage mass and corrected meter reading (CMR) by an elec- tronic capacitance probe. Three asterisks indicate significance at P < 0.001.
Results and Discussion
Labor requirement
The present technique required a rela- tively small amount of labor. An operator of a capacitance probe and a recorder who also calculated the mean corrected meter reading (CMR) at each location were enough for the measurements. It took approximately 2.5 hours for 2 persons to measure CMR at the 182 locations and in the 6 exclosures and collect 10 vegetation samples for developing a calibration equa- tion. Reducing the number of samples to 5 in Period 5 shortened the time by approxi- mately half an hour.
Estimation of herbage mass
Herbage mass was linearly or quadrati-
cally related to CMR (Fig. 2). The linear and quadratic terms were not incorporated at the same time because their partial regression coefficients were not simultane- ously significant (P>0.05). All the calibra- tion equations were highly significant (R
2= 0.88 to 0.98, P<0.001) with SE of estima- tion of 4.4 to 16.8 g DM (2500 cm
2)
- 1. The SE tended to be greater as the range of herbage mass broadened. Replacing the lin- ear term by the quadratic term in Periods 1, 3, and 5 increased R
2by 0.00 to 0.06 and decreased SE of estimation by 0.3 to 7.3 g DM (2500 cm
2)
- 1. These results are similar to those from the previous study (Hirata et al. 1993). The slope of the line was always steeper, i.e., the regression coefficient was always greater, after grazing than before grazing. This may be mainly due to the decreased leaf to stem ratio of the sward with grazing.
Heterogeneity in herbage mass Pre- and post-grazing herbage masses were spatially heterogeneous, as shown by the C.V. values of 0.304 to 0.857 (Fig. 3).
With grazing, the mean and minimum herbage masses always decreased and, contrarily, C.V. always increased. Such an increase in C.V. with grazing accords with previous observations (Shiyomi et al.
1983, 1984, Hirata 1993a, 1993b, Liu and Hirata 1995, Hirata and Fukuyama 1997) and confirms that grazing by animals is a crucial factor in the development and maintenance of the heterogeneity (Bakker et al. 1983, Edwards et al. 1996).
There were always positive correlations between pre- and post-grazing herbage masses along the transects (Fig. 4).
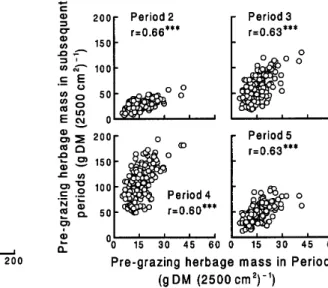
Furthermore, pre-grazing herbage mass in Periods 2 to 5 was always positively corre-
Fig. 3. Pre- and post-grazing distributions of herbage mass along the transects. The statistical parameters are minimum, maximum, mean,SD, and C.V.
lated with that in Period 1 (Fig. 5). These results show that the spatial pattern of herbage mass was more or less stable at least for 5 months during the grazing sea- son, which agrees with previous reports (Bakker et al. 1983, Willms et al. 1988, Cid and Brizuela 1998, Hirata 1998). The stability of the spatial pattern of herbage mass in the paddock during a 2 and a half- year period has been investigated and dis- cussed in Hirata (1998).
Herbage accumulation during grazing
The rate of undisturbed herbage accu- mulation (G
undist) was linearly or quadrati - cally related to the mean herbage mass
during the accumulation period (M
m e a n) (Fig. 6). The relationships in Periods 1, 2, 3, 4, and 5 were expressed by Equations 4, 5, 6, 7, and 8, respectively (SE given in brackets):
The relationship between G
u n d i s ta n d
M
m e a nwas mostly quadratic, with the
maximal G
u n d i s tand the optimum M
m e a nfor the maximal G
undistchanging with sea- son. This relationship was linear in
Periods 1 and 2, apparently caused by the low, narrow ranges of M
mean. The quadrat- ic relationship between growth rate and herbage mass which produces the logistic growth agrees with models developed by Noy-Meir (1978) and Hart (1989).
Heterogeneity in herbage consump- tion
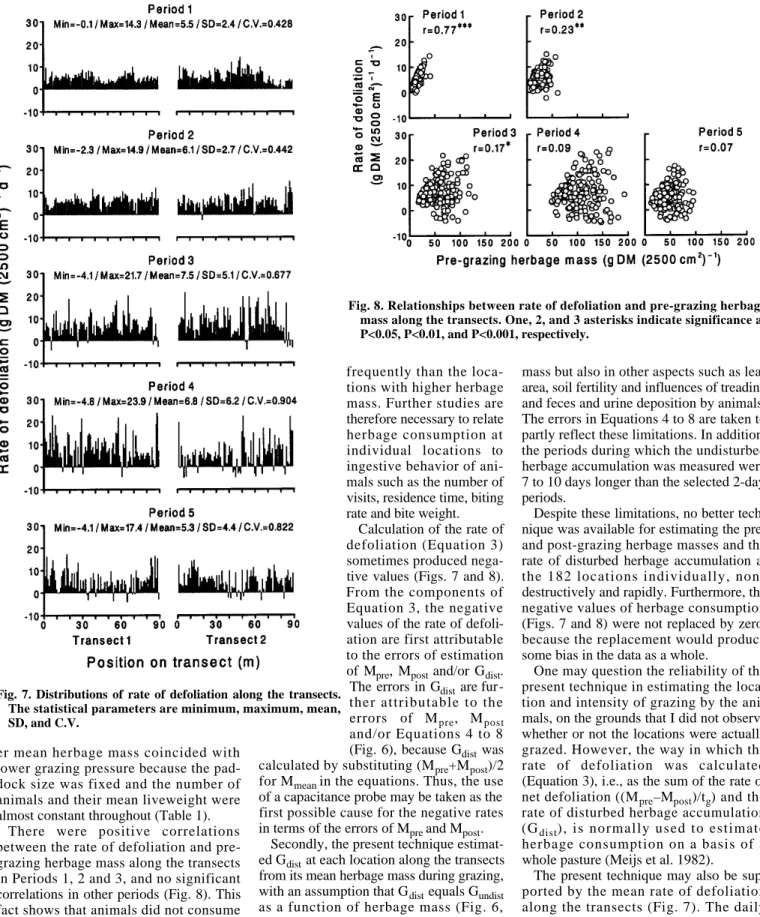
The rate of defoliation was spatially het- erogeneous, as shown by the C.V. values of 0.428 to 0.904 (Fig. 7). The heterogene- ity (C.V.) tended to increase as the mean pre-grazing herbage mass increased (Fig.
3) (r=0.87, P
≈0.05). This phenomenonreflects the fact that animals are more selective and patch grazing is more preva- lent under lower grazing pressure (Willms et al. 1988, Vallentine 1990, Cid and Brizuela 1998). In the present study, high- G
undist= 0.117 (0.055) + 0.0203 (0.0022) M
mean(R
2= 0.96, P<0.001, SE of estimation = 0.079) (4) G
undist= 0.575 (0.452) + 0.0299 (0.0092) M
mean(R
2= 0.73, P<0.05, SE of estimation = 0.493) (5) G
undist= –0.253 (0.450) + 0.0534 (0.0104) M
mean– 2.61
×10-4(0.50x10
-4) M
mean2(R
2= 0.90, P<0.05, SE of estimation = 0.272) (6) G
undist= 0.307 (0.150) + 0.0207 (0.0026) M
mean– 1.11×10
-4(0.10x10
-4) M
mean2(R
2= 0.99, P<0.001, SE of estimation = 0.041) (7) G
undist= 0.0029 (0.0036) + 0.00149 (0.00011) M
mean– 7.65×10
-6(0.66x10
-6) M
mean2(R
2= 0.99, P<0.01, SE of estimation = 0.003) (8)
Fig. 4. Relationships between pre- and post-grazing herbage masses alongthe transects. Three asterisks indicate significance at P<0.001. Fig. 5. Relationships between pre-grazing herbage masses along the transects in Period 1 and subsequent periods. Three asterisks indicate significance at P<0.001.
Fig. 6. Relationships between rate of undisturbed herbage accumulation and mean herbage mass in Periods 1 (❍), 2 ( , 3 ( , 4(❑), and 5( ). See text for equations.
er mean herbage mass coincided with lower grazing pressure because the pad- dock size was fixed and the number of animals and their mean liveweight were almost constant throughout (Table 1).
There were positive correlations between the rate of defoliation and pre- grazing herbage mass along the transects in Periods 1, 2 and 3, and no significant correlations in other periods (Fig. 8). This fact shows that animals did not consume more from the locations with lower herbage mass. Because the current study did not measure ingestive behavior of animals, it is unknown whether the animals visited the locations with lower herbage mass more
frequently than the loca- tions with higher herbage mass. Further studies are therefore necessary to relate herbage consumption at individual locations to ingestive behavior of ani- mals such as the number of visits, residence time, biting rate and bite weight.
Calculation of the rate of defoliation (Equation 3) sometimes produced nega- tive values (Figs. 7 and 8).
From the components of Equation 3, the negative values of the rate of defoli- ation are first attributable to the errors of estimation of M
pre, M
postand/or G
dist. The errors in G
distare fur- ther attributable to the errors of M
p r e, M
p o s tand/or Equations 4 to 8 (Fig. 6), because G
distwas calculated by substituting (M
p r e+ M
p o s t) / 2 for M
m e a nin the equations. Thus, the use of a capacitance probe may be taken as the first possible cause for the negative rates in terms of the errors of M
preand M
post.
Secondly, the present technique estimat- ed G
d i s tat each location along the transects from its mean herbage mass during grazing, with an assumption that G
d i s tequals G
u n d i s tas a function of herbage mass (Fig. 6, Equations 4 to 8). Therefore the technique has limitations in estimating disturbed or grazed herbage accumulation separately in different locations in a pasture, because the locations may differ not only in herbage
mass but also in other aspects such as leaf area, soil fertility and influences of treading and feces and urine deposition by animals.
The errors in Equations 4 to 8 are taken to partly reflect these limitations. In addition, the periods during which the undisturbed herbage accumulation was measured were 7 to 10 days longer than the selected 2-day p e r i o d s .
Despite these limitations, no better tech- nique was available for estimating the pre- and post-grazing herbage masses and the rate of disturbed herbage accumulation at the 182 locations individually, non- destructively and rapidly. Furthermore, the negative values of herbage consumption (Figs. 7 and 8) were not replaced by zero, because the replacement would produce some bias in the data as a whole.
One may question the reliability of the present technique in estimating the loca- tion and intensity of grazing by the ani- mals, on the grounds that I did not observe whether or not the locations were actually grazed. However, the way in which the rate of defoliation was calculated (Equation 3), i.e., as the sum of the rate of net defoliation ((M
p r e– M
p o s t) / t
g) and the rate of disturbed herbage accumulation ( G
d i s t), is normally used to estimate herbage consumption on a basis of a whole pasture (Meijs et al. 1982).
The present technique may also be sup- ported by the mean rate of defoliation along the transects (Fig. 7). The daily herbage intake by the animals that was calculated from the mean rate of defolia- tion, the paddock area, and the number and mean liveweight of animals (Table 1) was 18.0, 20.4, 25.4, 22.0, and 14.9 g DM
Fig. 8. Relationships between rate of defoliation and pre-grazing herbage mass along the transects. One, 2, and 3 asterisks indicate significance at P<0.05, P<0.01, and P<0.001, respectively.Fig. 7. Distributions of rate of defoliation along the transects.
The statistical parameters are minimum, maximum, mean, SD, and C.V.
(kg LW)
-1d
-1for Periods 1, 2, 3, 4, and 5, respectively. These values agree closely with the grazing intake of Japanese Black Cows (AFFRCS 1995) when the mean pre-grazing herbage mass (Fig. 3) and the digestibility of a bahia grass pasture (Higashiyama and Hirata 1995) are taken into account.
Furthermore, the present technique, owing to the large number of data sets from the pasture (n=182), is considered to give reliable trends of spatial distribution of herbage consumption. An example is the increase in the spatial heterogeneity in herbage consumption with the increased mean pre-grazing herbage mass (Figs. 3 and 7) as discussed above. We can under- stand which locations of the pasture were heavily defoliated or lightly defoliated.
Because of the small labor requirement, it may be possible to establish more loca- tions for measurements so that they can cover the whole area of a pasture.
Conclusions
Previous studies have mainly used 2 techniques for quantifying the spatial het- erogeneity in vegetation in grazed pas- tures. One is a random sampling of sward height (Gibb and Ridout 1986,1988) or herbage mass (Shiyomi et al.1983,1984, Hirata 1993a) from a pasture, and the other is a monitoring of degree of utiliza- tion (Bakker et al. 1983, Willms et al.
1988, Cid and Brizuela 1998) or sward height (Edwards et al. 1996) in some per- manent areas in a pasture. The latter tech- nique is advantageous over the former because it can follow the temporal dynam- ics in vegetation characteristics in the same locations in a pasture and therefore can estimate the patch stability. However, few workers have used the latter technique to monitor herbage mass, i.e., a most important vegetation characteristic, because estimation of herbage mass nor- mally requires destructive sampling.
The present technique, by using an elec- tronic capacitance probe, can follow the temporal dynamics in herbage mass in a number of fixed locations in a pasture with a relatively small amount of labor. Spatial heterogeneity in herbage mass and the sta- bility of the spatial pattern of herbage mass were well quantified (Figs. 3 to 5).
Spatial heterogeneity in the rate of defolia- tion was also well quantified in spite of some negative values (Fig. 7). The present technique is therefore considered to be of potential value for quantifying the spatial heterogeneity in herbage mass and con-
sumption by animals in grazed pastures, though further studies are necessary for testing the applicability of the technique to pastures of other plant species or of multi- ple species.
Literature Cited
[AFFRCS] Agriculture, Forestry and Fisheries Research Council Secretariat.
1995. Japanese feeding standard for beef cat- tle (1995). Central Association of Livestock Industry, Tokyo, Japan.
Bakker, J.P., J. de Leeuw, and S.E. van Wieren. 1983. Micro-patterns in grassland vegetation created and sustained by sheep grazing. Vegetatio 55:153–161.
Cid, M.S. and M.A. Brizuela. 1998.
Heterogeneity in tall fescue pastures created and sustained by cattle grazing. J. Range Manage. 51:644–649.
Coleman, S.W., T.D.A. Forbes, and J.W.
Stuth 1989. Measurements of the plant-ani- mal interface in grazing research. p. 37–51.
I n: G.C. Marten (ed.), Grazing research:
design, methodology, and analysis. Crop Sci.
Soc. of Amer. and Amer. Soc. of Agron., Madison, Wis.
Edwards, G.R., A.J. Parsons, J.A. Newman, and I.A. Wright. 1996. The spatial pattern of vegetation in cut and grazed grass/white clover pastures. Grass Forage Sci.
51:219–231.
Frame, J. 1993. Herbage mass. p. 39–67. I n:
A. Davies, R.D. Baker, S.A. Grant, and A.S.
Laidlaw (eds.), Sward measurement hand- book (2nd ed.). Brit. Grassl. Soc., Reading, UK.
Gibb, M.J. and M.S. Ridout. 1986. The fitting of frequency distributions to height measure- ments on grazed swards. Grass Forage Sci.
41:247–249.
Gibb, M.J. and M.S. Ridout. 1988.
Application of double normal frequency dis- tributions fitted to measurements of sward height. Grass Forage Sci. 43:131–136.
Hart, R.H. 1989. SMART: A simple model to assess range technology. J. Range Manage.
42:421–424.
Higashiyama, M. and M. Hirata. 1995.
Analysis of a Japanese Black Cattle rearing system utilizing a bahiagrass ( P a s p a l u m notatum Flügge) pasture. 1. Variations in the factors considered to affect animal produc- tion. Grassl. Sci. 41:104–113.
Hirata, M. 1993a. Changes in the variations in herbage mass of bahiagrass (Paspalum nota - t u m Flügge) pasture with the grazing by dairy heifers. Bull. Fac. Agr., Miyazaki Univ.
40:1–5.
Hirata, M. 1993b. Distribution of herbage mass in bahiagrass ( Paspalum notatum Flügge) pasture as affected by grazing by beef cattle, mowing, paddock area and sea- son. Bull. Fac. Agr., Miyazaki Univ.
40:91–98.
Hirata, M. 1998. Dynamics of the horizontal distribution of herbage mass in a bahiagrass
(Paspalum notatum Flügge) pasture grazed by cattle: Stability of spatial pattern of herbage mass. Grassl. Sci. 44:169–172.
Hirata, M. and K. Fukuyama. 1997.
Dynamics of the horizontal distribution of herbage mass in a bahiagrass ( P a s p a l u m notatum Flügge) pasture with grazing by cat- tle. Grassl. Sci. 43:1–6.
Hirata, M., M. Higashiyama, M. Kikuchi, and S. Liu. 1993. Estimation of herbage mass of bahiagrass ( Paspalum notatum Flügge) swards with an electronic capaci- tance meter. Bull. Fac. Agr., Miyazaki Univ.
40:83–89.
Illius, A.W., D.G.M. Wood-Gush, and J.C.
Eddison. 1987. A study of the foraging behaviour of cattle grazing patchy swards.
Biol. Behav. 12:33–44.
Liu, S. and M. Hirata. 1995. Spatial distribu- tion of herbage mass in bahiagrass (Paspalum notatum Flügge) pasture under grazing, resting and mowing. J. Japan.
Grassl. Sci. 40:457–470.
Meijs, J.A.C., R.J.K. Walters, and A. Keen.
1 9 8 2 . Sward methods. p. 11-36. I n: J.D.
Leaver (ed.), Herbage intake handbook. Brit.
Grassl. Soc., Maidenhead, UK.
Noy-Meir, I. 1978. Grazing and production in seasonal pastures: Analysis of a simple model. J. Applied Ecol. 15:809–835.
Shiyomi, M., T. Akiyama, and S. Takahashi.
1 9 8 3 . A spatial pattern model of plant bio- mass in grazing pasture I. J. Japan. Grassl.
Sci. 28:373–382.
Shiyomi, M., T. Akiyama, and S. Takahashi.
1 9 8 4 . A spatial pattern model of plant bio- mass in grazing pasture II. J. Japan. Grassl.
Sci. 30:40–48.
Vallentine, J.F. 1990. Grazing management.
Academic Press, San Diego, Calif.
Willms, W.D., J.F. Dormaar, and G.B.
Schaalje. 1988. Stability of grazed patches on rough fescue grasslands. J. Range Manage. 41:503–508.