http://wrap.warwick.ac.uk
Original citation:Love, James H., Roper, Stephen and Vahter, Priit. (2013) Learning from openness : the dynamics of breadth in external innovation linkages. Strategic Management Journal . ISSN 0143-2095
Permanent WRAP url:
http://wrap.warwick.ac.uk/57425
Copyright and reuse:
The Warwick Research Archive Portal (WRAP) makes this work of researchers of the University of Warwick available open access under the following conditions.
This article is made available under the Creative Commons Attribution 3.0 (CC BY 3.0) license and may be reused according to the conditions of the license. For more details see: http://creativecommons.org/licenses/by/3.0/
A note on versions:
The version presented in WRAP is the published version, or, version of record, and may be cited as it appears here.
Strat. Mgmt. J.(2013) Published online EarlyView in Wiley Online Library (wileyonlinelibrary.com) DOI: 10.1002/smj.2170
Received 13 July 2011;Final revision received 20 June 2013
RESEARCH NOTES AND COMMENTARIES
LEARNING FROM OPENNESS: THE DYNAMICS
OF BREADTH IN EXTERNAL INNOVATION LINKAGES
JAMES H. LOVE,1* STEPHEN ROPER,2and PRIIT VAHTER3
1Enterprise Research Centre and Aston Business School, Aston University, Birmingham, U.K.
2Enterprise Research Centre and Warwick Business School, University of Warwick, Coventry, U.K.
3Faculty of Economics and Business Administration, University of Tartu, Tartu, Estonia
We explore how openness in terms of external linkages generates learning effects, which enable firms to generate more innovation outputs from any given breadth of external linkages. Openness to external knowledge sources, whether through search activity or linkages to external partners in new product development, involves a process of interaction and information processing. Such activities are likely to be subject to a learning process, as firms learn which knowledge sources and collaborative linkages are most useful to their particular needs, and which partnerships are most effective in delivering innovation performance. Using panel data from Irish manufacturing plants, we find evidence of such learning effects: establishments with substantial experience of external collaborations in previous periods derive more innovation output from openness in the current period. 2013 The Authors.Strategic Management Journal published by John Wiley & Sons Ltd.
INTRODUCTION
Do firms learn from openness in their innovation activity? It has long been recognized that inno-vation cannot be regarded purely as an internal matter: firms’ external linkages or networks may also play a potentially important role (e.g., von Hippel, 1988; Powell, Koput, and Smith-Doerr, 1996; Rothwell et al., 1974). There is also now a considerable body of literature that supports the
Keywords: innovation linkages; learning effects; open innovation; openness; Ireland
*Correspondence to: James H. Love, Enterprise Research Centre and Aston Business School, Aston University, Birmingham B4 7ET, U.K. E-mail: [email protected]
2013 The Authors.Strategic Management Journal published by John Wiley & Sons Ltd.
This is an open access article under the terms of the Creative Commons Attribution License, which permits use, distribution and reproduction in any medium, provided the original work is properly cited.
processing in identifying and selecting appropriate partners, developing routines to interact with them, and constructing management systems to manage the relationships. Such activities are likely to be subject to a learning process, as firms dis-cover through time which knowledge sources and linkages are most useful to their particular needs, which partnerships are most effective in delivering innovation performance, and how best to manage them. In evolutionary terms, this could be seen as the development of improved innovation routines (Nelson and Winter, 1982) or, from a resource-based perspective, the development of new or improved dynamic capabilities in external part-nering (Kale and Singh, 2007; Zollo and Winter, 2002). We therefore anticipate that the contribu-tion of openness to innovacontribu-tion in any period will be influenced by the lessons learned from firms’ previous experience of external partnering.
Our contribution is to provide an analysis of the benefits of breadth in external innovation linkages with a particular focus on learning effects. More specifically, we examine how previous “open-ness” affects the impact which current levels of openness have on innovation performance. We base our analysis on an unbalanced panel of Irish manufacturing plants that covers five successive three-year periods spanning the years 1994–2008. We find evidence that establishments that had experience of external collaborations in previous periods do indeed derive more innovation output from openness in the current period, and conclude that this is evidence of learning effects.
CONCEPTUAL FRAMEWORK:
LEARNING EFFECTS IN INNOVATION COLLABORATION
Because innovation, and the returns to it, are inherently uncertain, firms have an incentive to develop a number of external linkages simultane-ously. In purely statistical terms, since the payoff from any given innovation linkage is unknown in advance, the chance of obtaining benefit from any linkage in a given distribution of payoffs increases as the number of linkages increases. In simple terms, having more linkages increases the probability of obtaining useful external knowledge that can be combined with the firm’s internal knowledge to produce innovation (Leiponen and Helfat, 2010). In addition, empirical evidence
suggests that knowledge gained from different types of linkages generates complementarities both between external linkages and with firms’ internal R&D (Roper, Du, and Love, 2008). Having a number of external linkages of different types therefore increases the likelihood of innovation not only by directly increasing the flow of useful external knowledge, but also by increasing the chances of productive complementarities between external and internal knowledge.
However, there are limits to the value of external linkages for innovation. Search is costly, as is the need to write appropriate contractual agreements for numerous formal linkages, and to maintain these linkages through time. Even where formal contractual issues do not arise, there may be other issues that limit the ability of a firm to pursue large numbers of linkages. These arise from the capacity of management to pay attention to and cognitively process many sources of information, since the span of attention of any individual is limited (Simon, 1947). This attention issue means that, while the returns to additional linkages may at first be positive, eventually the firm will reach a point at which an additional linkage actually serves to diminish the innovation returns to exter-nal networking. In their aexter-nalysis of the breadth of external information sources used by UK manufac-turing firms, Laursen and Salter (2006) find that, while the breadth of information sources enhances innovation, beyond some limit the returns to increased breadth of search become negative. A similar result is found for Finnish manufacturing firms by Leiponen and Helfat (2010).
and how to function within a context of multiple cooperative ventures” (Powell et al., 1996: 121). The experience gained from collaboration in one field of activity can be used to develop capabilities in collaboration that can be used with other part-ners, and with a more diverse set of partners. So, firms develop capabilities for interacting with other firms, and learn to do this better through time. Using data from the US biotechnology industry over the period 1990–1994, Powell et al. (1996) find support for the hypotheses that experience in collaborations leads to more, and more diverse, forms of collaboration. This provides an important link between learning from external innovation linkages (which can help boost innovation) and learning to use these linkages more effectively over time (which boosts innovation in the future). This process of organizational learning in man-aging complex tasks, especially those which occur repeatedly, can not only help improve managers’ skills in performing such tasks more effectively through time, but may also develop into a dynamic capability in its own right (Zollo and Winter, 2002). Precisely such a process is described by Kale and Singh (2007) in their work on building firm capabilities through learning in the case of interfirm alliances. They examine the “alliance learning process,” defined as “. . . a process that is directed towards helping a firm (and its managers) learn, accumulate, and leverage alliance manage-ment know-how and best practices” (Kale and Singh, 2007: 984). They demonstrate empirically that firms with a stronger alliance learning process have greater alliance success.
In the specific case of breadth of external link-ages in the innovation process, learning oppor-tunities present themselves in two ways: first, in
selectingappropriate partners and, second, in man-aging external relationships.
In terms of selecting appropriate partners, managers may become better at identifying in which external relationships it is worth investing. Since search strategies are to some extent based on previous experience (Laursen and Salter, 2006; Levinthal and March, 1993), it takes time to determine which external linkages are more likely to lead to the most positive payoffs. Through time, therefore, firms may experience larger payoffs from innovation linkages than was the case in the previous period. This is because managers become better at recognizing and selecting productive
linkages ex ante because they have learned from previous experience.
Managing external linkages can also be a source of learning. This may occur in two ways: the first arises from the development of organizational routines; the second arises from developments in managerial cognition through time.
As enterprises develop mechanisms and routines for managing innovation relationships with exter-nal parties, they learn to manage their existing external relationships more efficiently, and there-fore obtain higher returns from a given breadth of linkages in subsequent periods. More generally, similar in-house teams might liaise with different types of innovation partners, becoming more effec-tive through time and thus lowering the cost and/or increasing the return from a given breadth of rela-tionships. Precisely such a possibility is suggested by the literature on complementarities between dif-ferent knowledge sources, where strong positive associations and payoffs are found between the use of internal and external knowledge sources (Cassiman and Veugelers, 2006) and in the use of different external sources (Roperet al., 2008). While this is implicitly a static concept, there is the possibility of dynamic effects here as manage-ment teams learn from the process of managing multiple relationships in one period, and are able to apply that learning to manage more efficiently relationships in subsequent periods.
more of their limited attention to the most pro-ductive relationships, through time they also learn to manage a wider range of external relationships before encountering the cognitive limit at which the innovation returns to an additional relationship becomes negative. Organizations therefore benefit from extending the range of their external knowl-edge sourcing activities, pushing back the “lim-its to openness” identified in Laursen and Salter (2006). By implication, this is the mechanism envisaged by Powell et al. (1996) in their sug-gestion that collaborations lead both to more, and more diverse, forms of collaboration. Thus, not only do managers learn to manage existing linkage breadth more efficiently (through the development of routines), they also learn to cope effectively with greater breadth of linkages through time (through improvements in managerial cognition).
The experientially based learning mechanisms outlined above may occur at the level of the individual plant, the firm, or both. Organizational learning involves both creating knowledge and also transferring knowledge within the organi-zation (Argote and Miron-Spektor, 2011). There is therefore also the possibility that learning on external partner selection and management may occur through knowledge transfer between plants within a multiplant firm. Such transfers are likely to be easier where management knowledge can be codified—as in the case of partner search or management routines—but more difficult where knowledge is tacit, as in managerial cognition. Recent research on multinational enterprises sug-gests that two-way flows of innovation-relevant knowledge between parent companies and their foreign subsidiaries is relatively commonplace (Driffield, Love, and Menghinello, 2010; Singh, 2007). This, in turn, suggests that such firms may be in a position to actively transfer knowledge related to the search, selection, and management of external partners between plants, and that the learning effects arising from this knowledge can be analyzed at the individual plant level. There may also be practical advantages in considering organi-zational learning at this level. Although strategic decisions may be made at the firm level, they are implemented at the level of the individual plant, and are likely to be based on the product market situation faced by individual plants. This is espe-cially true of large multiplant enterprises. Thus, a firm may use one set of external linkages at one plant and a quite different set at another that is
facing a different set of market circumstances, a subtlety that may be missed in firm-level analysis. The joint effect of the mechanisms discussed above suggests there may be learning effects arising from managing external innovation linkages, such that the benefits of linkages will be greater among establishments with relevant previ-ous experience. This leads to our key hypothesis:
Establishments with previous innovation link-ages experience higher innovation returns to their current linkage breadth than other establishments.
DATA AND METHODS
Our empirical analysis is based on data from the Irish Innovation Panel (IIP), which provides infor-mation on the innovation activities of manufactur-ing plants in Ireland and Northern Ireland over the period 1991–2008. Here, due to data limitations in the initial survey, we make use of data covering the 1994–2008 period. This involves five plant-level surveys conducted every three years using similar survey methodologies and questionnaires with common questions. Like the EU Community Innovation Survey (CIS), each of the IIP surveys covers the innovation activities of manufacturing business units over a three-year reference period. The resulting panel is unbalanced, reflecting non-response in individual surveys but also the opening and closure of individual plants: on average there are 1.7 observations per plant in the dataset (see also online supporting information).
As detailed below, our estimation approach allows both for plant-specific fixed effects and for the fact that we are using plant data from an unbalanced panel. We therefore constrain our econometric analysis to include only plants with a minimum of three observations during the survey period. This lowers the number of observations from the initial 3,918 in the full IIP to 1,064 observations that will be used in the econometric analysis. In the case of the reduced sample, the average number of observations per plant is 3.6. The mean values of the key variables used in our econometric analysis are not statistically significantly different between the full sample and the reduced sample.
possibility of knowledge transfer on external linkage selection and management, we include a variable for the plant’s own in-house R&D, and dummy variables for both subsidiary status and for foreign ownership as explanatory variables in estimating the innovation production function. In this way, we capture the possible benefits of group membership in terms of intrafirm knowledge transfer and support for innovation, and possible drawbacks in terms of group strategic direction in terms of, for example, geographic coverage of sales. In common with CIS-type innovation surveys, the estimation sample is restricted only to the “potentially innovative” sample of those plants that have either attempted innovation during the studied period or are at some likelihood of doing so (e.g., Laursen and Salter, 2006; Leiponen and Helfat, 2010). We define the group of attempted or potential innovators as those plants that fulfill at least one of the following criteria: (1) they have undertaken at least some kind of innovation activities in a given period, (2) they report using knowledge linkages in their innovation process, and (3) they report experiencing innovation constraints in a given period that either prevented innovation or reduced its level.
In common with several other innovation surveys, including the CIS, each wave of the IIP considers both the inputs and the outputs of innovation over a three-year period. A common feature of the second to sixth waves of the IIP (covering the 1994–2008 period) is the following question: “Over the last three years, did you have links with other companies or organizations as part of your product or process development?” Plants responding positively to this were then asked to identify the types of external partners with which they collaborated. Eight potential partner types were identified in the questionnaire: customers, suppliers, competitors, joint ventures, consultants, universities, industry-operated laboratories, and government-operated laboratories.1 This selection of potential linkage partners was made in line with previous research on the benefits of different types of innovation linkages and the complementarities between them (Powell et al., 1996; Roper et al., 2008).
1Respondents were also asked to indicate whether they had
linkages to “other group companies.” This type of linkage is excluded from the current analysis on the basis that this linkage is relevant only to plants that are members of groups rather than all establishments.
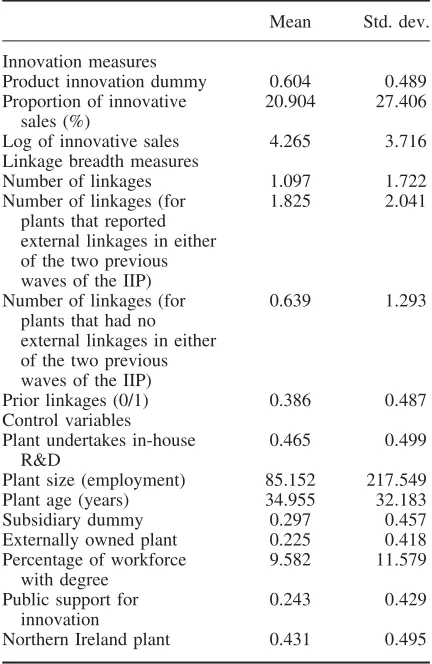
In a method analogous to that of Laursen and Salter (2006), we use plants’ binary responses to each of these eight questions to define an indicator of the breadth of innovation linkages, which takes values 0–8 depending on the number of different types of innovation partners with which each plant was working. The share of plants with any external linkages varies from 33 percent in 2003–2005 to 45 percent in 1997–1999; the share of plants with a larger number of different types of linkages is significantly lower (Table 1). As we have panel data, we can, in addition to plants’ current breadth of openness, identify whether plants used any external linkages in either of the two previous surveys. We use this information to create a dummy variable, which takes value 1 if the plant was engaged in openness prior to the current period and zero otherwise. We then use this to partition the standard breadth measure described above between those plants that had and had not undertaken external innovation linkages in a previous period. Production units with prior innovation linkages had on average 1.8 innovation linkages, whereas plants with no prior linkages had on average 0.6 linkages (Table 2).
Dependent variables
Table 1. Proportion of plants with different types of external linkages: 1994–2008
1994–1996 1997–1999 2000–2002 2003–2005 2006–2008 Share of plants with any linkages 0.39 0.45 0.39 0.33 0.38
More than one type of linkage 0.33 0.35 0.29 0.25 0.30 More than two types of linkage 0.20 0.25 0.20 0.15 0.18 More than three types of linkage 0.13 0.16 0.12 0.11 0.08 More than four types of linkage 0.05 0.09 0.06 0.05 0.03 More than five types of linkage 0.03 0.06 0.04 0.04 0.00 More than six types of linkage 0.01 0.02 0.02 0.00 0.00 More than seven types of linkage 0.01 0.01 0.00 0.00 0.00
Source: Irish Innovation Panel, waves 2–6 of the survey are included.N=1,064
Table 2. Descriptive statistics
Mean Std. dev. Innovation measures
Product innovation dummy 0.604 0.489 Proportion of innovative
sales (%)
20.904 27.406 Log of innovative sales 4.265 3.716 Linkage breadth measures
Number of linkages 1.097 1.722 Number of linkages (for
plants that reported external linkages in either of the two previous waves of the IIP)
1.825 2.041
Number of linkages (for plants that had no external linkages in either of the two previous waves of the IIP)
0.639 1.293
Prior linkages (0/1) 0.386 0.487 Control variables
Plant undertakes in-house R&D
0.465 0.499 Plant size (employment) 85.152 217.549 Plant age (years) 34.955 32.183 Subsidiary dummy 0.297 0.457 Externally owned plant 0.225 0.418 Percentage of workforce
with degree
9.582 11.579 Public support for
innovation
0.243 0.429 Northern Ireland plant 0.431 0.495
Source: Irish Innovation Panel, waves 2–6 of the survey are included.N=1,064
Control variables
The IIP also provides information on a number of other plant characteristics, which previous studies have linked to innovation outputs. For example, whether or not plants are undertaking
in-house R&D may be important in providing the knowledge inputs for innovation (Cr´epon, Duguet, and Mairesse, 1998; Love and Roper, 2001) and shaping absorptive capacity (Griffith, Redding, and Van Reenen, 2003). Across the sample, in-house R&D was undertaken by 47 percent of plants (Table 2). Other resource indicators are included to capture the potential effect on innovation of the strength of plants’ internal resource base. We include variables that give a quantitative indication of the scale of units’ resources—such as employment—as well as other factors that might suggest the quality of the in-house knowledge base, such as subsidiary status, multinationality, and age. Multinationality is included here to reflect the potential for intrafirm knowledge transfer between business units, while vintage is intended to reflect the potential for cumulative accumulation of knowl-edge capital by older business units or life-cycle effects.
[image:7.567.57.273.236.568.2]Checking for common method bias
It has to be acknowledged that analysis of survey data may suffer from common method variance or bias (CMB). However, it appears that CMB is not a significant problem in our study. We estimate a relatively complicated model (an innovation production function), with dependent variables measured at the end of the period and key explana-tory variables measured for each three-year survey period. Also, the answer scales of the questions about the dependent variables and the key explana-tory variables are very different. We have checked for CMB more formally by using the Harmon’s one-factor test (Podsakoff and Organ, 1986) and the marker variable technique (e.g., Lindell and Whitney, 2001; Malhotra, Kim, and Patil, 2006). Harmon’s one-factor test consists to a large extent of running a factor analysis of all key variables in the model. If the first unrotated factor accounts for a relatively small share of the total variance (not more than 50 percent), the implication is usually that CMB is not likely to be a significant problem. Harmon’s one-factor test suggests in our case that one single factor explains only about 27 percent of total variation of the main variables in our model.
Some authors (Podsakoff et al., 2003) argue that Harmon’s test may be insufficient to test for the presence of CMB. Therefore, we have imple-mented also the marker variable technique for spotting the potential CMB problem (Lindell and Whitney, 2001). This approach is based on com-parison of pairwise correlations in the case of key variables in the dataset. In the case of this technique, a “marker variable” is sometimes iden-tified as a variable that is theoretically unrelated to at least one variable in the study. Alternatively, where a marker variable cannot be identifieda pri-ori, the variable with lowest correlation with other variables is chosen as the “marker.” In this last case, the smallest positive correlation in the cor-relation matrix of variables used in the study is considered as a proxy for CMB. Based on both alternatives of the marker variable technique, there appears to be no reason to suspect significant CMB in our analysis.2
2One marker variable we tried was the indicator of government
support to exports. The lowest correlation of this variable with the ones in Model 1 was with age of the plant (0.0049). (There were several other variables with similar low correlation with government support to exports.) Taking this correlation as a
Estimation
We estimate two forms of the innovation pro-duction function. Let INNOVit be an innovation output indicator (for planti at survey periodt) and
FCit be the vector of plant characteristics that we use to control for other influences on innovation outputs. The first form, which provides benchmark estimates, is a standard innovation production function incorporating breadth and breadth-squared variables analogous to Laursen and Salter (2006). LetBitrepresent the breadth of plants’ col-laborative activity (i.e., count of different types of external linkages), then this innovation production function with time effects (τt), plant-specific fixed effects (πi), and idiosyncratic errors (it) can be written as:
INNO Vit =δ0+δ1Bit +δ2Bit2+δ3FCit
+τt+πi +it. (1)
We anticipate thatδ1>0 andδ2<0, reflecting the inverted U-shaped relationship between innovation outputs and breadth found in previous research (Laursen and Salter, 2006; Leiponen and Helfat, 2010). To capture potential learning effects and test the central hypothesis, we then partition both
Bit and its square between plants that engage in prior collaborative linkages and those and that do not. Let PRit take value 1 if a plant was engaged in prior collaborative linkages and value 0 otherwise; then Equation 1 can be rewritten as:
INNO Vit =δ0+δ11PRit ×Bit +δ12(1−PRit)
×Bit +δ21PRit
×B2
it+δ22(1−PRit)×Bit2
+δ3FCit+τt+πi +it (2)
Clearly if the coefficients of the variablesPRitxBit and (1−PRit)xBit, and those of their squared terms, are not significantly different from each other, then the relationship between innovation and current linkages does not depend on prior linkages. Therefore, we reject the key hypothesis if we cannot reject the joint equality test ofδ11=δ12 and δ21=δ22. We also test how the breadth of
previous collaborative linkages influences the returns to current linkages by estimating Equation 2 for each value of PRit from 1 to 8, i.e., from the lowest to the highest values of prior linkage breadth.3 This shows precisely whether different values of prior linkage breadth result in learning effects, and whether there is some optimal level of prior breadth.
The ideal estimation approach would allow us to account for unobserved heterogeneity (i.e., plant-specific, time-invariant unobserved factors of innovation performance) and to check whether the inverted U-shaped relationship between breadth and innovation performance persists if we concen-trate on within-plant effects. We therefore employ a fixed effects OLS (ordinary least squares) model in estimating Equations 1 and 2, which allows us not only to determine the effect of prior openness but also to control for unobserved heterogeneity in a manner not possible in cross-sectional studies (cf. Leiponen and Helfat, 2010: 227).4
RESULTS
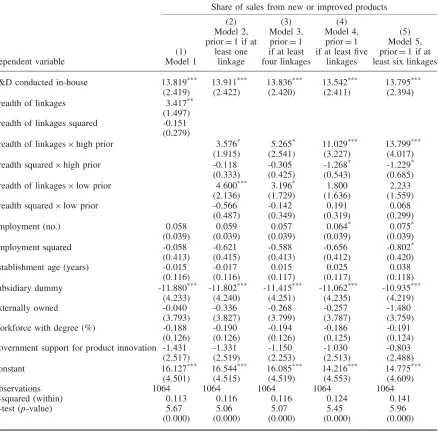
The results of estimating Equations 1 and 2 are given in Tables 4 and 5. In each case, Model 1 employs a specification of the knowledge produc-tion funcproduc-tion analogous to that used in Laursen and Salter (2006), with current breadth of linkages and its squared term as the key explanatory variables. While we find evidence that linkage breadth is associated with higher innovation outputs, unlike Laursen and Salter, we find no evidence of an inverted U-shaped relationship (the squared term has an insignificant coefficient). We next investigate whether the presence of pre-vious openness changes the effects of current link-age breadth on the innovation output of the plant. This is done by estimating Equation 2. However, it may be the case that plants need to reach a certain level of prior openness before the beneficial learn-ing effects materialize. Learnlearn-ing which linkages
3In practice, it was not possible to perform estimations for
prior breadth involving seven or eight linkages as the number of observations of this type was extremely small (see Table 1).
4A Hausman test indicated that fixed effects estimation was
preferred to its random effects equivalent. For example, the Hausman test statistic in testing the fixed effects vs. random effects specification in Model 1 in Table 4 is 30.11 (p-value 0.007).
pay off in innovation terms, and therefore learn-ing to which ones it is worth devotlearn-ing valuable management attention, may not only take time, but may also be a function of thebreadth of previous linkages. We therefore perform a number of sepa-rate estimations setting the prior openness dummy equal to 1 if the plant had at least one, two, three, four, five, or six knowledge linkages, respectively, during at least one of the two previous periods. This allows us to determine precisely what extent of previous breadth of innovation collaboration is required for learning effects to occur. Results are shown in Models 2–5 of Tables 4 and 5.
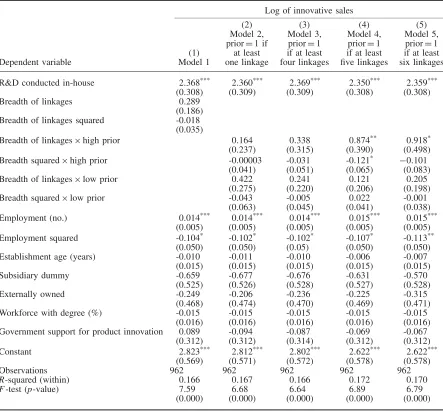
The results suggest that learning effects do indeed occur, but only where there is substantial linkage breadth in previous periods. For example, where plants have at least one previous linkage (Model 2), the Wald tests suggest that there is no significant difference between plants with and without prior linkages for either dependent vari-able. The same is true for plants with at least two or three prior types of knowledge linkage (results not shown—available on request). However, the situation is very different for plants that have at least four types of previous linkage (Models 3–5), where there starts to be evidence of some benefit from the existence of prior linkages. In particular, for plants with at least five types of previous link-age and above (Models 4 and 5), there is statistical evidence of the significant role of prior breadth of openness: the Wald tests of the joint condition that δ11=δ12andδ21=δ22in Equation 2 is rejected for the first dependent variable, and in the case of the second (log of innovative sales), only plants with substantial prior linkage breadth show enhanced levels of innovation. Thus, plants with at least five types of prior linkages have a significantly greater innovation return to their current linkage breadth than those with lower prior linkages, and this effect persists for six-plus types of linkage.5
Two other results are worthy of note. First, for both dependent variables, the benefits of prior linkage breadth increases consistently as the num-ber of previous linkage types increases. Second, in both cases, there is some evidence of an inverted U-shaped effect of linkage breadth once at least
5We note that there appears to be evidence suggesting
Table 4. The role of external linkage breadth in innovation (fixed effects estimation): share of sales from new or improved products as the dependent variable
Share of sales from new or improved products
Dependent variable
(1) Model 1
(2) Model 2, prior=1 if at
least one linkage
(3) Model 3, prior=1 if at least four linkages
(4) Model 4, prior=1 if at least five
linkages
(5) Model 5, prior=1 if at least six linkages R&D conducted in-house 13.819*** 13.911*** 13.836*** 13.542*** 13.795***
(2.419) (2.422) (2.420) (2.411) (2.394)
Breadth of linkages 3.417**
(1.497)
Breadth of linkages squared -0.151
(0.279)
Breadth of linkages×high prior 3.576* 5.265* 11.029*** 13.799***
(1.915) (2.541) (3.227) (4.017)
Breadth squared×high prior -0.118 -0.305 -1.268* -1.229*
(0.333) (0.425) (0.543) (0.685)
Breadth of linkages×low prior 4.600*** 3.196* 1.800 2.233
(2.136) (1.729) (1.636) (1.559)
Breadth squared×low prior -0.566 -0.142 0.191 0.068
(0.487) (0.349) (0.319) (0.299)
Employment (no.) 0.058 0.059 0.057 0.064* 0.075*
(0.039) (0.039) (0.039) (0.039) (0.039)
Employment squared -0.058 -0.621 -0.588 -0.656 -0.802*
(0.413) (0.415) (0.413) (0.412) (0.420)
Establishment age (years) -0.015 -0.017 0.015 0.025 0.038
(0.116) (0.116) (0.117) (0.117) (0.118)
Subsidiary dummy -11.880*** -11.802*** -11.415*** -11.062*** -10.935***
(4.233) (4.240) (4.251) (4.235) (4.219)
Externally owned -0.040 -0.336 -0.268 -0.257 -1.480
(3.793) (3.827) (3.799) (3.787) (3.759)
Workforce with degree (%) -0.188 -0.190 -0.194 -0.186 -0.191
(0.126) (0.126) (0.126) (0.125) (0.124)
Government support for product innovation -1.431 -1.331 -1.150 -1.030 -0.803
(2.517) (2.519) (2.253) (2.513) (2.488)
Constant 16.127*** 16.544*** 16.085*** 14.216*** 14.775***
(4.501) (4.515) (4.519) (4.553) (4.609)
Observations 1064 1064 1064 1064 1064
R-squared (within) 0.113 0.116 0.116 0.124 0.141
F-test (p-value) 5.67 5.06 5.07 5.45 5.96
(0.000) (0.000) (0.000) (0.000) (0.000)
Notes and sources: Estimation by OLS with plant-level fixed effects. Standard errors in parentheses. Joint F-test statistic (and correspondingp-value) of hypothesis thatδ11=δ12andδ21=δ22is 0.82 (p=0.439) in Model 2, 0.85 (p=0.430) in Model 3, 3.58
(p=0.029) in Model 4, 7.92 (p=0.0004) in Model 5. Irish Innovation Panel, waves 2–6 of the survey are included. *p<0.1; **p<0.05; ***p<0.01
five previous linkage types is reached. This suggests that, at least where plants already have substantial experience of external linkages, the diminishing returns to increased breadth observed in cross-sectional studies (Laursen and Salter, 2006; Leiponen and Helfat, 2010) are at least partly a within-plant effect, and not exclusively an across-plant effect.
Table 5. The role of external linkage breadth in innovation (fixed effects estimation): log of innovative sales as the dependent variable
Log of innovative sales
Dependent variable
(1) Model 1
(2) Model 2, prior=1 if
at least one linkage
(3) Model 3, prior=1 if at least four linkages
(4) Model 4, prior=1 if at least five linkages
(5) Model 5, prior=1 if at least six linkages R&D conducted in-house 2.368*** 2.360*** 2.369*** 2.350*** 2.359***
(0.308) (0.309) (0.309) (0.308) (0.308)
Breadth of linkages 0.289
(0.186)
Breadth of linkages squared -0.018
(0.035)
Breadth of linkages×high prior 0.164 0.338 0.874** 0.918*
(0.237) (0.315) (0.390) (0.498)
Breadth squared×high prior -0.00003 -0.031 -0.121* −0.101
(0.041) (0.051) (0.065) (0.083)
Breadth of linkages×low prior 0.422 0.241 0.121 0.205
(0.275) (0.220) (0.206) (0.198)
Breadth squared×low prior -0.043 -0.005 0.022 -0.001
(0.063) (0.045) (0.041) (0.038)
Employment (no.) 0.014*** 0.014*** 0.014*** 0.015*** 0.015***
(0.005) (0.005) (0.005) (0.005) (0.005)
Employment squared -0.104* -0.102* -0.102* -0.107* -0.113**
(0.050) (0.050) (0.05) (0.050) (0.050)
Establishment age (years) -0.010 -0.011 -0.010 -0.006 -0.007
(0.015) (0.015) (0.015) (0.015) (0.015)
Subsidiary dummy -0.659 -0.677 -0.676 -0.631 -0.570
(0.525) (0.526) (0.528) (0.527) (0.528)
Externally owned -0.249 -0.206 -0.236 -0.225 -0.315
(0.468) (0.474) (0.470) (0.469) (0.471)
Workforce with degree (%) -0.015 -0.015 -0.015 -0.015 -0.015
(0.016) (0.016) (0.016) (0.016) (0.016)
Government support for product innovation 0.089 -0.094 -0.087 -0.069 -0.067
(0.312) (0.312) (0.314) (0.312) (0.312)
Constant 2.823*** 2.812*** 2.802*** 2.622*** 2.622***
(0.569) (0.571) (0.572) (0.578) (0.578)
Observations 962 962 962 962 962
R-squared (within) 0.166 0.167 0.166 0.172 0.170
F-test (p-value) 7.59 6.68 6.64 6.89 6.79
(0.000) (0.000) (0.000) (0.000) (0.000)
Notes and sources: Estimation by OLS with plant-level fixed effects. Standard errors in parentheses. Joint Wald chi2 test statistic
(and correspondingp-value) of hypothesis thatδ11=δ12andδ21=δ22is 0.36 (p=0.695) in Model 2, 0.11 (p=0.893) in Model 3,
1.80 (p=0.167) in Model 4, 1.12 (p=0.328) in Model 5. Irish Innovation Panel, waves 2–6 of the survey are included. *p<0.1; **p<0.05; ***p<0.01
estimates are fixed effects, reflecting within-plant variation, these results must reflect the impact of acquisition of previously independent plants that have become subsidiaries of a larger group. Interestingly, this negative effect occurs only for the share of innovative sales variable, not the level of innovative sales, suggesting that when such an acquisition occurs the sales of the acquired plants’ portfolio of older products expands faster (or
decreases less) than its newly introduced products. This effect applies only to plants acquired by domestically located groups; there is no effect of acquisition by foreign firms (the externally owned coefficient is consistently insignificant).
Robustness check
of innovation linkages obtain greater innovative returns to existing linkages. As a robustness check, we consider whether the observed effect of previous linkages is merely the direct effect of lagged knowledge linkages (i.e., a simple dynamic effect), rather than a learning effect per se. We therefore perform an estimation that contains current breadth of linkages and its square, their lagged equivalents, and interaction terms between the current and lagged values. For both dependent variables, the coefficients on lagged breadth and all the interaction terms are consistently insignificant,6 suggesting that the observed results do indeed reflect the impact of substantial prior linkages on current linkages, consistent with the interpretation above.
CONCLUSIONS AND DISCUSSION
This paper explores one aspect of openness in the organization of firms’ innovation activities—how external linkages help shape innovation outcomes. In particular, we explore how business units learn from prior openness, thus providing a temporal dimension to the link between external relationships and innovation. We find that having linkages in previous time periods has a positive effect on the relationship between current linkage breadth and innovation, suggesting that there are learning effects present in terms of innovation linkages. However, breadth matters in previous time periods, as it does in the present period: there is a statistically significant difference in the relationship between current openness and performance only for establishments that already had more than four different types of linkage in a previous period.
Overall, our results suggest support for the concept of learning effects from previous link-ages. Management teams learn from the process of selecting and/or managing multiple relation-ships in one period, and are able to apply that learning in subsequent periods. This, in turn, has implications for the open innovation paradigm and for research on innovation generally. Although the open innovation paradigm, at least implicitly, deals with openness through time (Chesbrough, 2006), most empirical studies rely on cross-sectional data
6These estimations are available on request.
to examine the link between openness and inno-vation. Our results suggest there may be a dou-ble benefit from openness in innovation: openness increases innovative performance in the current period (as previous studies suggest), and also pro-vides the basis for learning effects, which increase the benefits of future openness. This suggests that future research on open innovation should pay more attention to the time dimension in examining how openness affects innovation.
The implications for management arise from a deeper understanding of the temporal dimen-sion of the relationship between external linkages and innovation. The benefits of such linkages do not derive solely from their current impact on innovation but also from the knowledge gained in the learning process that takes place through time. At the level of the individual plant, this suggests that investing time in learn-ing how to manage such linkages, and adoptlearn-ing a strategic view of those linkages that have the highest returns, can have significant payoffs in terms of future innovation. Intrafirm transfers of management knowledge relating to the selection and development of external innovation linkages may have similarly positive payoffs. Capturing these benefits—maximizing the value of poten-tial learning—will require some consistency in the allocation of responsibility for developing and managing external innovation linkages within an organization. Where this can be done, our results suggest that managing external relationships can itself develop into the basis for a dynamic capabil-ity, with implications for future performance (Kale and Singh, 2007; Zollo and Winter, 2002).
Limitations and future research
have employed fixed-effects panel data techniques, which help mitigate the effect of (time-invariant) unobserved heterogeneity, and have conducted rel-evant robustness checks; nevertheless, we cannot absolutely discount these effects.
Future research might usefully explore the pre-cise nature of the apparent learning effects iden-tified above. For example, do the learning effects occur mainly through better selection of collabora-tive partners or through improved management of external relationships? Do different types of link-ages have different learning effects? It is likely that research to answer these questions will come from more in-depth analysis of individual firms’ inno-vation and linkage activity as well as from broad survey-based datasets.
ACKNOWLEDGEMENTS
The research on which this paper is based was funded by the ESRC under award RES-062-23-2767. We are grateful for constructive comments by two anonymous referees and by discussants and participants at the DRUID Summer Conference 2011 in Copenhagen.
REFERENCES
Adner R, Helfat CE. 2003. Corporate effects and dynamic managerial capabilities. Strategic Management Jour-nal24: 1011–1025.
Ahuja G. 2000. Collaboration networks, structural holes and innovation: a longitudinal study. Administrative Science Quarterly45: 425–455.
Argote L, Miron-Spektor E. 2011. Organizational learn-ing: from experience to knowledge.Organization Sci-ence22: 1123–1137.
Cassiman B, Veugelers R. 2006. In search of comple-mentarity in innovation strategy: internal R&D and external knowledge acquisition.Management Science
52: 68–82.
Chesbrough H. 2006. Open Business Models: How to Thrive in the New Innovation Landscape. Harvard Business School Press: Boston, MA.
Cr´epon B, Duguet E, Mairesse J. 1998. Research, innovation and productivity: an econometric analysis at the firm level. Economics of Inovation and New Technology 7: 115–158.
Driffield N, Love JH, Menghinello S. 2010. The multina-tional enterprise as a source of internamultina-tional knowl-edge flows: direct evidence from Italy. Journal of International Business Studies 41: 350–359.
Eggers JP, Kaplan S. 2009. Cognition and renewal: com-paring CEO and organizational effects on incumbent
adaptation to technical change. Organization Science
20: 461–477.
Freel MS. 2005. Patterns of innovation and skills in small firms.Technovation 25(2): 123–134.
Griffith R, Redding S, Van Reenen J. 2003. R&D and absorptive capacity: theory and empirical evidence.
Scandinavian Journal of Economics 105(1): 99–118. Griliches Z. 1995. R&D and productivity: econometric
results and measurement issues. In Handbook of the Economics of Innovation and Technological Change, Stoneman P (ed). Blackwell: Oxford, UK.
von Hippel E. 1988.The Sources of Innovation. Oxford University Press: New York.
Kale P, Singh H. 2007. Building firm capabilities through learning: the role of the alliance learning process in alliance capability and firm-level alliance success.
Strategic Management Journal 28: 981–1000. Katila R, Ahuja G. 2002. Something old, something
new: a longitudinal study of search behavior and new product introduction. Academy of Management Journal 45(8): 1183–1194.
Laursen K, Salter A. 2006. Open for innovation: the role of openness in explaining innovation performance among UK manufacturing firms. Strategic Manage-ment Journal 27: 131–150.
Leiponen A. 2005. Organization of knowledge and innovation: the case of Finnish business services.
Industry and Innovation 12: 185–203.
Leiponen A, Helfat CE. 2010. Innovation objectives, knowledge sources, and the benefits of breadth.
Strategic Management Journal 31: 224–236. Leiponen A, Helfat CE. 2011. Location, decentralization,
and knowledge sources for innovation. Organization Science 22: 641–658.
Levinthal DA, March JG. 1993. The myopia of learning.
Strategic Management Journal, (Winter) Special Issue
14: 95–112.
Lindell MK, Whitney DJ. 2001. Accounting for common method variance in cross-sectional research designs.
Journal of Applied Psychology 86(1): 114–121. Love JH, Roper S. 2001. Location and network effects
on innovation success: evidence for UK, German and Irish manufacturing plants. Research Policy 30: 643–661.
Malhotra NK, Kim SS, Patil A. 2006. Common method variance in IS research: a comparison of alternative approaches and a reanalysis of past research. Man-agement Science 52: 1865–1883.
Nelson RR, Winter S. 1982.An Evolutionary Theory of Economic Change. Harvard University Press: Cam-bridge, MA.
Ocasio W. 1997. Towards an attention-based view of the firm. Strategic Management Journal, (Summer) Special Issue18: 187–206.
Podsakoff PM, MacKenzie SB, Lee JY, Podsakoff NP. 2003. Common method biases in behavioral research: a critical review of the literature and rec-ommended remedies. Journal of Applied Psychology
88: 879–903.
Powell WW, Koput KW, Smith-Doerr L. 1996. Interor-ganizational collaboration and the locus of innovation: networks of learning in biotechnology.Administrative Science Quarterly 41: 116–145.
Roper S, Du J, Love JH. 2008. Modelling the innovation value chain.Research Policy 37: 961–977.
Rothwell R, Freeman C, Horseley A, Jervis VTP, Townsend J. 1974. Sappho updated—Project Sappho phase II.Research Policy 3: 204–225.
Simon HA. 1947. Administrative Behavior: A Study of Decision-Making Process in Administrative Organiza-tion. Macmillan: Chicago, IL.
Singh J. 2007. Asymmetry of knowledge spillovers between MNCs and host country firms. Journal of International Business Studies 38(5): 764–786.
Zollo M, Winter SG. 2002. Deliberate learning and the evolution of dynamic capabilities. Organization Science 13: 339–351.
SUPPORTING INFORMATION
Additional supporting information may be found in the online version of this article: