warwick.ac.uk/lib-publications
Original citation:Bloodworth, Alan G. and Zhou, Zhou (2014) Acoustic emission testing of fibre reinforced concrete tunnel lining samples. In: 7th International Symposium on Sprayed Concrete, Sandefjord, Norway, 16–19 Jun 2014. Published in: Proceedings 7th International Symposium on Sprayed Concrete ; Modern Use of Wet Mix Sprayed Concrete for Underground Support, Sandefjord, Norway, 16–19 June 2014 pp. 98-111.
Permanent WRAP URL:
http://wrap.warwick.ac.uk/85240
Copyright and reuse:
The Warwick Research Archive Portal (WRAP) makes this work by researchers of the University of Warwick available open access under the following conditions. Copyright © and all moral rights to the version of the paper presented here belong to the individual author(s) and/or other copyright owners. To the extent reasonable and practicable the material made available in WRAP has been checked for eligibility before being made available.
Copies of full items can be used for personal research or study, educational, or not-for-profit purposes without prior permission or charge. Provided that the authors, title and full bibliographic details are credited, a hyperlink and/or URL is given for the original metadata page and the content is not changed in any way.
Publisher statement:
A note on versions:
The version presented here is a working paper or pre-print that may be later published elsewhere. If a published version is known of, the above WRAP URL will contain details on finding it.
7th INTERNATIONAL SYMPOSIUM ON SPRAYED CONCRETE – Modern Use of Wet Mix Sprayed Concrete for Underground Support
– Sandefjord, Norway, 16. – 19. June 2014
ACOUSTIC EMISSION TESTING OF FIBRE REINFORCED CONCRETE TUNNEL LINING SAMPLES
Alan Bloodworth, Southampton University, UK [email protected]
Xuanbo Zhou, Southampton University, UK
The aim of the research described in this paper was to trial the use of acoustic emission testing to measure the location of cracks and the degree of damage during loading of sprayed concrete lining (SCL) specimens. AE testing has potential application in research on SCL where there is a need to meet strict crack-width criteria at the serviceability limit state (and therefore to
understand the evolution of cracking at low loads), particularly if SCL is to be used for secondary as well as primary tunnel linings.
A short series of laboratory experiments were carried out on beam specimens of steel fibre-reinforced concrete (FRC) with span 0.9 m that were cut from trial panels of SCL. The acoustic emission testing uses microphones attached to the surface of the specimen to detect acoustic signals emitted when it cracks under loading. The number of events and total acoustic energy released during the loading and unloading phases of a loading cycle can be correlated to the degree of damage occurring in the specimen by methods such as NDIS-2421. If two or more acoustic detectors are used, the location of the source of the acoustic emission can be obtained in either 2-D or 3-D space.
The technique has attractions as a non-destructive technique for real-time damage assessment, and has been applied in reinforced concrete structures and buildings but not so commonly in FRC structures or tunnels. The experiments showed the technique to be successful in principle for detecting damage at an early stage in loading, monitoring the development of cracks within the material and also showed that the NDIS method could be applied to an FRC structure.
INTRODUCTION
Acoustic Emission Testing
Acoustic emission, or AE, is the release of transient elastic waves within a solid material caused by the localised redistribution of stress which occurs when new cracks are formed or existing cracks extend. This can take place along with the appearance of damage [1], or may happen just under normal service conditions when no damage or irreversible behaviour is evident [2].
damage such as cracking, corrosion, and delamination with a high degree of sensitivity [3]. Example applications in civil engineering include yielding of steel, crack growth in steel and concrete, corrosion for metals, fiber breakage and matrix de-bonding for composites. In this study, AE technology will be applied to detect the onset of damage and nonlinear behaviour in fiber-reinforced sprayed concrete test specimens simulating a section of tunnel lining.
[image:3.595.181.432.209.363.2]The principle of AE detection is that sensors placed on the surface of testing sample detect the transient elastic waves (Fig. 1), record them and send signals to electronic systems for further analysis. In systems with multiple sensors, differences in wave arrival times may be used to calculate the position of the origin of the acoustic energy (normally interpreted as the tip of the advanced crack or defect) in one, two or three dimensions depending on the number of sensors.
Figure 1 Theory of acoustic emission [4]
AE testing is completely non-destructive, requiring only a limited number of sensors glued on the surface of the structure. It enables real-time monitoring of a structure, as signals are produced as soon as cracks occur. Although AE is primarily used to monitor certain locations within a structure, by employing enough sensors and data processing devices, AE can be used to monitor a large area or a complete structure.
Background noise may have an adverse effect on the data obtained in an AE test, potentially rendering it unusable. This noise can usually be isolated to mechanical, electrical and
environmental sources [5], and may be mitigated against by for example mechanical isolation (such as that provided by neoprene bearing pads), filtering, or adjustment of the measurement threshold.
Another disadvantage of the AE method is in relation to its application in concrete structures. Concrete is a highly variable material at the microstructural level, with scattered
inhomogeneities that may interfere with AE wave propagation. For concrete therefore, it is desirable to compare the results of AE with other non-destructive evaluation techniques [2].
Quantification of Output from AE Testing
There are two methods by which the output signals from AE testing sensors may be manipulated and displayed for interpretation by the user: parameter-based analysis and signal-based analysis.
In parameter-based analysis (also known as qualitative analysis), parameters are extracted from the AE signals and the signals themselves are not saved. Figure 2 shows a typical AE signal along with the commonly utilised parameters, descriptions of which are given below:
Threshold – the signal value at which the AE system is triggered to record other parameters [6]. Not surprisingly, the value of threshold greatly influences the other AE parameters such as Hit, Amplitude and Duration.
Hit – each time the magnitude of a signal exceeds the threshold, this is recorded as a Hit. Amplitude – the absolute value of the peak of the AE signal, in units of voltage when
processed in the data acquisition device. Amplitude is usually expressed on a log scale in decibels (dB) by the conversion shown below:
⁄
where Vmax = Voltage of peak excursion, and
Vref= Reference voltage.
Signal Duration – Time elapsed from the signal crossing the Threshold the first time, until the last time it crosses below the Threshold in absolute terms. The unit is usually milliseconds [6]. The relationship between signal amplitude and signal duration is an indication of the signal’s shape.
Signal Rise Time – Time from the signal crossing the Threshold to the time when it reaches maximum Amplitude. This is measured in micro- or milliseconds and also yields information about the signal’s shape in conjunction with the Duration and Amplitude. Signal energy – the area under the rectified signal envelope [6], as shown in Figure 2.
This is a measure of the overall magnitude of the source event over the entire duration from the time the Threshold is first exceeded.
[image:4.595.204.397.573.745.2] Count – the number of times that an AE signal crossing the Threshold level is recorded. This may either be in total, i.e. from the beginning of a test, or expressed as a count rate (number of Hits over a fixed period of time).
In signal-based analysis (also known as the quantitative technique), the entire acoustic
waveform is recorded and converted to digital output. This offers better data interpretation, as it renders post-processing of AE data possible (for example by eliminating noise), but requires large storing capacity, particularly for a long-duration test.
Interpretation of AE Output
In order to interpret the large number of AE Hits that may occur in a typical materials test, and draw conclusions about the damage state of the structure/element, a framework exists based originally on the phenomenon of the Kaiser effect.
The Kaiser effect was proposed during the 1950s byJosef Kaiser, founder of modern AE technology. Kaiser discovered the near universality of the acoustic emission phenomenon, observing it in all materials he tested. He identified the Kaiser effect, defined as “the absence of detectable acoustic emission until the previous maximum applied stress level has been
exceeded” [5]. This effect meant that measurement of AE emission during loading could lead to a clear conclusion about the magnitude of the maximum prior loading experienced by the sample under investigation [8]. In practice, if the Kaiser effect is present, it is found that when acoustic emission resulting from a given applied load has ceased, further acoustic emission will not take place until that previous maximum stress level is reached [5]. The degree to which the Kaiser effect is present varies between materials, and it may disappear after several hours or days due to recovery characteristics. However, the presence of the Kaiser effect should be enquired into during data interpretation, and the effect if present may yield important data regarding the maximum load a structure has experienced in its recent past.
[image:5.595.216.392.457.649.2]In Figure 3, cumulative AE Count is plotted directly against applied load for an imaginary sample. Hits are generated during the first load rise (0-1), but as the load is reduced (1-2) and increased again (2-3), there is no more emission generated until the previous stress level (3) is reached. The behaviour observed at (3) is an example of the Kaiser effect.
Figure 3Kaiser and Felicity effects [9]
A Felicity ratio greater than 1.0 is indicative of the Kaiser effect being present, whereas Felicity ratio less than 1.0 indicates a breakdown of the Kaiser effect, which may occur most noticeably in situations where time-dependent mechanisms control the deformation [5]. Felicity ratios below 1.0 are often used as an indication of significant damage or flaws being accrued in the material [12], with smaller values indicating increased damage [11].
In reinforced concrete (RC), typical sources of AE are cracking, plastic deformation, friction, corrosion and aggregate de-bonding [13]. Yuyama et al [14] were the first to introduce the Concrete Beam Integrity (CBI) ratio (same as the Felicity ratio) to quantify AE in RC beams. They obtained the ratio from laboratory experiments conducted on a range of RC beams and frames under cyclic loading and found that a decrease in CBI occurred with increase in damage level of the tested specimens, concluding that CBI ratio can be used to estimate the severity of damage.
Ohtsu et al [15] proposed the Japanese Society for Non-destructive Inspection (JSNDI) NDIS-2421 quantitative damage level assessment criterion based on the Kaiser effect. Two ratios are defined. Load Ratio is the ratio of the load at the onset of AE activity in the subsequent loading to the previous maximum load (and is thus identical to the Felicity ratio). Calm Ratio is defined as the ratio of the number of cumulative AE Hits during an unloading process to that of the previous loading cycle up to its maximum, and thus is a slightly different measure of emission to the Kaiser or Felicity effects, which consider only loading and reloading.
Laboratory experiments were conducted [15] on five different types of RC beam under
[image:6.595.193.414.520.680.2]incrementally increasing loading with AE measurement. Crack-mouth opening displacement (CMOD) values were measured and used to determine the limit values for Load Ratio and Calm Ratio (0.9 and 0.05 respectively) at the boundaries between damage classifications (Heavy, Intermediate, Minor), as shown in Figure 4. For any type of concrete or type of beam other than that used by Ohtsu et al [15], these boundary levels would need to be verified by experiment. For example, for beams shorter than 1 m, 0.4–0.5 and 1.0 have been proposed as limit values for the Load Ratio and Calm Ratio respectively [16].
LABORATORY EXPERIMENTS
Experimental Samples
Three fibre-reinforced sprayed concrete beams of cross-section depth 150 mm, width 150 mm and span 900 mm were tested in four point bending as shown in Figure 5. The beams were cut by diamond saw from test panels produced for the study described in [17] and [18] and included an intermediate layer of spray-applied waterproofing membrane (Fig. 6). 28-day compressive strength of the concrete was 38 MPa and tensile strength 1.7 MPa, obtained as the average of three 100 mm cylinder samples. Practice tests showed the failure load of the beams to be around 14 kN, with a maximum deflection of 6 mm.
[image:7.595.109.477.219.343.2]
Figure 5Four-point bending of FRC beam
Figure 6 FRC beam specimens with membrane
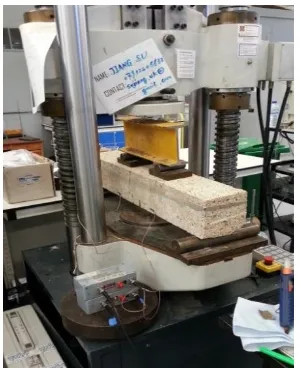
Experimental Setup
The experimental setup is shown in Figure 7. The sample was loaded by a Denison Mayes 7159 servo-hydraulic testing machine operated under displacement control. A steel spreader beam between the actuator and the specimen transferred the machine load as the two point loads. Mid-span deflection was measured using a digital gauge on the underside of the beam on its
centreline.
Two acoustic sensors were attached on one side of the beam below the line of the membrane, one under each loading point (Fig. 8). Since all the specimens were designed to fail in the bending mode, a major crack was expected to form from the bottom of the beam in the middle one-third of the beam span, between these sensor positions. To apply the sensors, the surface of the concrete was first cleaned and sanded. High-silicone vacuum grease was used as the
coupling medium, applied first to the sensor which was then pressed against the concrete surface.
267 mm
800 mm
[image:7.595.180.429.391.514.2]
Figure 7 Photograph of experimental setup
A datalogger continuously recorded machine load, stroke and midspan deflection during the test. The AE data acquisition system used was a 15 channel AE system produced by Vallen Systeme GmbH. The two sensors had flat frequency response between 300 and 800 kHz, making them well adapted to AE activity measurements. The Threshold at which an AE event would be recorded was set to 40dB.
It is normal to conduct a calibration test to check the sensitivity of the sensors and ensure all equipment is in proper working order before conducting the formal testing. A standard procedure is the pencil lead break test specified in ASTM E 2374, in which a 0.3-0.5 mm pencil lead is held at an orientation of 30° to the surface at a location between the sensors, and pressed against the surface and broken. The signals recorded at the sensors should indicate the position of the pencil break on the AE data analysis screen.
Figure 8Location of AE sensors
Testing Procedure
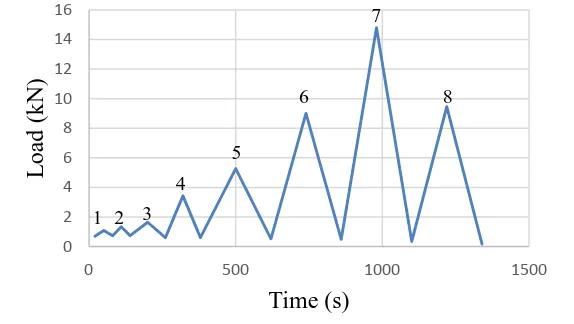
[image:8.595.205.409.462.618.2]load-time plot (for Beam 1), where the peak load was reached during cycle 7. Plots are similar for Beams 2 and 3, except that the peak load was reached slightly later, during cycle 8.
Figure 9Load-time plot for Beam 1 (with cycle numbers shown)
TEST RESULTS
[image:9.595.141.474.438.628.2]Load-deflection data
Figure 10 shows load-deflection graphs for the three tested beams, plotted at the peak loads for each cycle. Beam 2 has the highest peak load (19.5 kN), with Beams 1 and 3 showing peaks of about 14.8kN. Displacements at peak load for Beams 1 and 2 are similar, 0.51 mm and 0.63 mm respectively, but for Beam 3 it is larger, 0.83 mm. However, all load-deflection plots have similar form, starting linearly and then gradually becoming nonlinear as peak load is approached. Cracks were easy to identify visually during the nonlinear region.
Figure 10 Load-deflection plots for tested beams
AE recorded Hits
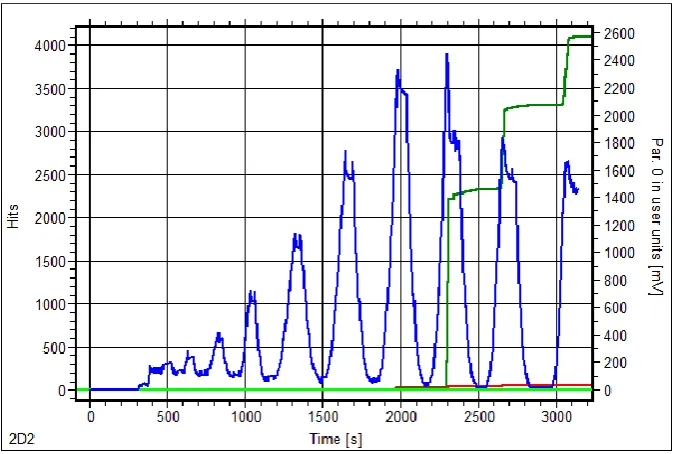
Figures 11 to 13 give load and cumulative AE hits against time for Beams 1 to 3 respectively. Load is the blue line measured against the axis on the right, reported in mV as recorded by the datalogger. AE Hits for the two sensors are shown in red and green.
For Beam 1, it can be seen that initially no AE activity was recorded until cycle 3, but then AE Hits increased rapidly in this cycle, gradually in cycle 4 and then rapidly again in cycle 5. This
0 2 4 6 8 10 12 14 16
0 500 1000 1500
L oa d (kN ) Time (s) 0 5 10 15 20 25
0 0.2 0.4 0.6 0.8 1 1.2
L
oa
d
(kN
)
Mid-span displacement (mm)
Beam 3
Beam 2
Beam 1 1 2 3
4 5
6
7
pattern was repeated in general until the failure load was reached. The pause in activity during cycle 6 can possibly be explained by the flexural crack reaching the membrane in the test specimen.
[image:10.595.140.473.180.403.2]The indication from the AE Hits is that cracking started to form during load cycle 3, however the crack was not visibly evident until cycle 8, where there was again an increase in AE Hits. This shows that AE in the early stages can give evidence of damage occurring that would otherwise not be visible.
Figure 11 Load, AE Hits and time plot for Beam 1
[image:10.595.133.478.458.691.2]Figure 13Load, AE Hits and time plot for Beam 3
Figures 12 and 13 show the results for Beams 2 and 3. These beams have a similar behaviour in which little AE activity was detected until the load reached 80% of peak, during load cycle 7. After that, intensive AE Hits were recorded, along with observation of the beam cracking. The sensors used for Beams 2 and 3 were less sensitive than those used for Beam 1, and so it appears they were less able to give advance warning of cracking occurring.
Onset of nonlinearity
Comparing the load-deflection plots (Fig. 10) with the AE Hits-time plots for the three beams, it is found that AE activity was recorded prior to the load-deflection plots becoming nonlinear. For example, for Beam 1 and Beam 2, AE Hits started to be recorded during load cycle 3 whilst nonlinear behaviour starts in cycles 7 and 8. For Beam 3, AE Hits were recorded during load cycle 5 which is later than the other two beams but still before the load-deflection plot became nonlinear. The indication is that microcracking is occurring within the material at a stage when the release of energy is still mainly elastic.
Locations of cracks and AE detected damage
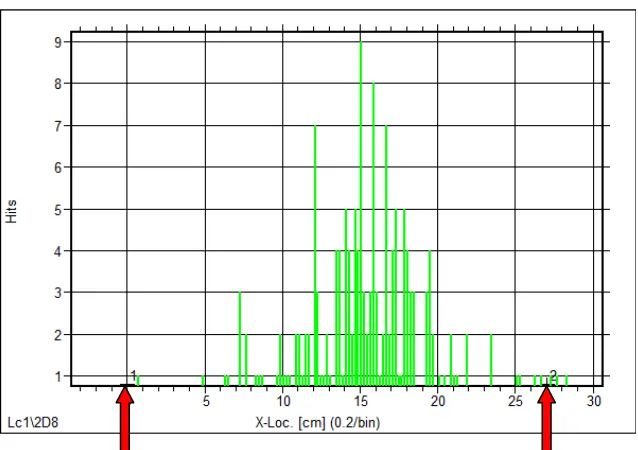
When there are two or more sensors, AE instrumentation may be used to determine the location of cracking within a structure. For Beam 1, the first visually detected crack was almost at midspan (actually 151 mm to the right of the left-hand sensor), as shown in Figure 14. The cumulative Count of AE Hits by location is shown in Figure 15. This shows good
consistency with the visual observation, and shows again a large number of cracking events that were not visible at the surface. Similar results were obtained for the other two beams.
NDIS-2421 quantitative damage level assessment
Figure 14 Crack position observed visually for Beam 1
Figure 15 Crack positions detected by AE system for Beam 1
(sensor positions indicated by red arrows)
Table 1 Data of AE Hits per cycle for Beam 1
Figure 16 NDIS-2421 classification for Beam 1
DISCUSSION AND CONCLUSIONS
Acoustic emission is a technique that has been applied in detecting damage and flaws in materials in many industries, including in civil engineering where it has found application in steel, concrete and fibre composite structures, although rarely outside the laboratory.
In this project, the validity of the technique and its ability to detect internal microcracking in samples of fibre-reinforced sprayed concrete lined tunnels has been demonstrated. It proved possible to detect acoustic events before cracking was visible on the surface, and before the overall load-deflection graph exhibited nonlinearity. Thus the technique has potential usefulness in giving prior warning of the serviceability limit state of first cracking being reached, either in the laboratory or possibly in the field as well.
As well as the occurrence of a cracking event, the system even with only two sensors was able to pinpoint the location of the acoustic source with a surprising degree of accuracy. This also has potential application both in the laboratory and in the field in providing data to understand the mechanism of response of a tunnel lining to load, especially with a greater number of sensors.
The framework of acoustic event occurrence under cyclic loading leading to the Kaiser effect, Felicity effect and the quantitative damage level assessment to JSNDI method NDIS-2421 has been developed for more conventional materials and structures but has been shown to be reasonably valid for the sprayed concrete beams in this study, although admittedly the data is limited. This gives the possibility, subject to more research, of applying frameworks like NDIS-2421 in the assessment of the damage state of full-sized underground structures in the field.
Overall therefore, this limited study has shown the potential of the acoustic emission monitoring technique both as a tool for further research on sprayed concrete tunnel linings in the laboratory, and also for the assessment of their damage condition in the field.
ACKNOWLEDGEMENTS
The authors would like to express their thanks to Mott MacDonald and TAM-Normet for the provision of samples, and to Martin Browne and the other members of the Bioengineering
0.00 0.20 0.40 0.60 0.80 1.00 1.20 1.40
0.00 0.50 1.00 1.50
Research Group at University of Southampton for their assistance with the acoustic emission testing.
REFERENCES
1. Di Benedetti, M. “Acoustic emission in structural health monitoring of reinforced concrete structures”. Doctoral thesis. University of Miami, 2012.
2. Grosse, C.U. and Ohtsu, M. “Acoustic emission testing”. Heidelberg: Springer, 2008.
3. Wilcox, P. D., Lee, C. K., Scholey, J. J., Friswell, M. I., Wisnom, M. R. and Drinkwater, B. W. “Quantitative structural health monitoring using acoustic emission”. In Smart Structures and Materials. International Society for Optics and Photonics, 2006.
4. Vallen, D.I.H. “Acoustic emission testing fundamentals, equipment, applications”. NDT.net, 7(9), September 2002.
5. ASNT. “Nondestructive testing handbook”. 3rd ed. Columbus, OH: American Society for Nondestructive Testing (ASNT), 2005.
6. ASTM E 1316. “Standard terminology for nondestructive examinations”. West Conshohocken, PA: ASTM International, 2006.
7. Kaphle, M. “Analysis of acoustic emission data for accurate damage assessment for structural health monitoring application”. Doctoral thesis. Queensland University of Technology, 2012.
8. Kaiser, J. “A study of acoustic phenomena in tensile tests”. Doctoral thesis. Technical University of Munich, 1950.
9. Grandt, A. F. Jr. “Fundamentals of structural integrity: Damage tolerent design and nondestructive evaluation”. Hoboken, NJ: John Wiley & Sons, 2004.
10.Hadzor, T.J, Barnes, R.W., Ziehl, P.H., Xu, J. and Schindler, A.K. “Development of acoustic emission evaluation method for repaired prestressed concrete bridge girders”. Alabama Department of Transportation, FHWA/ALDOT 930-601-1, 2011.
11.Fowler, T.J., Blessing, J.A. and Conlisk, P.J. “New direction in testing”. In Third International Symposium on Acoustic Emission from Composite Materials AECM-3, Paris, France, July 1989, 16–27. Paris, France, 1989. American Society for Nondestructive Testing, 1989.
12.Pollock, A.A. “Inspecting bridges with acoustic emission—inspection details about in-service steel bridges and monitoring weld operations: application guidelines”. Princeton Junction, NJ: Physical Acoustics Corporation, 1995.
13.McBride, S.L. and Maclachlan, J.W. “Acoustic emission due to crack growth, crack face rubbing and structural noise in the CC-130 Hercules aircraft”. Review of Progress in Quantitative NDE, 3b, 717-727, 1984.
14.Yuyuma, S., Okamoto, T., Shigeishi, M., Ohsu, M. and Kishi, T. “A proposed standard for evaluating structural integrity of Reinforced Concrete Beams by Acoustic emission”. Acoustic emission: Standards and Technology update, ASTM STP 1353, S.J. Vahaviolos, Ed., West Conshohocken, PA: ASTM International, 1999.
15.Ohtsu, M., Uchida, M., Okamoto, T. and Yuyama, S. “Damage assessment of reinforced concrete beams qualified by acoustic emission”. ACI Structural Journal 99 (4): 411–417, 2002.
emission and cyclic load test methods”. ACI Structural Journal 106(3):288–299, 2009.
17.Su, J., Bloodworth, A.G. and Haig, B. “Experimental investigation into the interface properties of composite concrete lined structures". Underground: The Way to the Future. Proceedings of World Tunnel Congress 2013 Abingdon, UK, 1518 - 1525. CRC Press, 2013.
![Figure 1 Theory of acoustic emission [4]](https://thumb-us.123doks.com/thumbv2/123dok_us/9552075.460015/3.595.181.432.209.363/figure-theory-of-acoustic-emission.webp)
![Figure 2 Parameters of a typical AE signal [7]](https://thumb-us.123doks.com/thumbv2/123dok_us/9552075.460015/4.595.204.397.573.745/figure-parameters-of-a-typical-ae-signal.webp)
![Figure 3 Kaiser and Felicity effects [9]](https://thumb-us.123doks.com/thumbv2/123dok_us/9552075.460015/5.595.216.392.457.649/figure-kaiser-and-felicity-effects.webp)
![Figure 4 NDIS-2421damage classification chart [15]](https://thumb-us.123doks.com/thumbv2/123dok_us/9552075.460015/6.595.193.414.520.680/figure-ndis-damage-classification-chart.webp)