http://wrap.warwick.ac.uk/
Original citation:
Sugden, Robert, Zheng, Jiwei and Zizzo, Daniel John. (2013) Not all anchors are
created equal. Journal of Economic Psychology, Volume 39. pp. 21-31.
Permanent WRAP url:
http://wrap.warwick.ac.uk/68389
Copyright and reuse:
The Warwick Research Archive Portal (WRAP) makes this work of researchers of the
University of Warwick available open access under the following conditions.
This article is made available under the Creative Commons Attribution- 3.0 Unported
(CC BY NC ND 3.0) license and may be reused according to the conditions of the
license. For more details http://creativecommons.org/licenses/by-nc-nd/3.0/
A note on versions:
The version presented in WRAP is the published version, or, version of record, and may
be cited as it appears here.
Not all anchors are created equal
Robert Sugden
⇑, Jiwei Zheng, Daniel John Zizzo
Centre for Behavioural and Experimental Social Science, Centre for Competition Policy, and School of Economics, University of East Anglia, Norwich NR4 7TJ, UK
a r t i c l e
i n f o
Article history:
Received 22 December 2012 Received in revised form 21 June 2013 Accepted 30 June 2013
Available online 9 July 2013
JEL classification: C91
D03 D12
PsycINFO classification: 2340
3920
Keywords: Anchoring effect Endowment effect
a b s t r a c t
We investigate the effects of a range of different types of anchor on WTP and WTA valua-tions of familiar consumer products, elicited through individuals’ buying or selling deci-sions at given prices. We find anchoring effects only when the anchor value is framed as a plausible price for the good for which the individual is a potential buyer or seller. Anchor-ing effects are stronger for WTA than for WTP. We conclude that anchorAnchor-ing effects can affect market behaviour, but that not all anchors are effective.
Ó2013 The Authors. Published by Elsevier B.V.
1. Introduction
There is now a substantial body of experimental evidence supporting the hypothesis that individuals’ reported valuations of goods can be affected byanchors– that is, non-informative numerical cues (e.g.,Ariely, Loewenstein, & Prelec, 2003; Mazar, Koszegi, & Ariely, 2010; Tufano, 2010; Alevy, Landry, & List, 2011; Fudenberg, Levine, & Maniadis, 2012). In a typical experiment, each subject is first asked whether she would buy (or sell) a specific good at a stated price that is clearly arbi-trary, and then is asked to state her maximum willingness-to-pay (WTP) or minimum willingness-to-accept (WTA) for that good; the usual finding is that valuations are positively correlated with the arbitrary ‘anchor’ price. Taken at face value, these findings may have important implications for the efficiency of retail markets, for two reasons. First, if individuals’ purchasing decisions can be influenced by irrelevant anchors, firms may be able to use related mechanisms to manipulate those deci-sions to the detriment of consumers. Second, many policies aimed at ensuring the competitiveness of retail markets rely on consumers’ ability to find the lowest prices; the existence of anchoring effects raises doubts about the effectiveness of this mechanism.
However, most of the evidence of anchoring effects on economic valuations has been derived from a narrow class of experimental designs which may not be representative of real-world interactions between firms and consumers. With a
0167-4870Ó2013 The Authors. Published by Elsevier B.V. http://dx.doi.org/10.1016/j.joep.2013.06.008
⇑Corresponding author. Tel.: +44 1603593423.
E-mail addresses:[email protected](R. Sugden),[email protected](J. Zheng),[email protected](D.J. Zizzo).
Contents lists available atSciVerse ScienceDirect
Journal of Economic Psychology
j o u r n a l h o m e p a g e : w w w . e l s e v i e r . c o m / l o c a t e / j o e p
Open access under CC BY-NC-ND license.
few exceptions, these experiments have investigated only one type of anchor, and this type may not be the best model of the opportunities for manipulation that are open to firms. Theory and evidence from psychology suggest that anchoring effects – and hence the scope for failures of price competition – might be much more general than those on which economists have focused. Furthermore, most experiments have used an ‘open-ended’ method of eliciting valuations which is not typical of retail markets and which may be particularly susceptible to anchoring effects.
In this paper we report an experiment which investigates the effects of a range of different types of anchor on WTP and WTA valuations, elicited through individuals’ buying or selling decisions at given prices. A further feature of our experiment is that it allows us to compare the strength of anchoring effects on buyers and sellers. Since consumers act as buyers in most retail markets, differences between the susceptibility of buyers and sellers to anchoring effects are relevant in assessing the impact of these effects on competition and consumer welfare. To date, there have been few such direct comparisons, and these have generated conflicting results.
Section2reviews the existing evidence of anchoring effects on economic valuations, drawing attention to some of its limitations. Section3identifies four dimensions on which anchors can vary, and discusses theoretical reasons for expect-ing variation along these dimensions to affect the strength of anchorexpect-ing effects. Section 4 describes the experimental design we use to investigate these forms of variation. Our results are presented in Section5. Their implications are dis-cussed in Section6.
2. Anchoring effects for valuations: existing evidence
The hypothesis that judgements can be subject to anchoring effects was proposed bySlovic and Lichtenstein (1968)as an explanation of ‘preference reversal’ between choices and relative valuations. It was later used byTversky and Kahneman (1974)in a more general account of heuristics and biases in judgements under uncertainty. (Viewed in a psychological per-spective, valuation is a special case of judgement.) The first direct experimental investigation of anchoring effects on valu-ations of commodities was byJohnson and Schkade (1989), who studied the effects of anchors on certainty-equivalent valuations of lotteries. That experiment was not incentivized, but in other respects it pioneered what is now the most widely-used experimental design for investigating anchoring effects on valuations.
Thiscanonical designhas been used in relation to both WTP and WTA; for simplicity, we will describe the WTP version.
Each subject first faces ananchoring taskin which she is asked whether she would buy a specific commodity at a stated price. Usually, this price is fixed by some mechanism that is clearly arbitrary (for example, it is constructed from the digits of the subject’s social security number, or set by a random device), but in some experiments the price is simply stated with no explanation of its origin. The subject then faces avaluation taskwhich elicits the highest price at which she would buy the same commodity. Usually the elicitation mechanism isopen-ended(i.e. the subject simply states her highest price), but sometimes it usesmultiple binary choice(i.e. the subject states whether she would buy at each of a set of alternative prices, and her WTP valuation is inferred from those choices). The valuation task is incentivized, either by the Becker– DeGroot–Marschak (BDM) mechanism or by treating subjects’ responses as bids in a Vickrey auction. Usually, but not always, the anchoring task is also incentivized. This design has been used with many different commodities, including stan-dard consumer products, lotteries, sportscards, and unpleasant sounds and tastes (e.g.,Ariely et al., 2003; Bateman, Munro, Rhodes, Starmer, & Sugden, 2006; Bergman, Ellingsen, Johannesson, & Svensson, 2010; Mazar et al., 2010; Tufano, 2010; Alevy et al., 2011; Fudenberg et al., 2012). Many but not all implementations of the canonical design have found significant positive relationships between reported valuations and anchor prices (the experiments of Bateman et al., Tufano, and Fudenberg et al. are exceptions).
In a variant design, the anchor is framed as a price expectation. In an experiment reported byIsoni, Brooks, Loomes, and Sugden (2011), the valuation task is incentivized by a median-price Vickrey auction; the anchoring task asks subjects to pre-dict the price that will emerge in this auction, and different questionnaire designs are used to prompt high or low predic-tions.Mazar et al. (2010)report an experiment in which the anchoring manipulation is to tell subjects the distribution of prices that will be used in the BDM mechanism that incentivizes the valuation task; left-skewed and right-skewed distribu-tions respectively generate low and high price expectadistribu-tions. Both experiments find significant anchoring effects. Anchoring effects induced by the manipulation of price expectations are closely related toshaping effects– the tendency for bids and asks in repeated incentive-compatible auctions to be positively correlated with previously-observed prices (Loomes, Starm-er, & Sugden, 2003; Tufano, 2010; Isoni et al., 2011).
Another under-investigated issue is whether the strength of anchoring effects differs according to whether valuations are elicited from buyers or sellers.Simonson and Drolet (2004, Study 1) report a non-incentivized experiment in which anchoring effects were stronger in buying tasks.Fudenberg et al. (2012)use a design that allows comparisons between buying and selling. In almost all the cases they investigate, anchoring effects are not significant, but the summary sta-tistics suggest (contrary to Simonson and Drolet’s findings) that if anchoring does occur, its effects are stronger in selling tasks.
3. Anchoring effects for valuations: issues to be investigated
Our experiment was designed to investigate, in incentivized valuation tasks, the relative strengths of anchoring effects for different types of anchor, and between buying and selling tasks. We focus on four specific dimensions of anchoring: the plau-sibilityof anchor values, therelevanceof the anchor task to the valuation task, the subject’sengagementin the anchoring task, and whether the valuation task was one ofbuying or selling. In this Section, we consider theoretical arguments from psychol-ogy and economics concerning the effects of variation along these dimensions. We must emphasise, however, that it is not the purpose of our experiment todiscriminate betweenthe theories we will discuss. With respect to the issues we are inves-tigating, the predictions of those theories often overlap.
3.1. Plausibility
It is natural to ask whether anchors are more effective, the more plausible they are as answers to the corresponding judgement tasks. One reason for thinking that this might be the case is provided by the hypothesis that experimental sub-jects are influenced by theconversational normsthat apply in ordinary social situations and by the inferences that those norms license (Grice, 1975; Schwarz, 1994). Consciously or unconsciously, subjects may assume that the experimenter would not have presented an anchor unless it was informative, and so treat it as such. Thus, for example, the anchor question ‘Would you buy goodAat price £x?’ is interpreted as implying that £xis a normal or reasonable price forA. It seems unlikely that that inference would be made if the supposition of an £xprice was wholly implausible.
A related mechanism is implied by the hypothesis ofbad-deal aversion(Thaler, 1985; Isoni, 2011). An individual who is bad-deal averse uses prices as reference points, and derives disutility (respectively: utility) from trading at prices that are less (more) favourable to her than those reference points. Preferences of this kind induce anchoring effects if anchors are treated as reference prices for the good used in the valuation task. One might expect this mechanism to depend on the plau-sibility of the anchor price.
A different reason for expecting more plausible anchors to have stronger effects is offered by the psychological theory ofselective accessibility(Mussweiler & Strack, 1999; Mussweiler & Strack, 2001). This theory proposes that an anchor task activates items of knowledge that are relevant for that task; if immediately afterwards the subject faces a judgement task, those items are particularly accessible and so have a disproportionate effect on her response. A similar hypothesis was previously proposed by Jacowitz and Kahneman (1995)to explain the observation that responses to dichotomous judgement tasks (e.g., ‘Is the height of Mount Everest more than 10,000 metres?’) are biased by the anchors provided by those tasks (10,000 m in the example). One apparent implication is that the more obvious the answer to the anchor task is, and so the less need there is to access knowledge in answering it, the less effect the anchor will have on the subsequent valuation task. Thus, implausibly high or implausibly low anchor prices should have relatively weak effects.
3.2. Relevance
In the canonical design, the anchoring task requires the subject to consider an arbitrary buying or selling price for the
samecommodity as is featured in the valuation task. An obvious question is whether this condition is necessary for anchor-ing effects to occur or, more generally, whether the strength of anchoranchor-ing effects is affected by the relevance of the anchor task to the valuation task.
The explanations of anchoring considered in the previous subsection also provide reasons why anchoring effects should be stronger when anchors are more relevant. If the anchor question is about buyinggood Aat a price of £xbut the valuation task is about WTP forgood B, conversational norms do not give obvious support to the inference that £xis a normal, reason-able or reference price for goodB. If this inference is not made, bad-deal aversion also does not come into play. The selective accessibility hypothesis implies that the strength of anchoring effects will depend on the degree of overlap between the knowledge requirements of the anchor and valuation tasks. Thus, one might expect anchoring effects to be stronger, the greater the relevance of the anchoring task to the judgement task.
However, some striking evidence suggesting that wholly irrelevant cues can work as anchors comes from the basic
anchoringeffects reported byWilson, Houston, Etling, and Brekke (1996). In a typical design, the anchoring task requires
need to give a numerical answer to a question triggers a search for possible answers, and numbers in short-term memory, even if unrelated to the task at hand, are then retrieved. A similar hypothesis was earlier proposed bySlovic and Lichtenstein (1968) as an explanation of anchoring effects in preference reversal tasks; Slovic and Lichtenstein’s hypothesis is that the money value of the prize in a lottery acts as an anchor for a task which elicits a valuation of that lottery.
3.3. Engagement
The selective accessibility and backward priming hypotheses explain anchoring as a side-effect of psychological processes for storing and retrieving items in memory. In the performance of the anchor task, particular pieces of knowledge are ac-cessed, or particular numbers are stored in short-term memory. These items are then selectively retrieved in the valuation task. So, if either of these hypotheses were correct, it would be natural to expect the strength of anchoring effects to depend on the extent of the subject’s engagement with the anchor task (Wilson et al., 1996).
For example, if incentivization of a task increases subjects’ engagement with it, memories associated with the anchor task might be more retrievable in designs in which that task is incentivized. Another possibility is that the memory of the anchor value might be more retrievable, the more the subject had been involved in the process (however arbitrary) in which that value was determined. For example, a subject has more mental engagement with an anchor value that she is required to construct from certain digits of her social security number than with one that is simply stated by the experimenter.
3.4. Buying or selling
The possibility of anchoring effects seems to depend on some degree of imprecision in subjects’ ‘true’ valuations. One might therefore conjecture that anchoring effects would be weaker, the more experience subjects had had in making judge-ments similar to those elicited in the valuation task. Most people have much more experience of buying low-value consumer goods, such as those used in our experiment, than of selling them. Thus, a typical subject comes to the laboratory with a firmer sense of how to respond to given prices when acting as a buyer than when acting as a seller; as a result, WTP might be subject to less imprecision than is WTA, and less susceptible to the effects of arbitrary cues.
The results reported bySimonson and Drolet (2004, Study 1), referred to in Section2, may seem to provide evidence against this conjecture. However, the framing of Simonson and Drolet’s non-incentivized WTA task asked subjects ‘to assume that they had received new products as gifts and had decided to sell them’. Since this frame suggests that the products are unwanted and that the subject has already decided to dispose of them, it seems unlikely to induce the sense of endowment typical of incentivized WTA tasks (which may explain the very unusual result that WTA wasless thanWTP). If the subject can assume that the products are unwanted, she has no need to consider what they are ‘really’ worth to her, and so the problem of preference imprecision does not arise.
4. Experimental design
4.1. Overview
The experiment had separate buying and selling treatments, faced by different subjects. The buying treatment elicited WTP valuations for a range of consumption goods and lotteries (thetrading commodities); the selling treatment elicited WTA valuations for the same commodities. In each treatment, each subject faced eleven tasks in random order, presented on a computer screen. Ten of these tasks had the two-part structure of the canonical design. The first part of such a task was a question that was framed to provide a potential anchor value. Different tasks used different types of anchor, differen-tiated in terms of plausibility, relevance and engagement. The eleventh task, used as a control, differed from the others in that its first part was a ‘filler’ question with no anchoring significance. The second part of each task elicited the relevant valuation.
The ten non-control tasks faced by any given subject can be grouped into five pairs. (This pairing was not described explicitly to subjects; because of randomization, the two tasks in a pair were usually not adjacent to one another.) In any given pair, the two tasks were identical except that one task provided a relatively low anchor value while the other provided a relatively high one. Thus, our design allows within-subject tests of the existence and size of anchoring effects, in both buy-ing and sellbuy-ing, for each anchor type.
effects due to differences between anchor types were not confounded with effects due to differences between commodities, anchor types and commodities were counterbalanced.
Because each subject faced eleven tasks rather than just one, we were able to collect a rich body of data and to use within-subject tests. The downside of this design strategy is that the anchor used in one task might influence the valuations reported by subjects in later tasks. If such contamination were to occur, it would add noise to the data. However, because the order of tasks was randomized, it would not impart systematic biases to our tests.
4.2. Anchor types
The first part of each non-control task was acomparative questionrelating to ananchor commodity. Depending on the an-chor type, this might or might not be the same as the trading commodity. UsingAto denote the anchor commodity and £xto denote an amount of money, the comparative question took the form ‘If you hadA, would you sell yourAif we offered you £x?’ (in the selling mode) or ‘If you had £12, would you buyAif you had to pay £x?’ (in the buying mode). Thus, the subject was prompted to focus on theanchor value x. In the control task, the comparative question ‘Do you like dogs more than cats?’ was used as a filler. We will say that the control task had theno lab anchortype. (We use this term to signal that the ‘anchor value’ provided by the experiment is not the only value that a subject might retrieve from memory when reporting her val-uation of the trading commodity.)
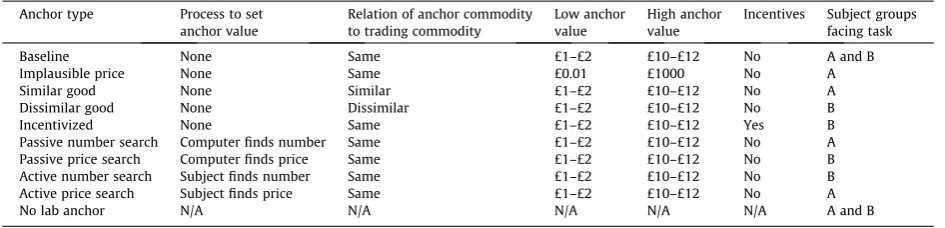
The anchor types used in the experiment, and the subject groups to which they were assigned, are described in
Table 1. The first row of this table describes the baselineanchor type, which is similar to that of the canonical design. When this anchor type was used, the subject’s first exposure to the anchor value was when it appeared in the compar-ative question (indicated by ‘none’ in the ‘process to set anchor value’ column). The anchor commodity was the same as the trading commodity. The low anchor value was drawn at random from the interval from £1 to £2; the high anchor value was drawn at random from the interval from £10 to £12. High and low anchor values were both intended to be perceived as plausible prices or valuations. The baseline comparative question was not incentivized. This was for reasons of external validity. Outside the lab, an anchoring manipulation is typically a way of framing a given decision problem (as when a supermarket prices a product at £6.95, with the label ‘Special offer! Normal price £9.95’); the frame does not have an incentive structure independent of that problem. The entry in the final column indicates that the baseline anchor type was faced by both subject groups. By making two anchor types common to both groups, we were able to check that the randomization was effective and that the particular assignment of anchor types to groups was not inducing systematic effects. In fact, there was no significant difference in WTA or WTP valuations for the common tasks between the two groups.
The other anchor types differed from the baseline in the following ways.
Theimplausible priceanchor type was used to investigate the effect of variation along the dimension of plausibility. In this anchor type, the low anchor value was £0.01 and the high anchor value was £1000. We assumed that such extreme values would not be perceived as providing information about (or reference points for) responses to the trading questions in part 2. Thesimilar goodanddissimilar goodanchor types were used to investigate the effect of variation along the dimension of relevance. In these anchor types, the anchor commodity was not the same as the trading commodity, but was approximately equal in market value. In thesimilar goodcase, the two goods were chosen so that individuals’ ‘true’ valuations of the com-modities were likely to be positively correlated. In thedissimilar goodcase, the two commodities were unrelated to one an-other (see Section4.4).
Theincentivizedanchor type was used to investigate the effect of one form of engagement. In this anchor type, the
com-parative question was incentivized in the same way as the trading questions (see Section4.5).
The final four non-control anchor types were used to investigate a different form of engagement – involvement in the determination of the anchor value. In each of these anchor types, the comparative task was preceded by amatrix problem, whose solution determined the anchor value. In the twoprice searchanchor types, the subject was shown an 88 matrix of monetary values, described as ‘prices’. These values were determined randomly, subject to the constraint that the lowest value was in the range from £1 to £2 (for low anchor tasks) or from £10 to £12 (for high anchor tasks). In the twonumber
searchanchor types, the only difference was that the entries in the matrix were dimensionless numbers. (Thus, for example,
the ‘number’ 1.45 was shown instead of the ‘price’ £1.45.) In the twoactiveanchor types, the subject was asked to find the lowest price (or number) in the matrix and to type it into a blank space on the screen. (If the response was incorrect, the subject was prompted to try again.) This (or the corresponding) price then became the anchor value for the comparative question.
The final row ofTable 1describes theno lab anchorcontrol, which was faced by both subject groups.
4.3. The elicitation of WTA and WTP
to these questions located her WTA or WTP within a £0.50 band (or revealed that valuation to be less than £0.01 or greater than £12.00).1
Notice that this design elicits valuations by multiple binary choices rather than by a single open-ended question. We used this elicitation method for three reasons. First, ‘Would you pay £x forT?’ is cognitively simpler than ‘What is the highest price you would pay forT?’ and so less likely to induce confusion. Second, the multiple binary choice format can be linked to the BDM mechanism by telling subjects that one binary choice will be selected at random to be ‘real’. This presentation makes the incentive-compatibility of the mechanism more transparent than when valuations are open-ended. Third, most retail transactions take place at take-it-or-leave-it prices; cases (such as sealed-bid auctions) in which consumers record open-ended valuations or bids are much rarer. Thus, in the context of retail markets, the multiple binary choice format has greater external validity.
As we noted in Section2, there is some evidence that anchoring effects are weaker when valuations are elicited by binary choices. One possible explanation is that the greater transparency of this method allows subjects to be more con-fident in their responses and so less susceptible to irrelevant cues. An alternative explanation is compatible with the hypothesis of backward priming. Binary choice questions require yes/no answers while open-ended valuation questions require numerical answers. Thus, numbers in memory are more likely to be accessed when subjects are dealing with open-ended questions.
4.4. Trading and anchor commodities
Six different trading commodities were used in the experiment: a lottery in which all the prizes were positive, which we called a ‘win–win gamble’; five National Lottery scratch cards; two bottles of Chinese sauce; a box of chocolates; a bath to-wel; and a luxury pen. The win–win gamble gave the prizes £15.53, £3.08 and £0.01 with probabilities 0.3, 0.5 and 0.2, respectively; its expected value was £6.20. The other commodities had market prices in the range from £4.50 to £5.10. (Mul-tiple items, such as five scratch cards, are treated as a single commodity.) In the ‘similar good’ tasks, the corresponding an-chor commodities were respectively: a different win–win gamble with approximately the same expected value; five National Lottery scratch cards of a different type; three bottles of Thai sauce; a box of a different type of chocolates produced by the same firm; five face cloths; and a different type of pen. In the ‘dissimilar good’ tasks, the anchor commodity was an iTune coupon.
4.5. Incentives
[image:7.544.40.513.73.187.2]At the end of the experiment the computer picked one of the eleven tasks at random. If the anchor type of that task was not ‘incentivized’, the computer then picked one of the 25 trading questions for that task. What the subject took away from the experiment was determined by her response to that task. In a selling task, if the subject had declared her willingness to sell the trading commodity at the £xprice of the relevant trading question, she received £x; otherwise, she received the com-modity. In a buying task, if the subject had declared her willingness to buy at the £xprice, she received the commodity and £(12 x); otherwise, she received £12. If the subject received a win–win gamble, it was resolved by the computer, using a random-number generator. If the anchor type of the task picked was ‘incentivized’, the computer then randomly picked either the first or second part of that task. Depending on which part was picked, the subject’s earnings were determined either by her response to the comparative question or by her response to one of the 25 trading questions.
Table 1 Anchor types.
Anchor type Process to set
anchor value
Relation of anchor commodity to trading commodity
Low anchor value
High anchor value
Incentives Subject groups facing task
Baseline None Same £1–£2 £10–£12 No A and B
Implausible price None Same £0.01 £1000 No A
Similar good None Similar £1–£2 £10–£12 No A
Dissimilar good None Dissimilar £1–£2 £10–£12 No B
Incentivized None Same £1–£2 £10–£12 Yes B
Passive number search Computer finds number Same £1–£2 £10–£12 No A
Passive price search Computer finds price Same £1–£2 £10–£12 No B
Active number search Subject finds number Same £1–£2 £10–£12 No B
Active price search Subject finds price Same £1–£2 £10–£12 No A
No lab anchor N/A N/A N/A N/A N/A A and B
1
5. Results
5.1. Summary statistics and aggregated tests
[image:8.544.38.513.74.130.2]The experiment was conducted at the Centre for Behavioural and Experimental Social Science (CBESS) Laboratory at the University of East Anglia in Spring 2011. Subjects were recruited using a campus-wide online system. There were 228 sub-jects, 108 in the selling treatment and 120 in the buying treatment. Most of the subjects were students, from a wide range of academic disciplines and with an age range from 19 to 47. The experiment lasted around 45 min with an average payment of £10.73 per person, in addition to commodities that subjects took away from the experiment.
Table 2reports means and standard errors of WTA and WTP, averaging over all anchor types and all commodities, broken down according to whether there was no lab anchor, a low value anchor or a high value anchor.2In calculating standard er-rors, we treat subjects as the units of observation; for each subject, we observe the mean of WTA or WTP across the relevant tasks. Recall that each subject reported five ‘low anchor’ and five ‘high anchor’ valuations, but only one ‘no lab anchor’ valuation. Thus, there is more noise in the data for ‘no lab anchor’ data than in those for high or low anchors.
In both selling and buying contexts, high-anchor valuations are greater than low-anchor valuations. The relative (and still more, the absolute) magnitude of the anchoring effect is greater in the selling context, where high-anchor valuations are 11 per cent greater than low-anchor valuations, than in the buying context, where the corresponding measure is 7 per cent. To test for the significance of these differences, we use Wilcoxon signed-rank tests, applied to ‘observations’ as defined above. (Throughout the paper, all within-subject tests are of this type. For between-subject comparisons we use Mann–Whitney tests.) In both cases, the anchoring effect is significant (z= 5.279,p< 0.001 for WTA,z= 2.024,p= 0.043 for WTP).
In the selling context, mean low-anchor and high-anchor WTA (£4.91 and £5.43, respectively) are well above the range of low anchor values (the highest of which was £2) and well below the range of high anchor values (the lowest of which was £10). The implication is that, in general, WTA was pulled up by high anchors and/or pulled down by low anchors. This is consistent with the observation that the mean of ‘no lab anchor’ WTA (£5.01) lies between the high- and low-anchor means.
Table 2
WTA and WTP means and standard errors.
No lab anchor Low anchor High anchor
WTA 5.01 4.91 5.43
(0.31) (0.23) (0.25)
WTP 1.62 1.45 1.56
(0.18) (0.11) (0.12)
[image:8.544.38.507.183.326.2]Note: 108 observations for WTA, 120 observations for WTP. Valuations are in £. Numbers in brackets are standard errors.
Table 3
WTA and WTP means and standard errors by commodity.
Commodity WTA WTP
Low anchor (90 observations)
High anchor (90 observations)
Low anchor (100 observations)
High anchor (100 observations)
Win–win gamble 5.91 6.30 2.15 2.22
(0.31) (0.34) (0.22) (0.21)
Two bottles of 3.82 4.51 0.82 0.98
Chinese sauce (0.30) (0.34) (0.11) (0.12)
Box of chocolate 5.56 6.19 1.58 1.76
(0.31) (0.32) (0.14) (0.16)
Towel 4.84 5.24 1.57 1.61
(0.30) (0.31) (0.19) (0.20)
Pen 3.37 3.95 0.54 0.58
(0.31) (0.35) (0.08) (0.10)
Five National Lottery scratch cards 5.96 6.41 2.04 2.19
(0.34) (0.35) (0.21) (0.23)
Note: Numbers in brackets are standard errors.
2
‘No lab anchor’ WTA valuations are significantly less than high-anchor valuations (z= 2.127,p= 0.033), but not signifi-cantly different from low-anchor ones (z= 0.349,p= 0.727). It should be borne in mind that our Wilcoxon tests are less powerful when comparisons involve ‘no lab anchor’ valuations, because of the greater noise in those data. Nevertheless, our findings give some indication that the tendency for WTA valuations to be pulled up by high anchors may be stronger than the tendency for them to be pulled down by low ones – an asymmetry that has also been observed for shaping effects, and that is consistent with bad-deal aversion (Isoni et al., 2011).
In the buying context, mean low-anchor and high-anchor WTP (£1.45 and £1.56) both lie within the range of low anchor values, implying that there was little scope for WTP to be pulled down by low anchors, and hence that the observed anchor-ing effect was primarily due to the effect of high anchors. ‘No lab anchor’ WTP valuations are not significantly different either from high-anchor valuations (z= 0.475,p= 0.635) or from low-anchor ones (z= 0.007,p= 0.995) In the light of these high
p-values, the apparently surprising observation that ‘no lab anchor’ valuations have a higher mean (£1.62) than high-anchor valuations may reasonably be attributed to sampling error.
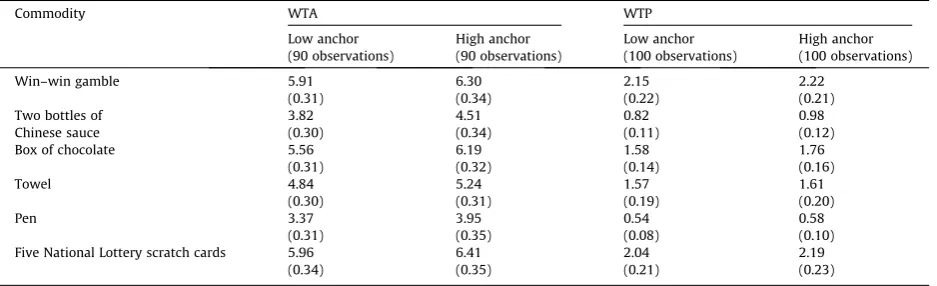
Table 3reports mean WTA and WTP valuations for high and low anchors, broken down by commodity but aggregated across anchor types. (We do not report ‘no lab anchor’ valuations at this level of disaggregation because sample sizes are small. For each commodity, there are only 18 observations of ‘no lab anchor’ WTA and only 20 of ‘no lab anchor’ WTP.)
[image:9.544.46.507.73.273.2]Standard errors are calculated using subjects as units of observation. For each commodity and for each valuation mode, the high-anchor mean is greater than the low-anchor mean, suggesting that anchoring effects are robust across different commodities.
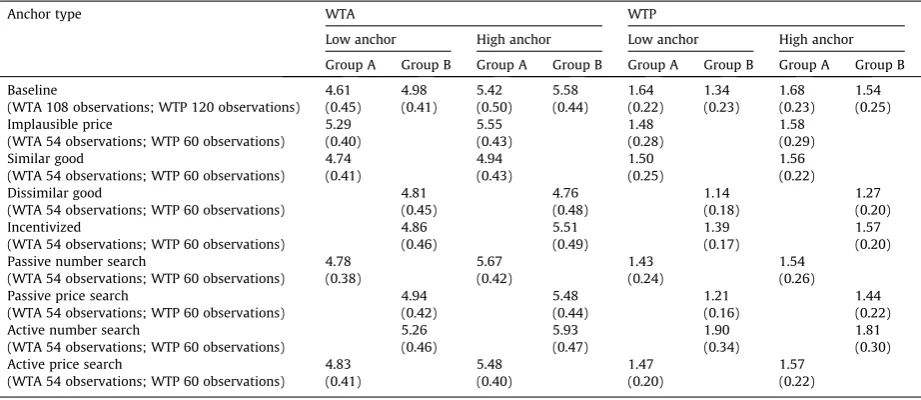
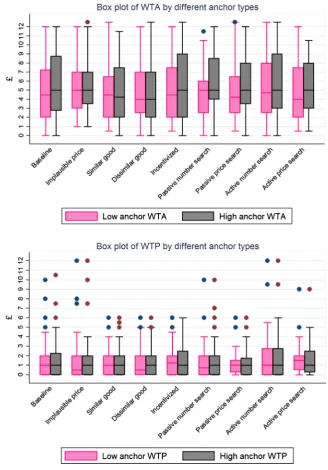
Table 4reports mean WTA and WTP valuations for high and low anchors, broken down by anchor type but aggregated across commodities. Again, standard errors are calculated at the subject level.Fig. 1shows box plots of WTA and WTP, using the same disaggregations. In the selling context, mean high-anchor WTA is higher than mean low-anchor WTA for eight of the nine anchor types (the exception being ‘dissimilar good’). In the buying context, mean high-anchor WTP is higher than mean low-anchor WTP for eight of the nine anchor types (the exception being ‘active number search’).
Unsurprisingly, WTA is consistently higher than WTP. Averaging over all commodities, all anchor types and all anchor values, WTA is £5.16 and WTP is £1.51. In interpreting these data, we must allow for the fact that £0.50 of the difference between our WTA and WTP measures is attributable to our elicitation procedure and accounting conventions (see footnote 2). However, after the measures have been made comparable by subtracting £0.25 from WTA and adding £0.25 to WTP, the ratio of WTA to WTP is 2.8, and the difference between the two is strongly significant (z= 10.302,p< 0.001). This finding agrees with many previous findings of WTA–WTP disparities (e.g.,Coursey, Hovis, & Schulze, 1987; Horowitz & McConnell, 2002).
5.2. Regression analysis
Table 4reports how valuations are affected by each anchor type when regressions are run to verify their effects.3In each
regression equation, the anchor type is fixed and the dependent variable is either WTA or WTP. Each of the reported coefficients
Table 4
WTA and WTP means and standard errors by anchor type.
Anchor type WTA WTP
Low anchor High anchor Low anchor High anchor
Group A Group B Group A Group B Group A Group B Group A Group B
Baseline 4.61 4.98 5.42 5.58 1.64 1.34 1.68 1.54
(WTA 108 observations; WTP 120 observations) (0.45) (0.41) (0.50) (0.44) (0.22) (0.23) (0.23) (0.25)
Implausible price 5.29 5.55 1.48 1.58
(WTA 54 observations; WTP 60 observations) (0.40) (0.43) (0.28) (0.29)
Similar good 4.74 4.94 1.50 1.56
(WTA 54 observations; WTP 60 observations) (0.41) (0.43) (0.25) (0.22)
Dissimilar good 4.81 4.76 1.14 1.27
(WTA 54 observations; WTP 60 observations) (0.45) (0.48) (0.18) (0.20)
Incentivized 4.86 5.51 1.39 1.57
(WTA 54 observations; WTP 60 observations) (0.46) (0.49) (0.17) (0.20)
Passive number search 4.78 5.67 1.43 1.54
(WTA 54 observations; WTP 60 observations) (0.38) (0.42) (0.24) (0.26)
Passive price search 4.94 5.48 1.21 1.44
(WTA 54 observations; WTP 60 observations) (0.42) (0.44) (0.16) (0.22)
Active number search 5.26 5.93 1.90 1.81
(WTA 54 observations; WTP 60 observations) (0.46) (0.47) (0.34) (0.30)
Active price search 4.83 5.48 1.47 1.57
(WTA 54 observations; WTP 60 observations) (0.41) (0.40) (0.20) (0.22)
Note: Numbers in brackets are standard errors.
3
is the key coefficient for an ‘anchor value’ dummy variable (equal to 1 when the anchor value is high and 0 when it is low) in a regression that also contained a period variable (between 1 and 11) to pick up any trends in responses over the course of the experiment, and fixed effects controlling for the commodity type. There was no significant trend in any of the WTA regressions. In a few of the WTP regressions, there was a significant downward trend in valuations. We tried adding a variable to pick up interaction between ‘anchor value’ and ‘period’, but this was not significant for either WTA or WTP.
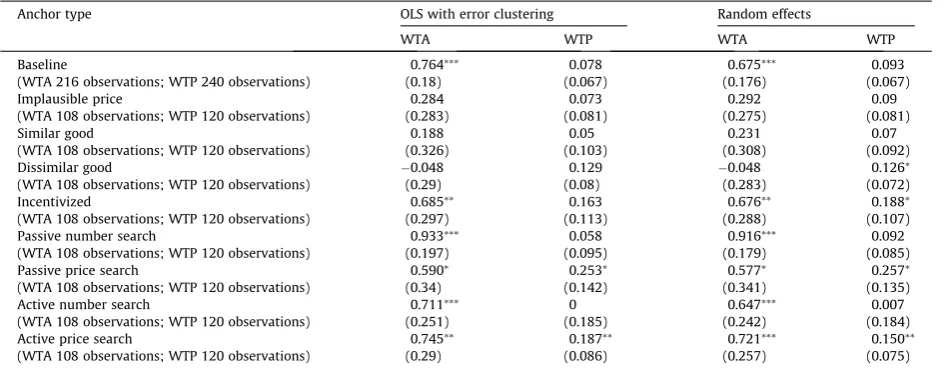
The results reported in the first two columns ofTable 5control for the potential non-independence of observations at the subject level by employing OLS regressions with error clustering. The results of using an alternative method of control, that of random effects regressions, is reported in the third and fourth columns.4The results of the two sets of regressions are very
[image:10.544.102.431.51.522.2]similar. In the rest of this section, we will refer to the OLS results.
Fig. 1.Willingness to accept (WTA) and to pay (WTP) for different anchor types.
4
In the selling context, there is clear evidence of an anchoring effect for the baseline anchor (t= 4.24,p< 0.001). Using the high anchor value rather than the low one increases WTA by £0.76 (approximately 15 per cent of the overall mean WTA). As explained in Section4.2, five of the anchor types can be interpreted as adding some additional element of engagement to the baseline task. The anchoring effect is statistically significant at least at the 10 per cent level in all of these cases (‘incentivized’
t= 2.31,p= 0.025; ‘passive number search’t= 4.74,p< 0.001; ‘passive price search’t= 1.74,p= 0.088; ‘active number search’
t= 2.83,p= 0.007; ‘active price search’t= 2.57,p= 0.013). However, there is no evidence that engagement systematically in-creases (or dein-creases) the size of the anchoring effect relative to the baseline case. There is no significant anchoring effect when anchor values are implausible, or when the anchor commodity is not the same as the trading commodity.
Result 1: In the selling context, anchors are effective in distorting behaviour if and only if the anchor takes the form of a plausible price for the trading commodity.
In the buying context, there is no significant anchoring effect in the baseline case. Given this result, it is unsurprising that there is also no significant effect when anchor values are implausible or when the anchor and trading commodities are dif-ferent. The only anchor type that is significant at the 5 per cent level is ‘active price search’ (t= 2.18,p= 0.033). In this case, using the high anchor value rather than the low one increases WTP by £0.19 (approximately 12 per cent of the overall mean WTP). ‘Passive price search’ is significant at the 10 per cent level (t= 1.79,p= 0.079). One possible interpretation of these results is that there are anchoring effects for WTP when the degree of engagement with anchor values is sufficiently great. An alternative interpretation is that the crucial property of ‘price search’ is not so much engagement by the subject in the construction of the anchor, as that the anchor value is framed as the lowest of an array of prices. Since ‘lowest’ is a salient feature of price for buyers, this framing draws attention to the anchor valueas a price, and so is particularly likely to prime conversational norms and/or bad-deal aversion. But however one interprets the significant coefficient for ‘active price search’, it is clear that anchoring effects are weaker for WTP than for WTA.
Result 2: Anchors are less effective in the buying context than in the selling context. There is some evidence that, in the buying context, anchoring effects occur when subjects are engaged with the construction of the anchor value and when that value is framed as a price of the trading commodity.
6. Discussion and conclusion
We conclude that anchoring effectscanaffect individual behaviour in incentivized tasks involving familiar consumer goods, but that not all anchors are effective.
[image:11.544.41.516.73.258.2]For some readers, the most striking feature of our results may be that the anchoring effects we find are relatively small. They are much smaller, for example, than those reported byAriely et al. (2003); and, as a glance atFig. 1shows, valuation disparities due to anchoring are far smaller than disparities between WTA and WTP. In this respect, however, our results are not outliers: as noted in Section1, several comparable studies have found anchoring effects to be small or even non-existent. But it should be remembered that our experiment was designed to allow controlled investigations of therelative effective-ness of different types of anchor and of therelativeeffectiveness of anchors in selling and buying contexts – not of the
Table 5
Anchor type coefficients in regressions on WTA and WTP.
Anchor type OLS with error clustering Random effects
WTA WTP WTA WTP
Baseline 0.764⁄⁄⁄
0.078 0.675⁄⁄⁄
0.093
(WTA 216 observations; WTP 240 observations) (0.18) (0.067) (0.176) (0.067)
Implausible price 0.284 0.073 0.292 0.09
(WTA 108 observations; WTP 120 observations) (0.283) (0.081) (0.275) (0.081)
Similar good 0.188 0.05 0.231 0.07
(WTA 108 observations; WTP 120 observations) (0.326) (0.103) (0.308) (0.092)
Dissimilar good 0.048 0.129 0.048 0.126⁄
(WTA 108 observations; WTP 120 observations) (0.29) (0.08) (0.283) (0.072)
Incentivized 0.685⁄⁄
0.163 0.676⁄⁄
0.188⁄
(WTA 108 observations; WTP 120 observations) (0.297) (0.113) (0.288) (0.107)
Passive number search 0.933⁄⁄⁄
0.058 0.916⁄⁄⁄
0.092
(WTA 108 observations; WTP 120 observations) (0.197) (0.095) (0.179) (0.085)
Passive price search 0.590⁄
0.253⁄
0.577⁄
0.257⁄
(WTA 108 observations; WTP 120 observations) (0.34) (0.142) (0.341) (0.135)
Active number search 0.711⁄⁄⁄
0 0.647⁄⁄⁄
0.007
(WTA 108 observations; WTP 120 observations) (0.251) (0.185) (0.242) (0.184)
Active price search 0.745⁄⁄ 0.187⁄⁄ 0.721⁄⁄⁄ 0.150⁄⁄
(WTA 108 observations; WTP 120 observations) (0.29) (0.086) (0.257) (0.075)
Note: Each coefficient is the ‘anchor type’ dummy coefficient in a regression controlling also for period and commodity type. Each dummy is equal to 1 when there is a high anchor, 0 with a low anchor. Numbers in brackets are standard errors. Clusters or random effects control for non-independence of observations at the subject level.⁄
=p< 0.1,⁄⁄
absolute effectiveness of anchors in general. In our experiment, each subject faced eleven tasks, each with its own set of trad-ing questions and its own anchor. It would not be surpristrad-ing if this feature of our design had some tendency to dampen the specific effects of individual anchors. Further, as explained in Section3.1, our method of eliciting valuations through binary choices is likely to induce weaker anchoring effects than the more usual (but, we have argued, less externally valid) method of open-ended questions. But these considerations do not affect the validity of comparisons across anchor types and across valuation modes.
The sharpest result of our experiment is that anchoring effects are stronger in the context of selling than in the context of buying. This result is consistent with the tentative finding ofFudenberg et al. (2012). One important implication of this result is that experiments that study anchoring effects in selling contexts are likely to overstate the significance of such effects in retail markets.
A second general finding is that anchoring effects are strongest when the anchor value is framed as a plausible price for the good for which the individual is a potential buyer or seller. In an incentivized design investigating trading decisions about familiar consumer products, we found no evidence of the ‘basic’ anchoring effects that have been observed for various kinds of non-economic judgements, and only weak evidence that the strength of anchoring effects is influenced by the extent of individuals’ engagement with the process by which arbitrary anchor values are constructed. This suggests that, in eco-nomic contexts, anchoring effects work primarily by suggesting that the (plausible) prices that are presented as anchors are in some way reasonable or normal, despite their arbitrariness. The implication is that consumers’ preferences are some-what less labile than the psychological literature might suggest. Nevertheless, that still leaves plenty of scope for firms to try to manipulate consumers’ perceptions of reasonable prices.
Acknowledgements
We thank the Economic and Social Research Council (ESRC; award no. RES-578-28-0002) and the University of East Anglia for financial support, Axel Sonntag for research assistance, participants at various presentations for useful advice, and an edi-tor and two anonymous referees for constructive comments. The experimental data are available in the online appendix.
Appendix A. Supplementary material
Supplementary data associated with this article can be found, in the online version, at http://dx.doi.org/10.1016/ j.joep.2013.06.008.
References
Alevy, J. E., Landry, C. E., & List, J. A. (2011). Field experiments on anchoring of economic valuations.Working Paper 2011-02, Department of Economics, University of Alaska Anchorage.
Ariely, D., Loewenstein, G., & Prelec, D. (2003). Coherent arbitrariness: Stable demand curves without stable preferences.Quarterly Journal of Economics, 118, 73–105.
Bateman, I., Munro, A., Rhodes, B., Starmer, C., & Sugden, R. (2006). Anchoring and yea-saying with private goods: An experiment. In J. List (Ed.),Using Experimental Methods in Environmental and Resource Economics(pp. 1–19). Northampton, MA: Edward Elgar.
Bergman, O., Ellingsen, T., Johannesson, M., & Svensson, C. (2010). Anchoring and cognitive ability.Economics Letters, 107, 66–68.
Coursey, D. L., Hovis, J. L., & Schulze, W. D. (1987). The disparity between willingness to accept and willingness to pay measures of value.Quarterly Journal of Economics, 102, 679–690.
Fudenberg, D., Levine, D. K., & Maniadis, Z. (2012). On the robustness of anchoring effects in WTP and WTA experiments.American Economic Journal – Microeconomics, 4, 131–145.
Grice, H. P. (1975). Logic and conversation. In P. Cole & J. L. Morgan (Eds.),Syntax and Semantics.Speech Acts(Vol. 3, pp. 41–58). New York: Academic Press. Horowitz, J. K., & McConnell, K. E. (2002). A review of WTA/WTP studies.Journal of Environmental Economics and Management, 44, 426–447.
Isoni, A. (2011). The willingness-to-accept/willingness-to-pay disparity in repeated markets: Loss aversion or ‘bad-deal’ aversion?Theory and Decision, 71, 409–430.
Isoni, A., Brooks, P., Loomes, G., & Sugden, R. (2011). Do markets reveal preferences – Or shape them?Working paper.
Jacowitz, K. E., & Kahneman, D. (1995). Measures of anchoring in estimation tasks.Personality and Social Psychology Bulletin, 21, 1161–1166. Johnson, E. J., & Schkade, D. A. (1989). Bias in utility assessments: Further evidence and explanations.Management Science, 35, 406–424. Loomes, G., Starmer, C., & Sugden, R. (2003). Do anomalies disappear in repeated markets?Economic Journal, 113, 153–166.
Mazar, N., Koszegi, B., & Ariely, D. (2010). Price-sensitive preferences.SSRN Discussion Paper.
Mussweiler, T., & Strack, F. (1999). Hypothesis-consistent testing and semantic priming in the anchoring paradigm: A selective accessibility model.Journal of Experimental Social Psychology, 35, 136–164.
Mussweiler, T., & Strack, F. (2001). The semantics of anchoring.Organizational Behavior and Human Decision Processes, 86, 234–255.
Schwarz, N. (1994). Judgement in social context: Biases, shortcomings, and the logic of conversation.Advances in Experimental Social Psychology, 26, 123–162.
Simonson, I., & Drolet, A. (2004). Anchoring effects on consumers’ willingness-to-pay and willingness-to-accept.Journal of Consumer Research, 31, 681–690. Slovic, P., & Lichtenstein, S. (1968). Relative importance of probabilities and payoffs in risk taking.Journal of Experimental Psychology, 78, 1–18. Thaler, R. H. (1985). Mental accounting and consumer choice.Marketing Science, 4, 199–214.
Tufano, F. (2010). Are ‘true’ preferences revealed in repeated markets? An experimental demonstration of context-dependent valuations’.Experimental Economics, 13, 1–13.
Tversky, A., & Kahneman, D. (1974). Judgement under uncertainty: Heuristics and biases.Science, 185, 1124–1131.