A Thesis Submitted for the Degree of PhD at the University of Warwick
Permanent WRAP URL:
http://wrap.warwick.ac.uk/102339/
Copyright and reuse:
This thesis is made available online and is protected by original copyright.
Please scroll down to view the document itself.
Please refer to the repository record for this item for information to help you to cite it.
Our policy information is available from the repository home page.
Institutional Investors and Hedge Fund Activism
by
Yazhou He
Thesis
Submitted to the University of Warwick
for the degree of
Doctor of Philosophy
Warwick Business School
Contents
List of Tables iv
List of Figures vi
Acknowledgments vii
Declarations viii
Abstract ix
Chapter 1 Introduction 1
Chapter 2 The selection of target companies 5
2.1 Introduction . . . 5
2.2 Literature review and hypotheses development . . . 9
2.2.1 Hedge fund activism . . . 9
2.2.2 Governance through holdings . . . 9
2.2.3 Active governance through trading . . . 10
2.2.4 Active governance through voice . . . 11
2.3 Data . . . 12
2.3.1 Hedge fund activism campaigns . . . 12
2.3.2 Institutional ownership . . . 13
2.4 Dissatisfied owners . . . 15
2.4.1 Measures . . . 15
2.4.2 Summary statistics of (dissatisfied) owners . . . 16
2.4.3 Regression results for dissatisfied owners . . . 19
2.5 Dissatisfied sellers . . . 23
2.5.1 Measures . . . 23
2.5.2 Summary statistics of (dissatisfied) sellers . . . 24
2.5.3 Regression results for dissatisfied sellers . . . 27
2.6 Different voices . . . 31
2.6.1 Measure . . . 31
2.6.2 Summary statistics of voices . . . 32
2.6.3 Regression results for different voices . . . 34
2.8 How dissatisfied owners affect campaigns cross-sectionally? . . . 40
2.8.1 Activists’ tactics . . . 40
2.8.2 Cross-sectional returns . . . 42
2.9 Evidence on support to activists from dissatisfied owners . . . 43
2.10 Summary . . . 46
Chapter 3 Social networks and information sharing in hedge fund activism 47 3.1 Introduction . . . 47
3.2 Data sources and sample overview . . . 51
3.2.1 Sample of activist campaigns . . . 51
3.2.2 Sample of social networks . . . 52
3.2.3 Institutional ownership and trading data . . . 54
3.2.4 Sample overview . . . 55
3.3 Social Networks and institutional trading . . . 57
3.3.1 Univariate analysis of quarterly ownership . . . 58
3.3.2 Changes in institutions’ quarterly ownership . . . 58
3.3.3 Robustness analyses . . . 60
3.3.4 Heterogeneity in social ties and activist quality . . . 64
3.3.5 Changes in quarterly ownership before the activist disclosure 65 3.3.6 Daily trades before the activist disclosure . . . 67
3.4 Returns on “Connected” Investment . . . 69
3.5 Potential benefits to the lead activist . . . 71
3.6 Summary . . . 73
Chapter 4 The benefits of friendship in hedge fund activism 74 4.1 Introduction . . . 74
4.2 Data sources and sample overview . . . 78
4.2.1 Sample of activist campaigns . . . 78
4.2.2 Sample of social networks . . . 78
4.2.3 Institutional ownership and trading data . . . 79
4.2.4 Institutional voting data . . . 80
4.2.5 Proxies for similarities between activists and institutions . . . 80
4.2.6 Sample overview . . . 81
4.3 Social networks and institutional trading . . . 85
4.3.1 Baseline results . . . 85
4.3.2 Identification using fund company M&As . . . 88
4.3.3 Returns on “connected” investment . . . 90
4.4 Social connections and shareholder voting . . . 91
4.4.1 Ownership changes and shareholder voting . . . 94
4.5 Robustness analysis . . . 96
4.5.1 Activist disclosure within 10 days after Quarter t−1 ends . . 96
4.5.2 The Abel Noser transaction sample . . . 97
4.5.3 Sensitivity to alternative specifications . . . 97
4.6 Summary . . . 98
Chapter 5 Conclusion 99
Appendix A Defining activist social ties 101
Appendix B Connected ownership 103
Appendix C Connected voting 105
Appendix D Connected portfolio allocation 107
Appendix E Social connections and changes in institutional
List of Tables
2.1 Characteristics of firm fundamentals . . . 14
2.2 Characteristics of institutional ownership . . . 17
2.3 Institutional owners and target selection . . . 20
2.4 Dissatisfied owners and target selection . . . 21
2.5 Characteristics of institutional sellers . . . 25
2.6 Institutional sellers and target selection . . . 28
2.7 Dissatisfied sellers and target selection . . . 30
2.8 Characteristics of institutional voice . . . 33
2.9 Institutional voice and target selection . . . 34
2.10 Institutional dissatisfaction and target selection . . . 37
2.11 Dissatisfied owners and activist’s tactics . . . 41
2.12 Dissatisfied owners and target firm returns . . . 43
2.13 Dissatisfied owners and voting . . . 45
3.1 Characteristics of firm fundamentals . . . 56
3.2 Network characteristics . . . 57
3.3 Univariate analysis of quarterly ownership . . . 58
3.4 Social connections and institutional trading . . . 59
3.5 Social connections and changes in institutional ownership . . . 61
3.6 Education connections and institutional trading . . . 62
3.7 Placebo test of social ties and institutional trading . . . 63
3.8 The heterogeneity in activist quality . . . 65
3.9 Institutional trading before the activist disclosure . . . 66
3.10 Changes in institutional ownership before the disclosure using trans-action data . . . 68
3.11 Social connections and institutions’ returns . . . 70
3.12 Social connections and activist campaign success . . . 72
4.1 Network characteristics . . . 82
4.2 Summary Statistics . . . 83
4.3 Social connections and changes in institutional ownership . . . 86
4.4 Fund company M&As and social connections . . . 89
4.8 Robustness analysis . . . 96
B.1 Social connections and changes in institutional ownership . . . 104
C.1 Social connections and shareholder voting during activist campaigns 106
D.1 Social connections and changes in institutional portfolio allocation . 107
List of Figures
2.1 Hedge fund campaigns from 2004 to 2014 . . . 12
3.1 Hedge fund campaigns from 2005 to 2014 . . . 52
3.2 An illustration of the event timeline . . . 54
4.1 An illustration of the event timeline . . . 79
Acknowledgments
I wish to take the limited space to express my gratitude to all my supervisors,
Professor April Klein, Doctor Tao Li, and Professor Richard Taffler, and everyone
in the finance group with whom I have spent four meaningful years with. The
accomplishment of the thesis will not be made possible without the support from
them, my families, friends, and especially my beloved fianc´e Mike.
Declarations
I declare that any material contained in this thesis has not been submitted for a
degree to any other university. I further declare that Chapters 3 of the this thesis
is a product of joint work with Dr. Tao Li. We jointly edited the texts while I
Abstract
This thesis studies the institutional investor background in order to under-stand the working of hedge fund activism: how institutional investors affect hedge fund activists target selection and how activists share information and build alliances through social connections to achieve their goals.
Chapter 2 utilizes a rich literature on institutional investors’ governance roles and develops simple measures of institutional discontent expressed through holding, trading and voice channels, to predict hedge fund activism target selection. Discon-tent expressed through all three channels leads to subsequent targeting. Medium sized dissatisfied owners and sellers seem to be the main driving force, and insti-tutions’ discretionary disagreements on management compensation and governance related proposals have the highest explanatory power among other voice channels. Activists are more likely to gain higher announcement returns and threaten to take hostile actions against management with more discontented institutional investors in the target companies. Discontented institutions are more likely to vote pro-activist in the subsequent annual meetings after campaigns.
Chapter 3 uses a social network framework to study information dissem-ination during activist campaigns. Actively managed funds whose managers are socially connected to the lead activist are more likely to increase their ownership in the target firms around the activist disclosure. In the cross sectional analysis, we find that the effect is stronger if the activists have better track records and if the ties are established via club membership, charity works, and other small circles. Connected institutions also earn significantly higher announcement returns relative to non-connected funds. The presence of connected institutions contributes to the activist’s campaign success. Additional tests are performed to rule out alternative explanations such as fund manager ability or similarity in portfolio choices.
are more likely to vote pro-activist in routine proposals, especially director election proposals. The effect is stronger if connected institutions also purchase target stocks during a campaign.
Chapter 1
Introduction
The playing field of corporate governance is ever-changing, from the merger waves in the eighties and nineties followed by the emergence of shareholder activism dom-inated by large mutual funds and pension funds, to today. The huge yet puzzling success of hedge fund activism fascinates both industry and academia, and raises concerns about the nature and the prevalence of agency problem embedded deep in the making of a firm. The phenomenon of hedge fund activism is a recent develop-ment in corporate governance, but there have already been debates on fundadevelop-mental issues such as activists’ real intentions, their effectiveness, and potential long term and external consequences. Nonetheless, the headline news of corporate battles, such as Icahn versus Herbalife, and Bill Ackmans’ loss of $4.6 billion dollars on Valeant, opens up windows for people to peep into the world of investing and gov-ernance. Regardless of the never ending debates on welfare, we have learnt once more about corporate governance, and to a large extent how it affects shareholder values from the hundreds of campaigns each year. But we know very little about the working of a campaign, how activists select target companies and how they gain supports from other shareholders. This thesis tries to understand how institutional investors matter in the case of target selection and alliance building by the hedge fund activists.
upon announcement, the share price of target companies jumps about 6% during the 20-day window (Brav, Jiang, Partnoy, and Thomas, 2008; Klein and Zur, 2009; Becht, Franks, Mayer, and Rossi, 2008; Clifford, 2008; Becht, Franks, Grant, and Wagner, 2015). Both Brav, Jiang, Partnoy, and Thomas (2008) and Klein and Zur (2009) have characterized targeted companies to be small and value stocks with a high concentration of institutional investors. There is a small body of litera-ture on the role of institutional investors and hedge fund activism. Gantchev and Jotikasthira (2016) found that institutional selling facilitates activist block build-ing and Appel, Gomley and Keim (2016) found that passive ownership influences campaign outcome. Wong (2016) documented excessive abnormal trading volumes before campaign announcements and suggested evidence related to the wolf pack activism theory built by Brav, Dasgupta, and Mathews (2016). A recent paper by Kedia, Starks and Wang (2016) proxies for pro-activist institutions using evidence on past voting and campaign support. Brav, Jiang, and Li (2017) estimate jointly how institutional investors vote in proxy contests and how activists target firms in proxy contests.
The fruitful research findings help us to understand the economics behind hedge fund activism. According to Shleifer and Vishny (1986), a large shareholder will not intervene as it bares all costs of the campaigns but only shares a fraction of the benefits. Only when the benefit exceeds the cost will the shareholder intervene. In chapter 2, we model the revealed governance preference of institutional investors based on Edmans (2009), Admati and Pfleiderer (2009), and McCahery, Sautner and Starks (2016), and proxy for institutional dissatisfaction by aggregating annual voting outcomes, ownerships that experience negative holding period returns, and exited ownerships due to poor holding period performances. We find that the re-vealed dissatisfaction of institutional shareholders can predict subsequent activism targeting on a quarterly frequency. A 1 percentage point institutional ownership exited due to loss increases the probability of subsequent targeting by 10 percent. Voice expressed by voting against management in routine compensation and gover-nance related proposals are more likely to predict subsequent targeting than other voice channels. With a dissatisfied shareholder base, the activists may face a lower cost of persuading shareholders to support them. In the cross sectional analysis of activism targets, we find activists are more likely to use the threat of a lawsuit and shareholder proposal when there are more dissatisfied owners. The higher the concentration of dissatisfied ownership, the higher the perceived success of activists based on announcement returns is. We further look for direct evidence to sup-port the conjecture that dissatisfied owners are more likely to supsup-port activist by investigating how the dissatisfied owners vote during the campaign year and find the institutions that experienced negative holding period returns up to campaign announcement are more likely to vote against management in subsequent annual voting in management sponsored proposals, and especially compensation related proposals.
goals. We find that institutions that are socially connected to the activist via their top personnel are more likely to increase their portfolio weights as well as owner-ship in target stocks around the campaign quarter. Social connections between the top personnel are established before the campaign quarter but remain active when both still serve top roles in their institutions. We strictly require that both the two personnel studied, worked, or belonged to the same organization in the past with an overlapped period of time as the establishment of a social tie, and present our results by separating institutions into mutual funds, non-activist hedge funds and non-campaign activists, and find that the results are similar in all three groups. A connection leads to the likelihood of increasing portfolio weights of target stocks by 2.9% percent while the unconditional probability for an increase in the target stock is 3.8%. In the cross sectional analysis, we find that the effect is stronger if the ac-tivists have better track records and if the ties are established via club membership, charity works, and other small circles. We rule out alternative explanations such as skills by separating ties established via elite school attendance, and in a placebo test on activists’ non-target stocks, we rule out similar investment styles and port-folio choices. We investigate institutional trading before public announcements of campaigns to look for evidence of information sharing between socially connected institutions, and both the quarterly 13F reports and Ancerno transaction data sup-port the information channel hypothesis. To investigate the economics behind our findings, we look for mutual benefits for both the activists and the institutions. We find that, on average, connected institutions earn monthly 1.56 percentage point higher returns on target stocks during a campaign quarter. More interestingly, we find that activists are more likely to succeed proxied by achieving at least one stated goal in their campaign, gaining board seats and earning higher announcement re-turns, in the presence of connected institutions. This chapter studies in detail how the activist may utilize the social connections among institutional investors as an information dissemination channel to build an alliance for their campaigns and such an alliance is based on mutual benefits. It is the first and only paper pinning down the exact channels of information sharing and alliance building.
insti-tutions subject to M&As before activism events, we find that a connected institution is 1.7 percentage points more likely to raise stakes in a target firm (the incremental probability is 47%). This is qualitatively similar to our main analysis. Connected institutions also perform significantly better on their investment than non-connected institutions, generating a risk-adjusted long-short portfolio return of 0.42% to 0.51% per month. Finally, we explore how higher success rates are achieved when target firms are held by more connected institutions. We find that connected institu-tions’ votes against management proposals (management-sponsored directors) are 0.9 (1.3) percentage points more than those by non-connected funds, representing an increase of 9% (13%) in the disapproval rate. Furthermore, connected institu-tions that purchase target stocks during a campaign are more likely to challenge management in shareholder meetings, which presumably will benefit them more if campaigns are successful. We also confirm that the effects exist only for meetings during activist campaigns, but not for meetings after outcome dates. The chapter studies specifically alliance building during the campaign period based on social ties among activists and institutional investors. It also utilizes mergers and acquisitions among financial institutions as exogenous shocks to social connections and connects institutional trading and voting during activism campaigns.
Chapter 2
The selection of target
companies
2.1
Introduction
Shareholder activism has seen its rises and falls in the past three decades and the landscape is rapidly changing, from the early corporate raiders who swept the board-rooms and dominated several M&A waves, to pension funds and mutual funds striv-ing for entrenched management to change, to recently groups of hedge fund activists tactically pushing changes in every aspect of governance and operations of public and private entities on a global scale. Their force seems unstoppable yet their success lacks explanations, and we know little about their next targets. As the landscape changes, the players remain. The old mutual funds and pension funds are still the dominate forces of institutional investors and their power behind the board room cannot be ignored. This paper investigates the institutional investor background to relate it to activist target selection by developing measures drawn from the theoret-ical models in Edmans (2009) and Admati and Pfleiderer (2009) and survey findings in McCahery, Sautner and Starks (2016).
pref-erences and to investigate whether hedge fund activists pick up such signals when targeting stocks.
More specifically, we model institutional investor backgrounds of firms through their annual voting behaviours and their trading and holding on the firms. These measures are observable across all institutional holders and there are several rea-sons why activists will pick up their signals. Firstly, institutions’ voting and trading reflect both the fundamentals of the companies as well as investors’ perceptions. Trading itself contains information, which is different from raw fundamentals from company accounting reports, but rather is processed through either sophisticated algorithms or through experiences and research. Secondly, activists usually target companies with governance issues but generally have a good fundamental perfor-mance (Brav, Jiang, Partnoy, and Thomas, 2008; Klein and Zur, 2009). Governance quality is very hard to observe and traditional measures, such E-index (Bebchuk, Cohen, and Ferrell, 2008) or G-index (Gompers, Ishii, and Metrick, 2003) are almost static. The literature has shown that disagreement with management and their sell-ing due to company poor performance from institutional investors are important channels through which they exert governance. Both trading and voting data are more frequent and observable than existing firms’ internal governance measures. Thirdly, activists generally only have a small fraction of shares in a company: their reliance on existing shareholders is unquestionable. Institutional holders tend to have large ownership, and compared with retail owners, they are the group that activists will aim to build an alliance with. Selecting companies with dissatisfied holders will gain them more popularity and give them a higher chance and more negotiating power in tackling management.
We first proxy for dissatisfied owners based on each institution’s holding period returns and find that institutional dissatisfaction predicts activist target se-lection in the following quarter. Institutional dissatisfaction is measured in terms of ownership as well as the proportion of owners. Adding the dimension of dissatisfac-tion has more power than simple institudissatisfac-tional ownership measure. It indicates that a 1 percentage point increase in the dissatisfied ownership in the present quarter will lead to a 0.012 percentage point increase in the probability of being targeted in the next quarter. The frequency of (unconditional mean) targeting is 0.007 per quarter. The magnitude is 1.5 times the effect of total institutional ownership in the baseline model. When we further decompose dissatisfied owners in terms of their stake size, we find that the medium sized owners matter the most, i.e. those between 0.5%-2% ownership owners. There has been no specific theoretical justification for this range but Noe (2002) finds small owners are the most active in exerting gover-nance. We can conjecture that these are influential owners but their stakes are also not big enough to trigger another SEC filing or a campaign. As any cut-off points to capture influential institutions are arbitrary, we use an alternative measure of dissatisfied above-the-average owners and find similar results.
in the company and makes no purchase in the following quarter. For dissatisfied exit, we check if the institution has made a negative holding period return up to its exit. To differentiate our paper from Gantchev and Jotikasthira (2016) and avoid proxying for stock liquidity, we measure exit in the lagged quarter, i.e., for each quarter of interest, the exit is measured at the quarter prior to it. Thus by construction, the institutions in the exit group and those in the existing owners’ group are mutually exclusive. We therefore include total institutional ownership as a control variable in the baseline model. We find that institutional exit has a substantial impact on activism targeting: 1 percentage point ownership exited is associated with a 0.042 percentage point increase in the likelihood of targeting while the unconditional mean of targeting is 0.007. More importantly, when we include dissatisfied exited ownership, the coefficient is 0.065 and is statistically significant at 1%. Its magnitude is 1.5 times that of the simple exit measure: 1 percentage point dissatisfied ownership exited is associated with about 10% increase in the likelihood of being targeted. Similar to the prior investigation, when we classify influential institutions using their stake sizes, we find that the 0.5%-2% of sellers predict targeting better. We conjecture that their selling of medium sized stakes may help activist stake building and signal to the market, but their stake is still not big enough to make a huge reverse impact on price to impede their selling in the first place. To reduce the problem of arbitrary cut-off points, we also use the large dissatisfied sellers and find similar results.
Finally we use institutions’ past voting records to measure directly their disagreement with management during annual voting. As is documented in the literature, institutional investors reply on third party consultancy extensively to vote on proposals (Cotter, Palmiter, and Thomas, 2010; Chio, Fisch, and Kaham, 2009). The main service provider is institutional shareholder service (ISS). We thus use a more rigorous measure to capture institutions’ disagreement at their own discretion even if ISS recommends to vote with management. We find that the more dissatisfied institutions revealed the past voting, the more likely the company is to be targeted. When we decompose voting into different categories similar to Li (2016) we find that management compensation related dissatisfaction has the most power among all in predicting subsequent activism targeting. A 1 percentage point increase in the number of dissatisfied voters in relative to total voters is associated with a 0.012 percentage increase in the probability of subsequent quarter targeting. When combining both three measures we find all of them have power to predict activism targeting and the magnitude remains similar to that from separate analyses. So far, we have studied target selectionex ante. Based on the conjecture that dissatisfied owners can be the potential allies or are easier to persuade for the activists, we study ex post how the existence of dissatisfied owners affect activists’ tactics and success.
as seeking board representation, submitting proposals, or issuing a takeover bid. To validate our conjecture that the more dissatisfied owners, the more likely the ac-tivists may gain support from them, we use announcement return as an indicator of investors’ perceived success of campaigns. We find that 1 percentage point increase in the dissatisfied ownership before a campaign is associated with a 0.029 (0.041) basis point increase in the market adjusted returns during the 10 (20) days around the announcement. The returns are not reversed in the following quarter. Finally we show direct evidence how dissatisfied owners vote in the annual meetings during activism campaigns and we find that they tend to me more pro-activist especially in management sponsored compensation related proposals.
Our results are obtained after controlling for time and firm (or industry) fixed effects and a set of firm-level variables. We include all COMPUSTAT firms and model activism targeting on a quarterly basis. We contribute to the literature by modelling the revealed institutional governance preferences and relate them to the likelihood of activism targeting. In the hedge fund activism literature, emphases were mainly on the outcomes of campaigns. Most authors have found positive market reaction upon campaign announcement (Brav, Jiang, Partnoy, and Thomas, 2008; Klein and Zur, 2009; Becht, Franks, Mayer, and Rossi, 2008; Clifford, 2008; Becht, Franks, Grant, and Wagner, 2015). Klein and Zur (2011) investigated how hedge fund activism affects creditors while Brav, Jiang, and Kim (2015) and Brav, Jiang, Ma, and Tian (2017) drew attention to production and innovation. However, the debate is on-going in the industry. The focus on campaign target selection has only been developed recently. Appel, Gomley and Keim (2016) investigated how the existence of passive investors influence campaign outcome. Gantchev and Jotikasthira (2016) used institutional trading volume to predict activism targeting and they found institutional selling provides the activist liquidity. Our paper is different from theirs in that we focus on the governance implication of exit and thus measure exit at the pre-announcement quarter instead of contemporaneous trading volume.
2.2
Literature review and hypotheses development
2.2.1 Hedge fund activism
In recent years, hedge fund activism has become so successful that it has gained sub-stantial industrial as well as academic interest. Early papers have documented this phenomenon and concluded that activists on average gain abnormal returns upon their campaign announcement (Brav, Jiang, Partnoy, and Thomas, 2008; Klein and Zur, 2009), as well as improve target firm performance in the long run, improve innovation, and product market competitiveness (Becht, Brav, Jiang, and Kim, 2015; Aslan and Kumar, 2016). Researchers have also investigated the institutional investor background of target firms: Appel, Gomley and Keim (2016) studied the presence of passive holders using a discontinuity design in index inclusion/exclusion. Gantchev and Jotikasthira (2016) found that institutional selling that provides liq-uidity induces activist block building. Kedia, Starks and Wang (2016) proxied for pro-activist institutions using evidence on past voting and campaign support. Brav, Jiang, and Li (2017) estimate jointly how institutional investors vote in proxy con-tests and how activists target firms in proxy concon-tests. In terms of answering how the activists interact with other institutional holders, Brav, Dasgupta, and Math-ews (2017) modeled implicit coordination and He and Tao (2017) studied activists’ alliance building through social connections. Wong (2017) used abnormal trading volume as proxy for wolf packing formation during campaign announcement. All these papers have the flavour that the institutional shareholders are a non-negligible force for the activist. In this paper we are trying to capture the institutional char-acteristics based on their revealed governance preference of the target company and investigate how they are associated with targeting decisions.
2.2.2 Governance through holdings
such as mutual funds are likely to be granted access to management, and institu-tional holders with large stakes are more likely to receive private call-backs than analysts after company public disclosure events (i.e., conference calls). The purpose of the call-backs is to “convey their company’s message” (Brown, Call, Clement, and Sharp, 2017). Interestingly, the IR officers also point out that hedge funds are unlikely to gain access to management as they can short sell stocks.
This supports our view that hedge fund activists may utilize various channels to gather information on companies including investigating their institutional hold-ers’ base. Prior literature on hedge fund activism has all documented that, holding else equal, the more institutional ownership there is in a firm, the higher the like-lihood that the activist will target this firm (Brav, Jiang, Partnoy, and Thomas, 2008; Klein and Zur, 2009). However, the heterogeneity among institutional holders is ignored in this setting. Naturally, if the existing shareholders are dissatisfied with their portfolio companies due to poor stock performance, they will be more likely to support an activist shareholder in making changes. Thus we hypothesize that hedge fund activists are more likely to target firms with more dissatisfied institu-tional owners. To provide further evidence that activists selectively target such firms with dissatisfied owners as they may be the potential supporters, we further proxy for activists’ perceived success using announcement returns, and study whether dis-satisfied owners are more likely to vote pro-activist in the annual meetings during campaigns.
2.2.3 Active governance through trading
have used quasi-experimental design to empirically test the threat of exit hypothe-sis. Bharath, Jayaraman, and Nagar (2013) used foreign financial crises which led to liquidity decreases in the US, and US stock market decimalization which increases liquidity to model for the liquidity-sensitivity of firms. The presence of large share-holder in liquidity-sensitive firms are more likely to exert credibility of exit and thus their performance in terms of Tobin’s Q decreases more during liquidity shocks.
In our paper, instead of studying the governance outcome of institutional trading, we base our work on the prior literature and take their trading, especially exiting due to poor performance, as a signal of shareholder dissatisfaction. This has several advantages. Firstly the trading is continuous and reported on a quarterly basis which is much higher frequency than conventional measures such as G-index or E-index to signal governance quality. Secondly, institutional trading (or exiting) contains information not only associated with company fundamentals but also the institution’s perception of its prospects. Thirdly, we focus on institutional trad-ing instead of tradtrad-ing volumes in that institutional investors as a whole are more governance-oriented than retail investors and their consensus movement is more in-formative than that of retail investors. As selling can be due to various reasons, to be consistent with the survey evidence, we focus on studying the signal of dissat-isfied exit. We hypothesize that the more dissatdissat-isfied sellers of a company are, the more likely the activist will target it.
2.2.4 Active governance through voice
Active governance through voice takes various forms: annual voting, shareholder days, private meetings, and so on. McCahery, Sautner and Starks’ (2011) survey listed these specific channels their sample institutions have undertaken. The most frequent form is to vote against management at the annual meeting, followed by discussing with the executive board and supervisory board, submitting shareholder proposals, initiating lawsuits against managers, and publicly criticizing executive board members (McCahery, Sautner and Starks, 2011).
Figure 2.1: Hedge fund campaigns from 2004 to 2014
This figure plots the number of campaigns issued by hedge funds activists from 2004 to 2014 and the number of unique activists. They are aligned with the left axis. Total number of firms in the control sample from the same period are plotted according to the right axis.
2.3
Data
2.3.1 Hedge fund activism campaigns
Hedge fund activism is defined in Brav, Jiang, Partnoy, and Thomas (2008) as when an investor acquires 5% or more of a publicly traded firm with the intention to influence its operation, strategy or management. A Schedule 13D is required to be filed to the SEC within 10 days of exceeding 5% ownership where the activist is required to disclose their purpose of transaction in item 4. We obtain hedge fund activism data from Schedule 13D filings and SharkRepellent which also contains campaigns that are announced in the media without the lead activist exceeding 5% ownership. Our comprehensive list of campaigns launched by activist hedge funds spans 1994 to 2014. Our sample starts in 2004 after matching with ISS voting analytics. We manually collect the following information: the activist’s filing date or press release date, the activist’s name and its ownership in the target company at disclosure, the tactics the activist uses, and the name and CUSIP of the target firm. A detailed definition and description of tactics can be found in sub section 2.8.1 when we investigate campaigns at cross section.
values, negative book values and over-100% institutional aggregated ownership, we obtain the final sample with 874 (892) target-quarter pairs (unique campaigns) with 257 unique activists.
We take all COMPUSTAT firms with data available in the ISS voting analyt-ics database, CRSP, and the Thomson Reuters institutional ownership database as the control sample. All our variables are constructed on a firm-quarter basis. Figure 2.1 plots the fiscal frequency of activist campaigns and the number of unique lead activists from 2004 to 2014. They are aligned with the left axis. Total number of firms in the control sample from the same period are plotted according to the right axis. Consistent with past papers on hedge fund activism, campaign activity peaked in 2007 (He and Tao, 2017), before dropping significantly during the financial crisis and then increased in more recent years. On average the occurrence of activism campaign is 3.4% annually and 0.7% quarterly.
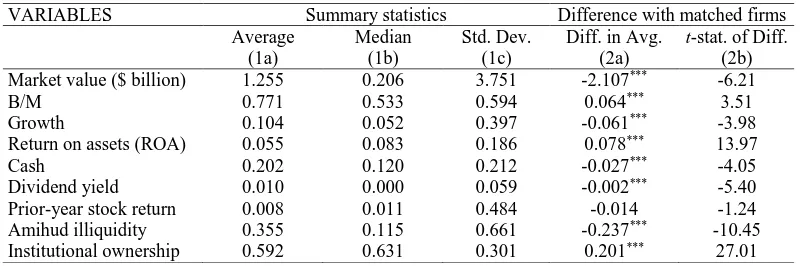
We present the summary statistics of a set of company characteristics of tar-get firms in comparisons to that of controls firms in Table 2.1. For both samples, we report mean, standard deviation and median of the quarterly reported market capitalization (MV), book-to-market (BM), dividend yield, past returns, Amihuld illiquitidy (Amihud, 2002) and E-index in Bebchuk, Cohen, and Ferrell (2008). Col-umn (1) and (2) are correspondent to the target and control sample respectively. Column (3) reports the difference and t-statistics between the two samples. Consis-tent with past literature that target firms are significantly smaller than control firms, have a higher book-to-market ratio, pay less dividend, and underperform during the quarter before targeting. There is no significant difference between the target and the control sample in terms of governance quality measured as E-index.
2.3.2 Institutional ownership
Table 2.1: Summary statistics of firm fundamentals
This table reports the characteristics of fundamentals of sample firms. Column (1) presents the means, standard deviations, and medians of characteristics for the target companies. Column (2) reports the means, standard deviations, and medians of characteristics for the firms in the control sample which covers all COMPUSTAT firms with data available on CRSP, ISS voting analytics, and 13F database. Column (3) reports the differences between the target and control sample. MV is the market value of equity measured in billions of dollars. B/M is book value of equity divided by market value of equity. Dividend yield
is (common dividend + preferred dividend)/(market value of common stock + book value of preferred stock). Past return is the buy-and-hold stock quarterly return. Illiquidity is the Amihud (2002) illiquidity measure computed as quarterly average (using daily data) of 1000p|ret|/dollar trading volume. E-index is the entrenchment index based on six provi-sions in Bebchuk, Cohen, and Ferrel (2008) and the higher the index value, the more en-trenched the management. The rest of the variables are campaign related and reported for target companies only. T akeover= 1 if the activist issues a takeover bid. T hreat= 1 when the activist threat to sue the management or submit shareholder proposals. Boardrep= 1 when the activist seeks position on the board of directors andpro= 1 if the activist actually submit shareholder proposal to the target companies. Return[−5,+5] (Return [−10,+10]) is the cumulative abnormal return during the [−5,+5] ([−10,+10]) trading day window around campaign announcement and emph Return [−2,+60] is the long term cumulative abnormal returns from two trading days prior to announcement till a quarter afterwards. ∗, ∗∗and∗ ∗ ∗indicate statistical significance at the 10%, 5% and 1% levels, respectively.
VARIABLES Target sample Control sample Comparison
Mean (1a)
SD (1b)
Median (1c)
Mean (2a)
SD (2b)
Median (2c)
Difference (3a)
t-statistics (3b)
MV ($ billions) 1.719 4.139 0.412 4.939 13.109 0.884 3.219*** 7.23
BM 0.779 0.593 0.638 0.659 0.528 0.536 -0.120*** -6.68
Dividend yield 0.002 0.004 0 0.004 0.006 0 0.002***
9.15
Past return -0.035 0.202 -0.039 0.005 0.188 -0.005 0.040*** 6.28
Illiquidity 0.152 0.246 0.075 0.127 0.242 0.053 -0.025** -2.97
E_index 2.957 1.351 3 2.953 1.393 3 -0.004 -0.05
takeover 0.034 0.180 0
threat 0.112 0.316 0
boardrep 0.209 0.406 0
pro 0.141 0.348 0
Ret [-5,+5] 0.041 0.107 0.032
Ret [-10,+10] 0.043 0.148 0.032
2.4
Dissatisfied owners
2.4.1 Measures
Our measure of institution dissatisfaction is not a simple company performance measure as different institutions purchase and sell the companies at different times and the actual gain and loss is dependent on the timing. We measure dissatisfied institution based on the basis adjusted price developed in Frazzini (2006). For each institutionj and its portfolio companyiat quarter end t, we compute:
Basis adjusted pricei,j,t= Pt
n=0Si,j,t−n,tPi,t−n
Pt
n=0Si,j,t−n,t
(2.1)
In the equation, Si,j,t−n,t is the number of shares at quarter end t held by the institutionjin the companyiwhich had been initially purchased at quarter end t−n.Pi,t−nis the share price of companyiat the initial purchase quarter endt−n. We require that Si,j,t−n,t>0 for n= 0,1, , t, which means continuous holding from quarter endt−n tot.
Intuitively, shares of a company owned at each quarter end are treated as inventories with end of quarter share price as a proxy for its unit value. Based on a first-in-first-out principle, at the end of each quarter, we calculate the average unit price from all past holdings history and compare this bases adjusted price with the actual end of quarter share price. For each quarter endt, companyiand institution j, we define:
Dissatisfactioni,j,t=
(
1 if Basis adjusted pricei,j,t< Pi,t 0 if Basis adjusted pricei,j,t>=Pi,t
(2.2)
wherePi,t is the share price of companyiat quarter end t.
One thing to notice, in order to calculate basis adjusted price, we require that the ownership exist for at least two consecutive quarters. Since we do not observe the exact time in a quarter when the stakes are acquired, we cannot easily classify dissatisfied owners if they only acquire the shares for less than one quarter. We address this problem by classifying them into Dissatisf action= 0 group and argue that these new owners, on average, should not determine the institutional governance profile of companies. New holders may not have as much information on the company as other long term holders: this information can be soft information such as access to management and so on. As is shown in McCahery, Sautner and Starks (2016), long term holders engage more with companies and intervene more intensively than short term owners. Thus short term owners, their existence and trading may not matter as much as long term holders to the activist.
Dissatisfied ownershipi,t = J
X
j=1
dissatisfactioni,j,t×ownershipi,j,t (2.3)
We also create an alternative proxy to capture the proportion of dissatisfied owners of all owners:
% Dissatisfied ownersi,t=
PJ
j=1dissatisfactioni,j,t
J (2.4)
whereJ is the total number of institutional holders.
As is shown both in theory and in empirical work, the stake size does not necessarily matter linearly in exerting governance power (Noe, 2002), instead of studying all institutional holders, we impose some restrictions on their ownership stakes. The dummy variable Ii,j,tφ = 1 for fund j’s stake in company i at the end of quartert if it satisfies certain restrictionsφ. We explore different restrictions by setting the minimum ownerships (φ) to be included in the sample as 0.5%, 2%, 5%, and 10% respectively. Thus we modify the two measures as:
> φ dissatisfied ownershipi,t = J
X
j=1
dissatisfactioni,j,t×ownershipi,j,t×I φ
i,j,t (2.5)
> φ% dissatisfied ownersi,t =
PJ
j=1dissatisfactioni,j,t×Ii,j,tφ
J (2.6)
2.4.2 Summary statistics of (dissatisfied) owners
Table 2.2: Summary statistics of institutional ownership
This table reports the characteristics of institutional ownership of sample firms. Panel A reports ownership as the proportion of shares held by institutional investors and panel B reports the fractions of certain institutional owners out of all institutional owners. Panel (A1) and (B1) measures all institutional owners and panel (A2) and (B2) reports dissat-isfied institutional owners only. The definition of dissatdissat-isfied institutional owners can be found in equation 2.2. Column (1) presents the means, standard deviations, and medians of characteristics for the target companies. Column (2) reports the means, standard devi-ations, and medians of characteristics for the firms in the control sample which covers all COMPUSTAT firms with data available on CRSP, ISS voting analytics, and 13F database. Column (3) reports the differences between the target and control sample. O total(O neg) is the total (dissatisfied) institutional ownership. O φ (O neg φ) is the aggregated (dissat-isfied) institutional ownership if the (dissat(dissat-isfied) institution hold more than φ shares of the company defined in equation 2.5. P O φ(P O neg φ) is the proportion of (dissatisfied) institutional owners with more thanφshares of the company out of total number of insti-tutional investors defined in equation 2.6. φequals to 0.5%, 2%, 5%, and 10% respectively. O neg largeis defined in equation 2.7 as the aggregated large dissatisfied institutional own-ership. P O neg large is defined in equation 2.8 as the proportion of large (owners more than average) dissatisfied owners out of all institutional owners. ∗, ∗∗ and ∗ ∗ ∗ indicate statistical significance at the 10%, 5% and 1% levels, respectively.
Panel A: owners (ownership)
VARIABLES Target Control Comparison
A1: Owner Mean (1a) SD (1b) Median (1c) Mean (2a) SD (2b) Median (2c) Difference (3a) t-statistics (3b)
O_total 0.694 0.211 0.736 0.634 0.243 0.686 -0.061*** -7.33
O_0.5% 0.602 0.187 0.632 0.525 0.214 0.553 -0.077*** -10.60
O_2% 0.445 0.160 0.457 0.366 0.176 0.372 -0.079*** -13.10
O_5% 0.240 0.141 0.231 0.190 0.142 0.175 -0.050*** -10.35
O_10% 0.0778 0.106 0 0.0631 0.106 0 -0.015*** -4.07
A2: Dissatisfied owner Mean SD Median Mean SD Median difference t-statistics
O_neg 0.350 0.294 0.324 0.243 0.269 0.137 -0.107*** -11.68
O_neg_0.5% 0.310 0.267 0.277 0.207 0.236 0.108 -0.104*** -12.88
O_neg _2% 0.238 0.219 0.191 0.151 0.186 0.063 -0.088*** -13.80
O_neg _5% 0.136 0.152 0.083 0.081 0.125 0 -0.055*** -12.84
O_neg _10% 0.047 0.090 0 0.028 0.076 0 -0.018***
-7.03
O_neg_large 0.300 0.256 0.271 0.208 0.234 0.112 -0.092*** -11.48
Panel B: owners (number %)
B1: Owner Mean SD Median Mean SD Median difference t-statistics
PO_0.5% 0.263 0.114 0.260 0.204 0.109 0.201 -0.059*** -15.84
PO _2% 0.108 0.066 0.100 0.075 0.057 0.064 -0.034*** -17.42
PO_5% 0.039 0.037 0.028 0.024 0.028 0.016 -0.015*** -15.39
PO_10% 0.008 0.015 0 0.005 0.012 0 -0.003*** -6.99
B2: Dissatisfied owner Mean SD Median Mean SD Median difference t-statistics
PO_neg 0.467 0.339 0.542 0.364 0.335 0.305 -0.103*** -9.06
PO_neg_0.5% 0.140 0.127 0.124 0.087 0.105 0.043 -0.053*** -14.82
PO_neg _2% 0.062 0.068 0.043 0.035 0.050 0.011 -0.028*** -16.11
PO_neg _5% 0.024 0.034 0.009 0.012 0.023 0 -0.012*** -14.97
PO_neg _10% 0.005 0.013 0 0.003 0.009 0 -0.003*** -8.63
PO_neg_large 0.111 0.090 0.114 0.082 0.085 0.057 -0.030***
-10.35
owner-ship that exceeds a certain threshold (> φownershipi,t=PJ
j=1ownershipi,j,t×I φ i,j,t where Ii,j,tφ = 1 if ownershipi,j,t > φ, and φ = 0.5%,2%,5%,and10% respectively), all measures of the target companies are significantly higher than those of the con-trol sample. Interestingly, it seems that the difference of total ownership between target and control samples is mostly from the lower end of the thresholds: the dif-ference of aggregated ownership from over 0.5%-owners (2%-owners) between the target and control group is 7.7% (7.9%), higher than the 6.1% difference when we consider all owners regardless of stake size. These medium sized holders with 0.5% to 2% ownership are the main driving force behind the difference in institutional ownership between the target and control sample and may be the main potential allies or supporters the activists need to rely on. This is reasonable in that the activists’ stakes are relatively larger and their medium sized stakes are influential but will not be big enough to de-incentivize activists’ costly campaigns. This can also be shown in the ratio of the number of large owners relative to the number of total instuitional owners. There are 0.059% (0.034%) owners of over 0.5% (2%) ownership of the target companies, significantly higher than the control group. The difference becomes much smaller when we increase the threshold. It shows that there is a majority of institutional owners with ownership between 0.5% to 2% who are driving the total ownership difference between the target sample and control sample.
When comparing our main variable, the dissatisfied ownership, between the target and control sample, we find that the difference is 10.7 percentage points and is statistically significant. The ratio of dissatisfied owners to total owners is also significantly higher in target companies. Almost half (46.7%) of the institutional owners in the target company before the campaign quarter experienced negative holding period return while that of the control sample is 36.4%. When we further restrict to large dissatisfied owners with different cut-off points, we find the signifi-cant difference in terms of ownership as well as the fraction of owners exists across all ownership size groups. Consistent with the previous findings, the difference in the dissatisfied ownership between the target and control samples also comes from medium sized owners with between 0.5% to 2% ownership. Interestingly, in terms of the number of dissatisfied owners, it seems that there are more small dissatisfied owners (ownership less than 0.5%) as the difference of the proportion of dissatisfied over 0.5%-owners out of total owners between the target and control sample is 0.053 while that without ownership restriction is 0.103.
Since the ownership threshold seems to be arbitrary, we also calculate the average institutional ownership in companyiat the end of quartertand only include those exceeding the average. In this specification, Ii,j,tA = 1if ownershipi,j,t >= ownershipi,t and we modify the two measures as:
Large dissatisfied ownershipi,t= J
X
j=1
dissatisfactioni,j,t×ownershipi,j,t×Ii,j,tA
%Large dissatisfied ownersi,t= PJ
j=1dissatisfactioni,j,t×Ii,j,tA
J (2.8)
The summary statistics of large dissatisfied owners are also presented in table 2.2 whereO neg largeas defined in equation 2.7 is the aggregated large dissatisfied institutional ownership andP O neg largeas defined in equation 2.8 is the propor-tion of large (owners more than average) dissatisfied owners out of all institupropor-tional owners.The difference of large dissatisfied ownership between the target and control sample is 0.092 and is statistically significant at 1%, similar to that when we use all institutions regardless of their stakes. In terms of the proportions, 11.1% of all owners in the target companies are large and dissatisfied ones compared with 8.2% in the control sample. The 3.1% difference between them is still smaller than 10.3% when using all dissatisfied owners, which further confirms that the target firms have more small owners (stake<0.5%) in terms of numbers than the control firms.
The simple decomposition of ownership in terms of dissatisfaction and stake size has revealed that target firms have a higher concentration of dissatisfied institu-tional holders. Medium sized dissatisfied owners (ownerships between 0.5% to 2%) are the driving force of ownership difference while, in numbers, there are more small sized dissatisfied owners (ownerships less than 0.5%) concentrated in target firms before a campaign announcement.
2.4.3 Regression results for dissatisfied owners
Are activists more likely to target companies with more dissatisfied in-stitutional owners?
In this sub section, we investigate whether the existence of dissatisfied owners affect activists’ target selection by running the following regression:
Targeti,t+1 =α+β×dissatisfied ownersi,t+γ×Zi,t+θt+δi+εi,t (2.9) Targeti,t+1= 1 if companyiis targeted during the quarter that ends att+ 1. Zi,t is a set of firm controls measured at the end of the quarter t, including the logarithm of market capitalization, book-to-market value, dividend yield, E-index, stock return and Amihuld illiquidity (Amihuld, 2002). For our main variable of interest, dissatisfied ownersi,t, we use two different specifications discussed in the previous subsection and the results are discussed in the next paragraph. We also include firm (industry) fixed effectδi and time fixed effect θt.
col-umn (1)O restis the difference betweenO totalandO 0.5%. All other independent variables are as defined in Table 2.1 and 2.2. In each column we report coefficients and their clustered standard errors.
Table 2.3: An analysis of institutional owners and target selection
This table applies a linear probability model to examine how different institutional ownership decomposition, especially how dissatisfied ownership, predicts the activist target selection. O restis the difference between total institutional ownership and certain ownership decom-position. For example, in column (1)O restis the difference betweenO totalandO 0.5%. All other independent variables are as defined in Table 2.1 and 2.2. In each column we report coefficients and their clustered standard errors. ∗, ∗∗ and ∗ ∗ ∗ indicate statistical significance at the 10%, 5% and 1% levels, respectively.
(1) (2) (3) (4) (5) (6) (7) (8) (9) (10)
VARIABLES target target target target target target target target target target
O_total 0.008*** (0.003)
O_rest 0.005 0.002 0.016*** 0.011*** 0.005* 0.005* 0.005* 0.007** 0.008***
(0.014) (0.006) (0.004) (0.003) (0.003) (0.003) (0.003) (0.003) (0.003)
O_0.5% 0.008***
(0.003)
O_2% 0.010***
(0.003)
O_5% 0.000
(0.004)
O_10% -0.000
(0.005)
O_neg 0.012***
(0.003)
O_neg_0.5% 0.012***
(0.003)
O_neg_2% 0.014***
(0.004)
O_neg_5% 0.012***
(0.004)
O_neg_10% 0.007
(0.006) LogMV -0.004*** -0.004*** -0.004*** -0.005*** -0.004*** -0.003*** -0.003*** -0.003*** -0.004*** -0.004***
(0.001) (0.001) (0.001) (0.001) (0.001) (0.001) (0.001) (0.001) (0.001) (0.001)
BM 0.003** 0.003** 0.003** 0.003** 0.003** 0.002* 0.002* 0.002* 0.003** 0.003**
(0.001) (0.001) (0.001) (0.001) (0.001) (0.001) (0.001) (0.001) (0.001) (0.001) Dividend -0.140* -0.140* -0.141* -0.138* -0.142* -0.155** -0.154** -0.151** -0.143* -0.140* yield (0.075) (0.075) (0.075) (0.075) (0.075) (0.076) (0.076) (0.076) (0.076) (0.075) Past return -0.004** -0.004** -0.004** -0.004** -0.004** -0.002 -0.002 -0.002 -0.004** -0.004**
(0.002) (0.002) (0.002) (0.002) (0.002) (0.002) (0.002) (0.002) (0.002) (0.002) Illiquidity -0.005** -0.005** -0.005** -0.005* -0.005** -0.005* -0.005* -0.005* -0.005** -0.005**
(0.003) (0.003) (0.003) (0.003) (0.003) (0.003) (0.003) (0.003) (0.003) (0.003)
Constant Y Y Y Y Y Y Y Y Y Y
Observations 116,412 116,412 116,412 116,412 116,412 116,412 116,412 116,412 116,412 116,412
R-squared 0.065 0.065 0.065 0.065 0.065 0.065 0.065 0.065 0.065 0.065
Firm FE Y Y Y Y Y Y Y Y Y Y
Qtr FE Y Y Y Y Y Y Y Y Y Y
Cluster Firm Firm Firm Firm Firm Firm Firm Firm Firm Firm
that the higher the total institutional ownership, the more likely the company is to be a target. This is consistent with our summary statistics and previous literature (Brav, Jiang, Partnoy, and Thomas, 2008). When we restrict to large institutional ownership using different cut-off points (ownership over 0.5%, 2%, 5%, and 10% re-spectively), the coefficient on ownership become both statistically and economically insignificant for over-5% and over-10% owners, while it remains similar to that of the baseline model for over-0.5% and over-2% owners. This is consistent with the findings in the previous subsection that activists tend to target firms with more institutional ownership and it comes from many medium-sized stake holders rather than from large owners. More importantly, when we include dissatisfied ownership in column (6), the coefficient of the rest of institutional ownership becomes smaller and significant at 10%. The coefficient of dissatisfied ownership is 0.012 and signifi-cant at 1%. The magnitude is 1.5 times the effect of total institutional ownership in the baseline model. When we decompose dissatisfied ownership further into differ-ent size-cut-off points from columns (7) to (10), the effect of dissatisfied ownership persists in all specifications apart from over-10% dissatisfied owners’ group.
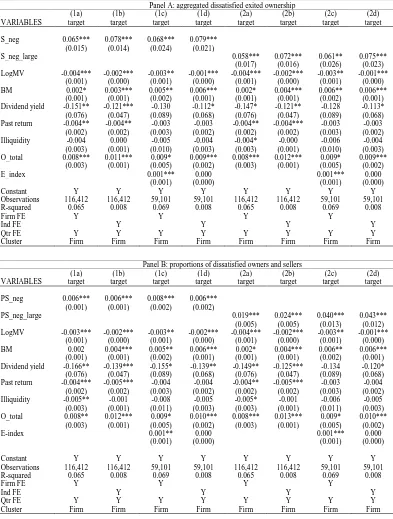
Drawn from the findings in the exploratory stage in the previous paragraph, we present the main results of how dissatisfied ownership affects targeting selection in Table 2.4. In panel A, we use measures of dissatisfied owners as fractions of shares while panel B uses the proportion of certain institutions out of all institutions. In column (1) of each panel, we use all dissatisfied owners and in column (2) we restrict to large owners whose ownership exceeds the average. In each specification, we also include E-index as a governance quality measure and the sample size is reduced substantially due to data availability but the results remain unchanged. We include firm (industry) fixed effect and time fixed effects. The coefficients on (large) dissat-isfied ownership and the fraction of (large) owners are both statistically significant and economically meaningful. A 1 percentage point increase in the (large) dissatis-fied ownership in the present quarter will lead to the increase in the probability of being targeted by 0.016 (0.017) percentage points in the next quarter (columns (1b) and (2b)). As the unconditional mean of targeting is 0.007, 1 standard deviation increase of the fraction of (large) dissatisfied owners leads to the increase in the targeting probability by 24% (25%).
Panel A: aggregated dissatisfied ownership
(1a) (1b) (1c) (1d) (2a) (2b) (2c) (2d)
VARIABLES target target target target target target target target
O_neg 0.012*** 0.016*** 0.013*** 0.013***
(0.003) (0.002) (0.005) (0.002)
O_neg_large 0.013*** 0.017*** 0.014*** 0.013***
(0.003) (0.002) (0.005) (0.002)
LogMV -0.003*** -0.002*** -0.003** -0.002*** -0.003*** -0.002*** -0.003** -0.002***
(0.001) (0.000) (0.001) (0.000) (0.001) (0.000) (0.001) (0.000)
BM 0.002* 0.004*** 0.006** 0.006*** 0.002* 0.004*** 0.006** 0.006***
(0.001) (0.001) (0.002) (0.001) (0.001) (0.001) (0.002) (0.001)
Dividend yield -0.155** -0.134*** -0.135 -0.126* -0.154** -0.133*** -0.135 -0.126*
(0.076) (0.047) (0.089) (0.068) (0.076) (0.047) (0.089) (0.068)
Past return -0.002 -0.002 0.000 -0.001 -0.002 -0.002 -0.000 -0.001
(0.002) (0.002) (0.003) (0.003) (0.002) (0.002) (0.003) (0.003)
Illiquidity -0.005* -0.000 -0.007 -0.005 -0.005* -0.000 -0.007 -0.005
(0.003) (0.001) (0.010) (0.003) (0.003) (0.001) (0.011) (0.003)
O_rest 0.005* 0.010*** 0.007 0.008*** 0.006* 0.010*** 0.007 0.008***
(0.003) (0.001) (0.005) (0.002) (0.003) (0.001) (0.005) (0.002)
E_index 0.001*** 0.000 0.001*** 0.000
(0.001) (0.000) (0.001) (0.000)
Constant Y Y Y Y Y Y Y Y
Observations 116,412 116,412 59,101 59,101 116,412 116,412 59,101 59,101
R-squared 0.065 0.008 0.069 0.008 0.065 0.008 0.069 0.008
Firm FE Y Y Y Y
Industry FE Y Y Y Y
Qtr FE Y Y Y Y Y Y Y Y
Cluster Firm Firm Firm Firm Firm Firm Firm Firm
Panel B: proportions of dissatisfied owners
(1a) (1b) (1c) (1d) (2a) (2b) (2c) (2d)
VARIABLES target target target target target target target target
PO_neg 0.005*** 0.005*** 0.006*** 0.004***
(0.001) (0.001) (0.002) (0.001)
PO_neg_large 0.020*** 0.019*** 0.031*** 0.022***
(0.005) (0.004) (0.007) (0.007)
LogMV -0.003*** -0.002*** -0.003** -0.002*** -0.003*** -0.002*** -0.002** -0.001***
(0.001) (0.000) (0.001) (0.000) (0.001) (0.000) (0.001) (0.000)
BM 0.002* 0.004*** 0.006** 0.006*** 0.002* 0.004*** 0.006** 0.006***
(0.001) (0.001) (0.002) (0.001) (0.001) (0.001) (0.002) (0.001)
Dividend yield -0.161** -0.132*** -0.145 -0.128* -0.155** -0.129*** -0.139 -0.122*
(0.076) (0.047) (0.089) (0.068) (0.075) (0.047) (0.089) (0.068)
Past return -0.001 -0.002 0.002 -0.000 -0.002 -0.002 0.001 -0.001
(0.002) (0.002) (0.003) (0.003) (0.002) (0.002) (0.003) (0.003)
Illiquidity -0.005** -0.001 -0.008 -0.005 -0.006** -0.001 -0.008 -0.006
(0.003) (0.001) (0.011) (0.003) (0.003) (0.001) (0.011) (0.003)
E_index 0.001*** 0.000 0.001*** 0.000
(0.001) (0.000) (0.001) (0.000)
O_total 0.008** 0.013*** 0.009* 0.010*** 0.008*** 0.013*** 0.009* 0.010***
(0.003) (0.001) (0.005) (0.002) (0.003) (0.001) (0.005) (0.002)
Constant Y Y Y Y Y Y Y Y
Observations 116,412 116,412 59,101 59,101 116,412 116,412 59,101 59,101
R-squared 0.065 0.008 0.069 0.008 0.065 0.008 0.069 0.008
Firm FE Y Y Y Y
Ind FE Y Y Y Y
Qtr FE Y Y Y Y Y Y Y Y
2.5
Dissatisfied sellers
2.5.1 Measures
A few theoretical papers (Edmans, 2009; Admati and Pfleiderer, 2009; Dasgupta and Piacentino, 2015) have established that institutional exit or threat of exit is also an effective way of institutional investors exerting external governance. According to McCahery, Sautner and Starks (2016), a majority of institutional holders have exited due to poor performance and they have also documented that the number of institutions that exited is as important as the amount of ownership sold for the threat of exit to be effective. As selling can be due to various reasons such as portfolio rebalancing, we concentrate ontotal exit due to dissatisfied performance. For each quarter end t, we define fund j as a seller if it exits all its ownership of companyiat the end of quartert−1 and holds 0 shares at quarter ending t:
Total exiti,j,t =
(
1 if ownershipi,j,t−1= ownershipi,j,t = 0 and ownershipi,j,t−2>0
0 otherwise
(2.10)
For each companyiat the end of each quartert, we first calculate:
Sold dissatisfied ownershipi,t=
J
X
j=1
total exiti,j,t×dissatisfactioni,j,t−2×ownershipi,j,t−2
(2.11)
And according to McCahery, Sautner and Starks (2016), institutional in-vestors regard selling by other institutions for the same reason as imposing more threat of exit on companies, we thus calculate the alternative proxy to capture the group pressure:
% Dissatisfied sellersi,t =
PJ
j=1total exiti,j,t×dissatisfactioni,j,t
PJ
j=1total exiti,j,t
(2.12)
We emphasize that the sample of sellers is mutually exclusive from that of owners by construction, as we require the sale happen before the quartertthus the ownership of sellers is 0 throughout quartert.
the two measures as:
> φsold dissatisfied ownershipi,t= J
X
j=1
total exiti,j,t×dissatisfactioni,j,t×ownershipi,j,t×I φ i,j,t
(2.13)
> φ% dissatisfied sellersi,t =
PJ
j=1total exiti,j,t×dissatisfactioni,j,t×I
φ i,j,t
PJ
j=1total exiti,j,t
(2.14)
2.5.2 Summary statistics of (dissatisfied) sellers
Table 2.5: Summary statistics of institutional sellers
This table reports the characteristics of institutional sellers of sample firms. Panel A reports sold ownership as the proportion of shares and panel B reports the fractions of certain institutional sellers out of all institutional sellers. At the quarter end t, a seller is defined as the institution which has sold all its ownership before the quarter starts and the ownership remain 0 during the quarter (equation 2.10). Panels (A1) and (B1) report all institutional sellers and panels (A2) and (B2) report only dissatisfied institutional sellers. The definition of dissatisfaction can be found in equation (2). Column (1) presents the means, standard deviations, and medians of characteristics for the target companies. Column (2) reports the means, standard deviations, and medians of characteristics for the firms in the control sample which covers all COMPUSTAT firms with data available on CRSP, ISS voting analytics, and 13F database. Column (3) reports the differences between the target and control samples. S total(S neg) is the total (dissatisfied) institutional ownership sold. S φ(S neg φ) is the aggregated (dissatisfied) institutional ownership sold if the (dissatisfied) institution holds more thanφshares of the company. S neg largeis defined in equation 2.15 as the aggregated large dissatisfied institutional ownership sold if the institution owns more than the average. P S φ(P S neg φ) is the proportion of (dissatisfied) institutional sellers with overφ shares of the company out of total number of institutional sellers. P S neg large is defined in equation 2.16 as the proportion of large dissatisfied sellers out of all institutional sellers. φ equals to 0.5%, 2%, 5%, and 10% respectively. ∗,∗∗and∗ ∗ ∗indicate statistical significance at the 10%, 5% and 1% levels, respectively.
Panel A: sellers (units measured in ownership)
VARIABLES Target Control Comparison
A1: Sellers Mean (1a) SD (1b) Median (1c) Mean (2a) SD (2b) Median (2c) Difference (3a) t-statistics (3b)
S_total 0.064 0.068 0.047 0.043 0.046 0.029 -0.022*** -13.64
S_0.5% 0.048 0.061 0.030 0.029 0.042 0.016 -0.018*** -12.88
S_2% 0.026 0.049 0 0.015 0.034 0 -0.011*** -9.75
S_5% 0.011 0.036 0 0.006 0.025 0 -0.005*** -5.51
S_10% 0.001 0.015 0 0.001 0.016 0 -0.000 -0.19
A2: Dissatisfied sellers Mean SD Median Mean SD Median difference t-statistics
S_neg 0.027 0.043 0.010 0.014 0.029 0.002 -0.013*** -12.97
S_neg_0.5% 0.021 0.040 0 0.010 0.026 0 -0.011***
-12.02
S_neg _2% 0.012 0.034 0 0.006 0.021 0 -0.007*** -8.99
S_neg _5% 0.005 0.026 0 0.002 0.016 0 -0.003*** -5.03
S_neg _10% 0.001 0.011 0 0.001 0.010 0 -0.000 -0.88
S_neg_large 0.019 0.038 0 0.010 0.025 0 -0.009*** -10.72
Panel B: sellers (number %)
B1: Sellers Mean SD Median Mean SD Median difference t-statistics
PS_0.5% 0.145 0.132 0.120 0.098 0.114 0.067 -0.047*** -12.11
PS_2% 0.038 0.072 0 0.022 0.056 0 -0.016*** -8.49
PS_5% 0.008 0.030 0 0.005 0.026 0 -0.003*** -3.41
PS_10% 0.000 0.005 0 0.001 0.010 0 0.000 0.39
B2: Dissatisfied sellers Mean SD Median Mean SD Median difference t-statistics
PS_neg 0.350 0.297 0.357 0.268 0.284 0.174 -0.082*** -8.47
PS_neg_0.5% 0.064 0.095 0 0.034 0.075 0 -0.030*** -11.84
PS_neg _2% 0.019 0.049 0 0.009 0.037 0 -0.010***
-7.72
PS_neg _5% 0.004 0.024 0 0.002 0.018 0 -0.002*** -3.71
PS_neg _10% 0.000 0.005 0 0.000 0.007 0 -0.000 -0.39
PS_neg_large 0.049 0.072 0 0.031 0.062 0 -0.018*** -8.60
threshold (Large sold ownershipi,t =PJ
j=1total exiti,j,t×ownershipi,j,t×I φ
i,j,t where Ii,j,tφ = 1 if ownershipi,j,t > φ, and φ= 0.5%,2%,5%,and10% respectively), all the target companies’ large exited ownership is higher than that of the control sample and statistically significant apart from the over-10% sellers. By comparing the magnitude of the difference between the target and control sample for different cut-off points, it seems that it is the lower bound (0.5% to 2%) sellers who are driving the difference. This becomes more obvious when we look at the ratio of large sellers to all sellers. 14.5% (9.8%) of all sellers are those who had ownership over 0.5% in the target sample (control sample), while over-2% sellers only count for 3.8% (2.2%) of all sellers. This is consistent with the price impact theory that investors tend not to sell large stakes due to the adverse price impact. By comparing the sellers of different stake sizes, it seems that the medium-sized (0.5%-2%) sellers drive the difference in ownership sold between the target and control samples. This is plausible in that these sellers were relatively large holders and their exiting can signal for the future prospect of the company but their stakes were also not large enough to make excess price impact adversely impede their selling decision.
Large sold dissatisfied ownershipi,t= J
X
j=1
total exiti,j,t×dissatisfactioni,j,t×ownershipi,j,t×Ii,j,tA
(2.15)
% large dissatisfied sellersi,t = PJ
j=1total exiti,j,t×dissatisfactioni,j,t×Ii,j,tA J
(2.16)
The summary statistics are also presented in Table 2.5. S neg large is de-fined in equation 2.15 as the aggregated large dissatisfied institutional ownership sold if the institution owns more than the average. P S neg largeis defined in equa-tion 2.16 as the proporequa-tion of large dissatisfied sellers out of all instituequa-tional sellers. On average, the large dissatisfied ownership sold in the target firm is 0.9 percentage points higher than that in the control firm which takes almost half of the difference of total sold ownership regardless of dissatisfaction between target and control sam-ple. 4.9% of all sellers in the target sample are dissatisfied and large sellers while that in the control sample is 3.1%. This shows that there is a concentration of small sellers in the target companies in terms of numbers.
2.5.3 Regression results for dissatisfied sellers
Are activists more likely to pick up signals from dissatisfied sellers?
Institutional investors often use exit as means of governance if their stock perfor-mance is dissatisfying and we investigate whether activists can pick up these signals to target companies. The regression specification is as follows:
Targeti,t+1 =α+β×dissatisfied sellersi,t+γ×Zi,t+θt+δi+εi,t (2.17) Targeti,t+1 = 1 if company i is targeted during the quarter that ends at t+ 1. Zi,t is a set of firm controls discussed in the previous subsection and δi is firm (industry) fixed effect and we also include time fixed effect θt. Our variable of interest, dissatisfied sellersi,t, is calculated based on institutions that had already exited (sold all their stakes) at the beginning of quarter t and remain non-owners throughout the quarter. By construction, this measure will capture the institutional selling one quarter prior to targeting. Due to the time difference between selling and targeting we argue that our measure is not the liquidity measure upon targeting. We use Amihuld (2002) illiquidity during the quarter to measure liquidity.