warwick.ac.uk/lib-publications
Original citation:
Ahmed, Saad, Khan, Zainab, Si, Francie, Mao, Alex, Pan, Irene, Yazdi, Fatemeh, Tsertsvadze, Alexander, Hutnik, Cindy, Moher, David, Tingey, David, Trope, Graham E., Damji, Karim F., Tarride, Jean-Eric, Goeree, Ron and Hodge, William. (2016) Summary of glaucoma diagnostic testing accuracy : an evidence-based meta-analysis. Journal of Clinical Medicine Research, 8 (9). pp. 641-649.
Permanent WRAP URL:
http://wrap.warwick.ac.uk/83600
Copyright and reuse:
The Warwick Research Archive Portal (WRAP) makes this work of researchers of the University of Warwick available open access under the following conditions.
This article is made available under the Creative Commons Attribution-NonCommercial 4.0 (CC BY-NC 4.0) license and may be reused according to the conditions of the license. For more details see: http://creativecommons.org/licenses/by-nc/4.0/
A note on versions:
The version presented in WRAP is the published version, or, version of record, and may be cited as it appears here.
Original Article
J Clin Med Res. 2016;8(9):641-649Summary of Glaucoma Diagnostic Testing Accuracy: An
Evidence-Based Meta-Analysis
Saad Ahmeda, Zainab Khanb, Francie Sia, Alex Maoa, Irene Pana, Fatemeh Yazdic,
Alexander Tsertsvadzec, Cindy Hutnika, David Moherc, David Tingeya,
Graham E. Troped, Karim F. Damjie, Jean-Eric Tarridef, Ron Goereef, William Hodgea, g, h
Abstract
Background: New glaucoma diagnostic technologies are penetrating clinical care and are changing rapidly. Having a systematic review of these technologies will help clinicians and decision makers and help identify gaps that need to be addressed. This systematic review studied five glaucoma technologies compared to the gold standard of white on white perimetry for glaucoma detection.
Methods: OVID® interface: MEDLINE® (In-Process & Other
Non-Indexed Citations), EMBASE®, BIOSIS Previews®, CINAHL®,
PubMed, and the Cochrane Library were searched. A gray literature search was also performed. A technical expert panel, information spe-cialists, systematic review method experts and biostatisticians were used. A PRISMA flow diagram was created and a random effect meta-analysis was performed.
Results: A total of 2,474 articles were screened. The greatest accura-cy was found with frequenaccura-cy doubling technology (FDT) (diagnostic odds ratio (DOR): 57.7) followed by blue on yellow perimetry (DOR: 46.7), optical coherence tomography (OCT) (DOR: 41.8), GDx (DOR: 32.4) and Heidelberg retina tomography (HRT) (DOR: 17.8). Of greatest concern is that tests for heterogeneity were all above 50%, indicating that cutoffs used in these newer technologies were all very varied and not uniform across studies.
Conclusions: Glaucoma content experts need to establish uniform cutoffs for these newer technologies, so that studies that compare these technologies can be interpreted more uniformly. Nevertheless, synthesized data at this time demonstrate that amongst the newest technologies, OCT has the highest glaucoma diagnostic accuracy fol-lowed by GDx and then HRT.
Keywords: Glaucoma; Diagnostic techniques; Diagnostic accura-cies; Systematic review; Meta-analysis
Introduction
With the aging Western populations, special attention needs to be directed to the research of age-related eye diseases. Glau-coma is one of the leading causes of visual loss and blindness in the working age population in industrialized countries [1-4]. In most Western nations, aside from age-related macular degeneration, glaucoma is the next most common cause of permanent vision loss in persons aged 40 years or older [5]. Along with diabetic retinopathy, glaucoma is also one of the most important diseases affecting the visual system in the working age population [3-5]. Finally, the extensive and in-tensive work needed to make the diagnosis, the multiple man-agement changes needed over the course of the disease, and the life-long follow-up required arguably make this condition the most important ocular disease from the health services standpoint.
Previous research has shown that early diagnosis and treatment for glaucoma reduces the rate of disease progres-sion and improves the patients’ quality of life [6]. The cur-rent “gold standards” for glaucoma diagnosis are optic disc assessment (monitors structural change) and standard achro-matic white on white perimetry (monitors functional change) [7].
Several diagnostic technologies were recently developed for early glaucoma diagnosis and progression.
1) Heidelberg retina tomography (HRT) [8, 9] uses a 675 nm frequency diode laser beam to produce a scanning laser ophthalmoscopic image. The laser light scans the retina in 24 ms sequential scans, starting above the retinal surface, and then capturing parallel images at increasing depths. The stacks of images are combined to create a three-dimensional (3D)
Manuscript accepted for publication July 13, 2016
aIvey Eye Institute, University of Western Ontario, London, ON, Canada bFaculty of Medicine, Queen’s University, Kingston, ON, Canada
cOttawa Hospital Research Institute, University of Ottawa, Ottawa, ON,
Can-ada
dDepartment of Ophthalmology and Visual Sciences, University of Toronto,
Toronto, ON, Canada
eDepartment of Ophthalmology, University of Alberta, Edmonton, AB,
Can-ada
fProgram for the Assessment of Technology and Health (PATH), and
Depart-ment of Clinical Epidemiology and Biostatistics, McMaster University, Ham-ilton, ON, Canada
gDepartment of Epidemiology and Biostatistics, University of Western
On-tario, London, ON, Canada
hCorresponding Author: William Hodge, Ivey Eye Institute, University of
Western Ontario, 268 Grosvenor St, London, ON N6A 4V2, Canada. Email: [email protected]
Articles © The authors | Journal compilation © J Clin Med Res and Elmer Press Inc™ | www.jocmr.org
642
Glaucoma Diagnostic Testing J Clin Med Res. 2016;8(9):641-649
topographic image of the retina.
2) Optical coherence tomography (OCT) [10-13] pro-vides high-resolution cross-sectional imaging of ocular tis-sues (retina, optic nerve, and anterior segment). The tech-nique is analogous to ultrasound except that light instead of sound waves is used. OCTs operate on the principle of indi-rect interferometry. Low coherence infrared light is diindi-rected to the tissue being imaged. An interferometer (beam splitter) is used to split the light. Half of the light goes to the target tissue and the other half goes into a reference arm (typically a mirror).
3) Scanning laser polarimetry (GDx variable corneal com-pensator (VCC) access) [14-16] uses a near infrared laser beam
to measure the thickness of the retinal nerve fiber layer. This
technology is based on the optical attribute of birefringence (parallel arrangement of the microtubules within the axons).
The nerve fiber layer birefringence causes the polarized laser
beam to split into two parallel rays and creates a phase shift between them; one is more distorted than the other.
4) Frequency doubling technology (FDT) is a form of pe-rimetry developed to detect ganglion cell death in early glau-comatous damage. Studies [17, 18] hypothesize that a subset of
M cells, called “non-linear” M cells, are usually the first to die
during glaucomatous damage. This subset of cells is thought to be responsible for the transmission of signals related to the frequency doubling illusion.
5) Blue on yellow automated perimetry [19-22] isolates and measures blue-yellow ganglion cell function with a 440 nm stimulus. Blue-yellow ganglion cells are believed to be one
of the first cell types damaged in glaucoma and thus seem to be
important in early glaucoma detection.
The diagnostic instruments listed above have been report-ed to detect glaucomatous damage. There is some evidence that earlier damage can be detected with HRT than with clini-cal examination or fundus photography [23, 24]. However, there has not been a comprehensive report on its accuracy compared to that of the reference standard. The goal of this systematic review is to summarize the diagnostic accuracy of recently developed glaucoma diagnostic technologies com-pared to the currently available gold standard, white on white perimetry.
Materials and Methods
Overview of evidence report
The research synthesis for glaucoma diagnostic accuracies was based on a rigorous systematic review of all published reports. Together with content experts, methodologists, information specialists, and statisticians, the evidence review staff
identi-fied specific issues and approaches necessary for limiting bias
in the review.
A technical expert panel (TEP) identified the keywords to
be used in the literature search. The methodological quality and generalizability (internal and external validity) of the in-cluded studies were critically appraised and summarized, as was individual study results.
Sources of data
The search strategy for this project was comprehensive and was tailored to achieve the highest possible recall of relevant studies. An electronic search strategy was developed by an information specialist in consultation with four clinical con-tent experts in glaucoma diagnostics. Searches were restricted from 1993 onward to exclude obsolete diagnostic options. The search end date was February 2015. Any study
provid-ing information on the sensitivity, specificity, likelihood ratio,
receiver-operating characteristic (ROC) curves, or diagnostic odds ratios (DORs) of a glaucoma diagnostic test was
includ-ed. Specific search terms tailored for diagnostic testing have
been empirically studied and were used [25, 26]. Published and unpublished human studies of any design were considered. The reference standard used was standard achromatic white on white perimetry.
The following bibliographic databases were searched
through the OVID® interface: MEDLINE® (In-Process &
Oth-er Non-Indexed Citations), EMBASE®, BIOSIS Previews®,
CINAHL®, PubMed, and the Cochrane Library. Controlled
vocabulary and keywords used in the search included terms
for glaucoma diagnostic testing including the specific evalua -tive tests and the gold standard test already mentioned in these
methods. Methodological filters were applied to limit retrieval
to relevant clinical methodologies applicable to diagnostic testing.
The gray literature was searched including websites of health technology assessment and related agencies,
profes-sional associations, and other specialized databases. GoogleTM
and other Internet search engines were used to search for ad-ditional web-based materials and information. These search-es were supplemented by hand searching the bibliographisearch-es and abstracts of key papers and conference proceedings, and through contacts with appropriate experts and agencies. These include the Association for Research in Vision and Ophthal-mology, the American Academy of OphthalOphthal-mology, the Euro-pean Ophthalmology Society and The Canadian Ophthalmol-ogy Association.
Inclusion criteria
age or older.
Study selection
Specific screening questions were drafted for all levels of rele -vance assessment, and following an appropriate calibration exer-cise, screening was performed by two independent reviewers. All records were uploaded to a software program (EPPI reviewer) to help manage the review. All records retrieved through searches underwent broad screening initially (level I) using titles, keywords and abstracts, if available. All records tagged by one or more re-viewers as potentially relevant or “can’t tell” (including reviews, statements and original studies) were screened for inclusion at the next level (full-text relevance, level II) using stricter a priori eli-gibility criteria. Reference lists of reviews that were thought to be relevant were also checked for potentially relevant publications.
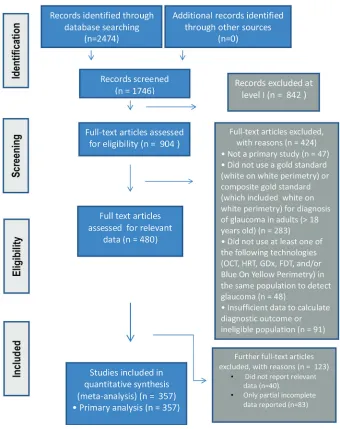
At levels where consensus was required, and when disa-greements occurred, consensus was achieved through discus-sion. When agreement could not be achieved, third party adju-dication was used to break the impasse. Reasons for exclusion of studies were documented and reported in the review. The study followed the PRISMA statement methodology and a
PRISMA flow diagram was used to report the flow of records
throughout the review [27].
Data extraction
An electronic data abstraction form was developed a priori
and tailored specifically for this review. Data collected in
[image:4.612.136.476.85.514.2]-cluded study identification data (country, language, and cita -tion), research methods data (study design, sites, and inclusion/ exclusion criteria), population baseline variables (sample size
Articles © The authors | Journal compilation © J Clin Med Res and Elmer Press Inc™ | www.jocmr.org
644
Glaucoma Diagnostic Testing J Clin Med Res. 2016;8(9):641-649
complete and enrolled, mean age, gender, and race), clinical variables (visual acuity, IOP, C/D ratio, and central cornea thick-ness), white on white VF variables (mean defect, and corrected pattern standard deviation) and index technology variables (cutoffs and methods used). Following a calibration exercise on a random sample of studies, one data abstractor independently abstracted data, and a second reviewer then independently
veri-fied the data. The data form was designed to capture all relevant
data. For example, study population characteristics as well as characteristics of the study itself that might identify potential sources of bias were included. In studies where multiple
sen-sitivities and specificities were provided, we always chose the
value for the highest sensitivity reported and then chose the
corresponding specificity with it. If data were reported as nor -mal vs. “mild”, “moderate”, and “severe” glaucoma, we always chose to report “mild” as this gives us the most important diag-nostic information (e.g. “advanced” glaucoma is much easier to diagnose and hence the test is less useful).
Study quality assessment
The QUADAS [28, 29] 14-item assessment tool was used to assess bias (nine items), variability (affecting generalizability)
(two items) and to some extent, the quality of reporting (three items). Each item is to be scored “yes,” “no,” or “unclear.”
Methods for synthesizing findings - data analysis
Random-effects meta-analysis was performed for each
diag-nostic instrument where possible and stratified by the type of
summary statistics available from eligible studies. For most aspects of meta-analysis, it is preferred that the diagnostic threshold be the same across different studies before the pa-rameters are pooled for analysis. However, ROC curves can be pooled for different diagnostic thresholds if variance is
provid-ed. The parameters of interest included sensitivities, specifici -ties, likelihood ratios, ROC curves, and DORs. The DOR is a
parameter that combines sensitivity and specificity and ranges from 0 to infinity with higher values indicating greater test per -formance. Because DORs combine the results of both
sensitiv-ity and specificsensitiv-ity, we used this as our primary outcome.
Summary of synthesized deliverables
We organized the review to answer both primary and
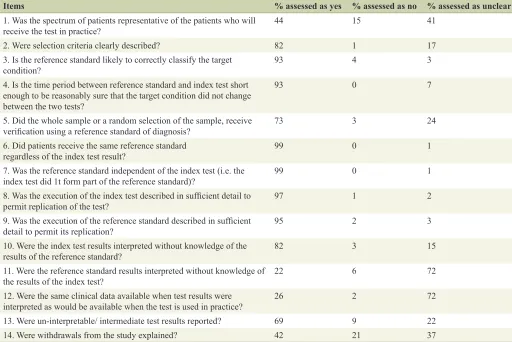
second-Table 1. Overall Assessment of Study Quality, Accuracy and Generalizability (QUADAS)
Items % assessed as yes % assessed as no % assessed as unclear
1. Was the spectrum of patients representative of the patients who will
receive the test in practice? 44 15 41
2. Were selection criteria clearly described? 82 1 17
3. Is the reference standard likely to correctly classify the target
condition? 93 4 3
4. Is the time period between reference standard and index test short enough to be reasonably sure that the target condition did not change between the two tests?
93 0 7
5. Did the whole sample or a random selection of the sample, receive
verification using a reference standard of diagnosis? 73 3 24
6. Did patients receive the same reference standard
regardless of the index test result? 99 0 1
7. Was the reference standard independent of the index test (i.e. the
index test did 1t form part of the reference standard)? 99 0 1
8. Was the execution of the index test described in sufficient detail to
permit replication of the test? 97 1 2
9. Was the execution of the reference standard described in sufficient
detail to permit its replication? 95 2 3
10. Were the index test results interpreted without knowledge of the
results of the reference standard? 82 3 15
11. Were the reference standard results interpreted without knowledge of
the results of the index test? 22 6 72
12. Were the same clinical data available when test results were
interpreted as would be available when the test is used in practice? 26 2 72
13. Were un-interpretable/ intermediate test results reported? 69 9 22
[image:5.612.47.559.102.444.2]ary research questions.
The primary research question addressed the diagnostic
accuracies of five index technologies for glaucoma screening:
1) confocal scanning laser ophthalmoscopy (divided into HRT I-II and HRT III); 2) OCT; 3) scanning laser polarimetry; 4) blue on yellow automated perimetry; and 5) FDT.
A variety of models are available for each index technol-ogy. Secondary research questions that were addressed were how the models of each index technology compare against
gold standard for glaucoma diagnosis. The specific second -ary technologies studied were as the following: 1) FDT (no subdivisions). 2) OCT (time domain, spectral domain, and OCT spectralis by Heidelberg). 3) Confocal scanning laser ophthalmoscopy (HRT I and HRT II; HRT III). 4) Blue on yel-low automated perimetry (no subdivisions). Although Swed-ish interactive threshold algorithm and full threshold are two available options, most studies included in this review did not indicate which of the two programs were utilized. 5) Scanning
laser polarimetry (GDx VCC; GDx fixed corneal compensator
(FCC)).
Results
The study process was summarized in the PRISMA flowchart
(Fig. 1).
Study quality
Table 1 summarizes the study quality and generalizability based on the QUADAS questions. Most of the accuracy/qual-ity indicators rated the studies as very good to excellent. The
generalizability indicators were moderate to good.
Study characteristics
Overall 357 studies were included in the analysis. There were 53.8% female and 46.2% male (reported in 256 studies). The mean age of the participants was 58.4 years, ranging from 41.0 to 69.7 years. Overall 42.9% of the participants were Cauca-sian. All studies reviewed were studies of glaucoma diagnosis. No studies of progression were used.
Diagnostic accuracy of technology
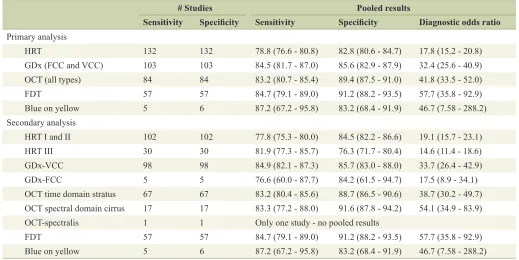
Table 2 summarizes the sensitivity, specificity and DOR for
each of our primary and secondary outcomes. As can be seen from the results, amongst the primary outcomes, the high-est DOR is from FDT followed by blue on yellow perimetry
(but with the fewest studies and widest confidence intervals).
Hence, the “older” new technologies had the highest DORs. Amongst the “newer” new technologies, OCT had the high-est DOR followed by scanning laser (GDx), and HRT had the lowest accuracy.
When we stratified our technologies into our secondary
outcomes, the results are similar but there are a few additional important points. First, the spectral domain OCT performed much better than the time domain OCT. Secondly, the GDx VCC performed much better than the GDx FCC. Finally, the HRT III has not shown an increase in diagnostic performance over HRT I and II. We also tried to stratify the data by study size, separating clinical based studies from larger population-based epidemiology studies. Unfortunately, only three
popula-# Studies Pooled results
Sensitivity Specificity Sensitivity Specificity Diagnostic odds ratio Primary analysis
HRT 132 132 78.8 (76.6 - 80.8) 82.8 (80.6 - 84.7) 17.8 (15.2 - 20.8)
GDx (FCC and VCC) 103 103 84.5 (81.7 - 87.0) 85.6 (82.9 - 87.9) 32.4 (25.6 - 40.9)
OCT (all types) 84 84 83.2 (80.7 - 85.4) 89.4 (87.5 - 91.0) 41.8 (33.5 - 52.0)
FDT 57 57 84.7 (79.1 - 89.0) 91.2 (88.2 - 93.5) 57.7 (35.8 - 92.9)
Blue on yellow 5 6 87.2 (67.2 - 95.8) 83.2 (68.4 - 91.9) 46.7 (7.58 - 288.2)
Secondary analysis
HRT I and II 102 102 77.8 (75.3 - 80.0) 84.5 (82.2 - 86.6) 19.1 (15.7 - 23.1)
HRT III 30 30 81.9 (77.3 - 85.7) 76.3 (71.7 - 80.4) 14.6 (11.4 - 18.6)
GDx-VCC 98 98 84.9 (82.1 - 87.3) 85.7 (83.0 - 88.0) 33.7 (26.4 - 42.9)
GDx-FCC 5 5 76.6 (60.0 - 87.7) 84.2 (61.5 - 94.7) 17.5 (8.9 - 34.1)
OCT time domain stratus 67 67 83.2 (80.4 - 85.6) 88.7 (86.5 - 90.6) 38.7 (30.2 - 49.7) OCT spectral domain cirrus 17 17 83.3 (77.2 - 88.0) 91.6 (87.8 - 94.2) 54.1 (34.9 - 83.9)
OCT-spectralis 1 1 Only one study - no pooled results
FDT 57 57 84.7 (79.1 - 89.0) 91.2 (88.2 - 93.5) 57.7 (35.8 - 92.9)
[image:6.612.50.569.84.344.2]Articles © The authors | Journal compilation © J Clin Med Res and Elmer Press Inc™ | www.jocmr.org
646
Glaucoma Diagnostic Testing J Clin Med Res. 2016;8(9):641-649
tion-based studies were found and all studied FDT only
com-pared to gold standard. Hence, this stratified meta-analysis was
not possible.
Sub-analyses
Table 3 demonstrates all of the sub-analyses performed. In col-umn 2 of the table, we recalculated the DORs after removing outlier studies (based on the Begg’s test). As can be seen, there was little difference in the results when these outlier studies were removed. Next we looked at DORs from peer reviewed vs Industry funded studies. In this analysis we postulated that there may be higher DORs from industry funded studies over
peer reviewed studies as there may be a bias to obtain good results for retail purposes. However, the results did not show this. While some technologies had a small increase in DORs amongst industry funded studies, others showed higher DORs
from peer reviewed funding. Overall there was no significant
pattern of increased DORs from industry vs. peer reviewed
funded studies. We also looked at whether age had an influence
on the diagnostic accuracy of the technologies. We found that when we divided studies into those where mean age was over 55 vs. under 55, the under 55 group did better in almost every analysis. When we divided the studies based on predominance of Caucasians as the majority race, we found that almost all technologies performed better amongst Caucasians vs. non-Caucasians. Finally, most of the technologies had higher
ac-Table 3. Sub-Analysis of Accuracy of Diagnostic Technology (Based on Outlier Removal, Funding Source, Age, Race and Gender)
DORs Overall Overall less outliers Peer review Industry Age > 55 < 55Age Cauc > 50% Cauc < 50% Fem > 50% Fem < 50% AUC
HRT 17.82 18.18 16.94 18.56 17.56 19.99 19 13.99 17.64 18.62 0.839
GDx 32.38 29.53 35.61 30.12 31.67 41.41 33.2 24.65 33.49 31.23 0.881
OCT 41.76 43.36 39.29 43.62 41.26 47.11 43.2 38.92 49.14 25.94 0.901
FDT 57.7 60.96 57.29 58.03 56.01 61.18 57.53 67.71 57.53 45.44 0.893
BY 46.7 NA NA NA NA NA NA NA NA NA 0.888
HRT I-II 19.05 19.87 16.41 22.96 19.11 17.81 18.45 16.35 18.45 22.25 0.843
HRT III 14.56 15.17 24.5 13.1 13.82 NA 16.89 10.72 15.31 13.07 0.829
GDx VCC 33.65 31.27 35.61 32.06 32.97 41.41 34.54 24.5 35.09 31.61 0.882
GDx FCC 17.46 17.46 NA 17.46 17.46 NA 15.03 NA 15.03 NA 0.859
OCT-T 38.73 38 34.15 42.92 38.66 50.13 41.28 31.63 45.34 23.91 0.898
OCT-C 54.12 54.12 95.27 46 54.2 56.79 62.28 47.8 66.99 31.98 0.907
[image:7.612.49.567.100.300.2]OCT-S NA NA NA NA NA NA NA NA NA NA 0.88
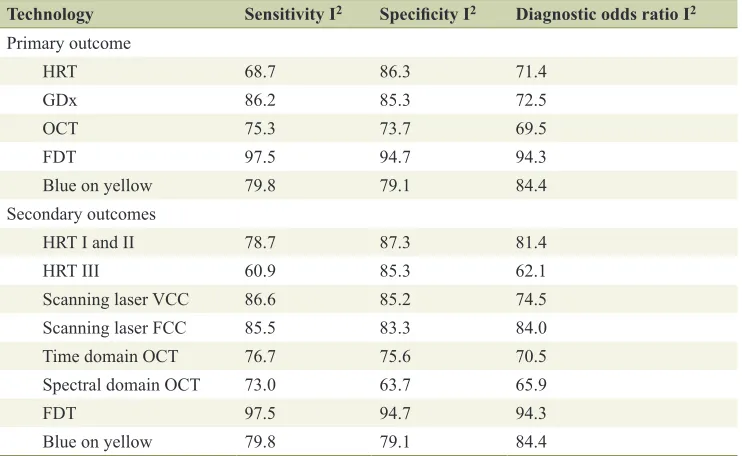
Table 4. Heterogeneity of Diagnostic Technology
Technology Sensitivity I2 Specificity I2 Diagnostic odds ratio I2
Primary outcome
HRT 68.7 86.3 71.4
GDx 86.2 85.3 72.5
OCT 75.3 73.7 69.5
FDT 97.5 94.7 94.3
Blue on yellow 79.8 79.1 84.4
Secondary outcomes
HRT I and II 78.7 87.3 81.4
HRT III 60.9 85.3 62.1
Scanning laser VCC 86.6 85.2 74.5
Scanning laser FCC 85.5 83.3 84.0
Time domain OCT 76.7 75.6 70.5
Spectral domain OCT 73.0 63.7 65.9
FDT 97.5 94.7 94.3
[image:7.612.122.493.499.727.2]curacy amongst women over men.
Heterogeneity
Table 4 summarizes I2 for each technology stratified by sensi
-tivity, specificity and DOR. This statistic is a statistic of homo -geneity. In other words, it tells us how similar the studies are that are compared. Studies that are similar tend to pool results
with the same cutoff and their technologies have a significant
amount of agreement between users. Their I2 values are close
to zero or are at least less than 50. An I2 above 50 and even
close to 100 as is true for these technologies demonstrates a large amount of heterogeneity.
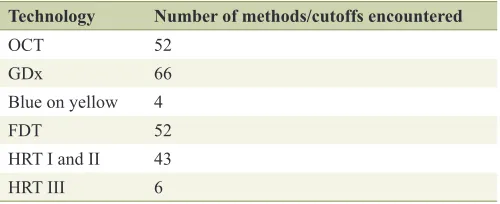
The reason for such a large amount of heterogeneity was explored and can be summarized by simply tabulating the to-tal number of different methods and cutoffs used to assess the technology in question. As an example, for OCT it is possible
to assess any clock hour, quadrant or average nerve fiber layer
thickness to assess the detection of glaucoma. Furthermore, what cutoff is used to accept the diagnosis of glaucoma can be different from study to study even for the same assessment
(e.g. average nerve fiber layer thickness). The total number of
methods and cutoffs used in our systematic review are sum-marized in Table 5.
Discussion
The QUADAS tool reveals that the overall quality within indi-vidual studies was very good (almost 75% of indiindi-vidual items were positive). However, one of the most important conclu-sions from this study is that the heterogeneity of these new glaucoma tests between studies is very high. This is disap-pointing given that there were 2,474 articles screened which makes the review very comprehensive and generalizable. When methods of outcome analysis, as well as cutoffs are this
varied, it is very difficult to be certain about the accuracy and
effectiveness of a test. It is our conclusion that the content
ex-perts of this field need to determine cutoffs and methods that
can be agreed upon to make these tests more uniform. At that point, the most accurate comparisons between technologies will be made. A pervasive challenge with all of these
diagnos-tic tools is the heavy marketing influence that can add further
inconsistencies and heterogeneity in their utilization.
Nevertheless, the synthesis of existing data, though varied
and heterogeneous, does give us some interesting information
that is useful. First, of the five main technologies tested, the highest DOR, mainly based on specificity occurred with FDT.
The next highest DOR belonged to blue on yellow perimetry based on a high sensitivity. Both of these “new” diagnostic tests have been with us for over a decade but are not in wide-spread use. Of the newer technologies, OCT had the highest accuracy (especially spectral domain OCT) followed by GDx. GDx VCC had a higher accuracy than GDx FCC. Finally, HRT was the least accurate and accuracy parameters for HRT I and II were not very different than HRT III. These are interesting results given that the HRT was heavily marketed for utilization
in the management of glaucoma being the first technology to
have a reasonable normative database as well as progression monitoring software.
When we stratified the main technologies into several
secondary technologies, other interesting information was re-vealed. The stratus OCT was much more accurate, especially
more specific than the time domain OCT. This is not surprising
as each new generation of OCT has offered substantially more resolution than its predecessor. Compared to HRT, upgrades in the OCT technology have been more frequent but progression assessment has not been possible to date.
The scanning laser (GDx) with a VCC was much more
sensitive and specific than the GDx with an FCC. Although GDx was one of the first to be introduced, it has lagged behind
the other two in terms of general adoption into clinical practice and seems to be less popular today.
Sub-analyses showed that outliers did not influence our
results. This means that the results found are robust to a few studies that may “pull” the means disproportionately. Our
re-sults were not influenced by funding source, industry vs. peer
reviewed. Our results were more accurate amongst younger patients, Caucasians and women.
Synthesis studies of these new technologies are made es-pecially challenging by the rapid pace of software changes for all of the methods. This makes assessing the technologies
difficult as technology changes can occur even before robust
evidence syntheses can be completed with evidence-based methodology.
In summary, work needs to be done by glaucoma content experts to create a more homogenous consensus regarding how to utilize the new technologies and to agree on cutoffs. At that point, it will be possible to determine if our conclu-sions regarding the relative accuracy of these newer technolo-gies remains valid. However, synthesis of results at this point in time indicates that amongst the newer glaucoma diagnostic technologies, OCT is the most accurate followed by GDx and then HRT.
Acknowledgments
[image:8.612.46.296.100.202.2]We give thanks to the funding agency of CIHR for making the study possible. We thank Dr. David Hill for helping to ob-tain the funding. We also thank Becky Skidmore for literature search, Sophia Tsouros and Jeff Brunton with the use of the software EPPI.
Table 5. Number of Cutoffs Used Stratified by Technology
Technology Number of methods/cutoffs encountered
OCT 52
GDx 66
Blue on yellow 4
FDT 52
HRT I and II 43
Articles © The authors | Journal compilation © J Clin Med Res and Elmer Press Inc™ | www.jocmr.org
648
Glaucoma Diagnostic Testing J Clin Med Res. 2016;8(9):641-649
Financial Support
Canadian Institutes of Health Research (CIHR) Knowledge Synthesis Grant #KRS 91789.
Conflicts of Interest
No conflicting relationship exists for any author.
Author Contributions
S. Ahmed: conception, data acquisition and drafting manu-script; Z. Khan: conception, data acquisition and drafting manuscript; F. Si: team coordination and administration, con-ception, data acquisition, manuscript revising, paper prepara-tion and submission; A. Mao: concepprepara-tion and data acquisiprepara-tion; I. Pan: conception and data acquisition; F. Yazdi: conception, data acquisition and analysis; A. Tsertsvadze: conception, data analysis and revising manuscript; C. Hutnik: conception, data acquisition and interpretation, revising manuscript; D. Mo-her: help with obtaining funding and conception; D. Tingey: conception and revising manuscript; G. Trope: conception and revising manuscript; K. Damji: conception and revising manu-script; J. E. Tarride: conception and revising manumanu-script; R. Goeree: help with obtaining funding and revising manuscript; W. Hodge (guarantor of the paper): obtaining funding, supervi-sion, conception, design; data acquisition, analysis and inter-pretation, drafting article and revising.
References
1. Quigley HA. Number of people with glaucoma world-wide. Br J Ophthalmol. 1996;80(5):389-393.
2. Quigley HA, Vitale S. Models of open-angle glaucoma prevalence and incidence in the United States. Invest Ophthalmol Vis Sci. 1997;38(1):83-91.
3. Tuck MW, Crick RP. The projected increase in glaucoma due to an ageing population. Ophthalmic Physiol Opt. 2003;23(2):175-179.
4. Munier A, Gunning T, Kenny D, O'Keefe M. Causes of blindness in the adult population of the Republic of Ire-land. Br J Ophthalmol. 1998;82(6):630-633.
5. Buhrmann R, Hodge W, Beardmore J, et al. Foundations for a Canadian Vision Health Strategy: Towards Prevent-ing Avoidable Blindness and PromotPrevent-ing Vision Health. Ottawa: University of Ottawa, The Ottawa Hospital - General Campus: Eye Institute, 2007.
6. Quigley HA, Katz J, Derick RJ, Gilbert D, Sommer A. An
evaluation of optic disc and nerve fiber layer examina -tions in monitoring progression of early glaucoma dam-age. Ophthalmology. 1992;99(1):19-28.
7. Medeiros FA, Zangwill LM, Bowd C, Sample PA, Weinreb RN. Use of progressive glaucomatous optic disk change as the reference standard for evaluation of diagnostic tests in glaucoma. Am J Ophthalmol. 2005;139(6):1010-1018.
8. Wollstein G, Garway-Heath DF, Hitchings RA. Identifi -cation of early glaucoma cases with the scanning laser ophthalmoscope. Ophthalmology. 1998;105(8):1557-1563.
9. Kamal DS, Viswanathan AC, Garway-Heath DF, Hitch-ings RA, Poinoosawmy D, Bunce C. Detection of optic disc change with the Heidelberg retina tomograph
be-fore confirmed visual field change in ocular hyperten -sives converting to early glaucoma. Br J Ophthalmol. 1999;83(3):290-294.
10. Bowd C, Weinreb RN, Williams JM, Zangwill LM. The
retinal nerve fiber layer thickness in ocular hypertensive,
normal, and glaucomatous eyes with optical coherence tomography. Arch Ophthalmol. 2000;118(1):22-26. 11. Schuman JS, Hee MR, Arya AV, Pedut-Kloizman T,
Puliafito CA, Fujimoto JG, Swanson EA. Optical coher -ence tomography: a new tool for glaucoma diagnosis. Curr Opin Ophthalmol. 1995;6(2):89-95.
12. Hrynchak P, Simpson T. Optical coherence tomography: an introduction to the technique and its use. Optom Vis Sci. 2000;77(7):347-356.
13. Kee C, Cho C. Evaluation of retinal nerve fiber layer thickness in the area of apparently normal hemifield in
glaucomatous eyes with optical coherence tomography. J Glaucoma. 2003;12(3):250-254.
14. Yamada N, Chen PP, Mills RP, Leen MM, Stamper RL, Lieberman MF, Xu L, et al. Glaucoma screening using the scanning laser polarimeter. J Glaucoma. 2000;9(3):254-261.
15. Choplin NT, Lundy DC. The sensitivity and specificity of
scanning laser polarimetry in the detection of glaucoma in a clinical setting. Ophthalmology. 2001;108(5):899-904.
16. Weinreb RN, Zangwill L, Berry CC, Bathija R, Sample PA. Detection of glaucoma with scanning laser polarim-etry. Arch Ophthalmol. 1998;116(12):1583-1589. 17. Kerrigan-Baumrind LA, Quigley HA, Pease ME,
Ker-rigan DF, Mitchell RS. Number of ganglion cells in
glaucoma eyes compared with threshold visual field
tests in the same persons. Invest Ophthalmol Vis Sci. 2000;41(3):741-748.
18. Quigley HA. Neuronal death in glaucoma. Prog Retin Eye Res. 1999;18(1):39-57.
19. Teesalu P, Airaksinen PJ, Tuulonen A. Blue-on-yellow
visual field and retinal nerve fiber layer in ocular hyperten -sion and glaucoma. Ophthalmology. 1998;105(11):2077-2081.
20. Mok KH, Lee VW. Nerve fiber analyzer and short-wave -length automated perimetry in glaucoma suspects: a pilot study. Ophthalmology. 2000;107(11):2101-2104.
21. Racette L, Sample PA. Short-wavelength automated pe-rimetry. Ophthalmol Clin North Am. 2003;16(2):227-236, vi-vii.
22. Bengtsson B, Heijl A. Diagnostic sensitivity of fast blue-yellow and standard automated perimetry in early glau-coma: a comparison between different test programs. Ophthalmology. 2006;113(7):1092-1097.
longitudinal stereophotographs compared to confocal scanning laser tomography in the LSU Experimental Glau-coma (LEG) Study. Ophthalmology. 2002;109(3):467-481.
24. Chauhan BC, McCormick TA, Nicolela MT, LeBlanc
RP. Optic disc and visual field changes in a prospective
longitudinal study of patients with glaucoma: compari-son of scanning laser tomography with conventional pe-rimetry and optic disc photography. Arch Ophthalmol. 2001;119(10):1492-1499.
25. Haynes RB, Wilczynski NL. Optimal search strategies for
retrieving scientifically strong studies of diagnosis from
Medline: analytical survey. BMJ. 2004;328(7447):1040. 26. Deville WL, Bezemer PD, Bouter LM. Publications on
diagnostic test evaluation in family medicine journals: an
optimal search strategy. J Clin Epidemiol. 2000;53(1):65-69.
27. Moher D, Liberati A, Tetzlaff J, Altman DG. Preferred reporting items for systematic reviews and meta-analyses: the PRISMA statement. J Clin Epidemiol. 2009;62(10):1006-1012.
28. Whiting P, Rutjes AW, Reitsma JB, Bossuyt PM, Klei-jnen J. The development of QUADAS: a tool for the quality assessment of studies of diagnostic accuracy in-cluded in systematic reviews. BMC Med Res Methodol. 2003;3:25.