Master Technical Medicine
Master thesis
The relation between cough sound
characteristics and lung function
Author:
Graduation Committee
Chairman
Prof. dr. ir. H.J. Hermens
Department of Biomedical Signals and Systems
University of Twente, Enschede, The Netherlands
Medical supervisor
Dr. B.J. Thio
Department of Pediatrics
Medisch Spectrum Twente, Enschede, The Netherlands
Medical supervisor
Dr. J.M.M. Driessen,
OCON Sport
OCON, Hengelo, The Netherlands
Technical supervisor
Dr. ir. F. H. C. de Jongh
Engineering Fluid Dynamics
University of Twente, Enschede, The Netherlands
Process supervisor
Drs. P.A. van Katwijk
Master’s programme Technical Medicine
Preface
Before you lies my thesis written to obtain the Masters degree of Technical Medicine at the University of Twente. My thesis started somewhat unconventional, by div-ing in immediately, when I was given the opportunity to include patients for the WEARCON study. I learned a lot and the WEARCON study was the inspiration for the work that lies before you, the WEARCough study.
After long awaited approval of the Medical Ethics Committee Twente, finally my research could begin! Patients were enrolled in this study, for a home monitoring period of 1 week and to finish the study, an exercise challenge test. Data was obtained afterwards and analysis begun.
I was given the opportunity to start working, whilst finishing my research, at the OCON. This proved challenging, combining two different lines of research, switching between topic every couple of days. As to be expected of such a challenge, I learned so much. Starting with how to carry out the enrolment of patients, conducting exercise challenge tests, learn more on how to work as a medical professional, with both parents and children. I also learned a lot about conducting research, obtaining approval of a study by an ethics committee.
I want to thank my graduation committee for guiding me through this process. First dr. Boony Thio; you welcomed me with open arms to your department, even though I only had been an intern under your supervision in my third bachelor internship, years and years ago. I enjoyed our conversations (work and non-work related) and how your door is always open, even though your work schedule needs you to do at least 10 other things at the same time.
I want to thank dr. Jean Driessen, for learning me how to properly conduct an exercise challenge test and how to interpret them. You made Wednesdays feel like a day off, by always making the day interesting and fun. Speaking of FUN, I also want to thank you for your trust in me to guide one of your projects, the FUN study. I want to thank dr. Frans de Jongh, for all his advice and referrals to others, to aid me in my research. Additionally, I enjoyed your critical questions, which led to this end result.
I want to thank drs. Paul van Katwijk, for guiding me through my internships. You gave me (un)solicited advice and guidance in understanding my personality traits and how they affect my work in positive and negative ways.
Additionally, I want to thank all my fellow students, we were with many and always had fun during work. Especially the two guys who have been at the pediatrics
department during my full study; Mati`enne and Pascal. You gave me advice when
Matlabs documentation wouldn’t suffice, allowed me to blow off steam if I was frustrated, gave me the giggles (scissors come to mind) and serenaded the ‘Carnival Festival’ to ruin each others day. You’re welcome by the way, if by the time you’re reading this, it’s stuck in your head again.
I want to thank my family; my parents and Nathalie and Gijs for their support during my studies. It’s been a while, but it’s finished! And of course David, who agreed with being a model for pictures in the medical ethics dossier of my study. Finally I want to thank my boyfriend, Vincent, for always supporting me in every decision I make. For putting things into perspective, when my mind is making a mountain out of a molehill. And for having a secret stash of chocolate somewhere around the house.
I hope you all enjoy reading this thesis,
Abstract
Rationale
Amongst Dutch children, 7-10% suffers from asthma. Asthma treatment should focus on the control of symptoms and the prevention of exacerbations. Self manage-ment is key, however, challenging for children and parents. This is where telemedicine comes in to play. Most telemedicine studies focus on questionnaires or telecommu-nication, which is dependent on the patients perception of the disease. To obtain an objective measurement of asthma, this study explores the feasibility of measuring coughs as an indication of the Forced Experation Volume in 1 second (FEV1).
Differ-ent parameters were explored such as the dominant frequency, Welch periodogram, power and kurtosis, in all phases of the cough, as they may contain relevant infor-mation.
Objective
To investigate the relation between cough sound characteristics and the Exercise Challenge Test induced changes in the Forced Expiratory Volume in 1 second.
Method
Patients who were scheduled for an exercise challenge test (ECT) were recruited to take part in this study. The patients underwent one week of home monitoring, ending the monitoring with the ECT. During the both periods, coughs were mea-sured with the GENEActiv action accelerometer. Lung function was meamea-sured with spirometry. Coughs were measured during the ECT with a smart phone as well, to obtain the full frequency spectrum. Several parameters were derived, such as duration, amplitude, kurtosis and frequency spectrum of the cough.
Results
In this observational pilot study, 16 children were included, of who 5 experienced a decrease in FEV1 during the ECT >10%. A broader interquartile range was found
Discussion
Measuring more patients could reveal trends in asthmatic patients’ coughs, as in this study only 5 patients had a decrease in FEV1 >10%. Future work should focus
on if cough parameters, measured with a standardized protocol during an ECT, are an indication of a decrease in FEV1. If proven valuable, this could be the first step
towards a low-cost method for home-monitoring of asthma.
Conclusion
Acronyms
ACQ Asthma Control Questionnaire
ADAM Automated Device for Asthma Monitoring
C-ACT Childhood Asthma Control Test
ECG ElectroCardioGraphy
ECT Exercise Challenge Test
EIB Exercise-Induced Bronchoconstriction
fs Sampling Frequency
FEV1 Forced Expiratory Volume in 1 second
FVC Forced Vital Capacity
GINA Global Initiative for Asthma
ICS Inhaled corticosteroids
IR Incident Rate
LSA Lung Sounds Analyzer
METC Medical Ethical Committee (in Dutch; Medisch Ethisch
ToetsingsCom-missie)
MST Medical Spectrum Twente
OCON Orthopedisch Centrum Oost Nederland
PA Physical Activity
PAQ-C Pediatric Activity Questionnaire-Childhood
PAQLQ Pediatric Asthma Quality of Life Questionnaire
PEF Peak Expiratory Flow
PPG PhonoPneumoGraph
SABA Short-Acting β2-Agonist
STG Stethograph
VAS Visual Analog Scale
VC Vital Capacity
Contents
Acronyms ix
1 Introduction 1
1.1 The WEARCON study . . . 3
1.1.1 Sound analysis . . . 3
1.2 Research objectives . . . 4
2 Background 5 2.1 The cough . . . 5
2.2 Cough monitors . . . 7
2.3 Sensor selection . . . 8
3 Method 11 3.1 Study population . . . 11
3.1.1 Inclusion criteria . . . 11
3.1.2 Exclusion criteria . . . 12
3.2 Materials . . . 12
3.2.1 Telemetric devices . . . 12
3.2.2 Questionnaires . . . 13
3.3 Study design . . . 13
3.3.1 Home Monitoring Period . . . 13
3.3.2 The Exercise Challenge Test . . . 15
3.4 Data analysis . . . 16
4 Results 19 4.1 Cough sound characteristics and lung function . . . 19
4.2 Agreement between devices . . . 24
4.3 Agreement between voluntary and involuntary coughs . . . 25
4.4 Clinical feasibility . . . 26
5 Discussion 27 5.1 Cough sound characteristics and lung function . . . 27
5.2 Agreement between devices . . . 29
5.3 Agreement between voluntary and involuntary coughs . . . 30
6 Conclusion 33
Bibliography 39
Appendix A Measurement site of the GENEActiv Action 41
Appendix B Method of fixation of the GENEActiv Action 43
Appendix C Questionnaires 45
C.1 The medication form . . . 46
C.2 The GENEActiv Action questionnaire . . . 48
C.3 The Childhood Asthma Control Test (C-ACT) . . . 50
1.
Introduction
Asthma is a chronic inflammatory condition of the lungs.[1] Amongst Dutch children
with an age of 2-12 years, 7-10 % suffers from asthma, as found by the ’Prevention and Incidence of Asthma and Mite Allergy’-study.[2] Engelkes et al. researched
in-cidence and prevalence of asthma by consulting the Integrated Primary Care Infor-mation database, which is used by over 450 general practitioners in the Netherlands for their electronic medical records. They included a study cohort of 176.516 Dutch children who were 5-18 years of age between 2000 and 2012. They reported 23% of the study cohort had specialist confirmed asthma, with an overall incidence rate of 6.7/1000 person-years. The person-years reflect the incidence, expressed in the amount of years subjects are observed. They also found a significant increase in the Incident Rate (IR) of asthma from 2000-2008 and a non-significant decrease from 2008-2012. Nevertheless, in 2008 the Dutch national asthma guidelines were revised, stating that ’infants and pre-school children who wheeze are not necessary asthmatics, but may wheeze secondary to viral infections’. This change in defini-tion may have caused the downward trend, addidefini-tional research is needed to confirm whether this actually is a downward trend.[3] The same cohort was studied by
En-gelkes et al. to retrieve data on the incidence of asthma exacerbations (worsening of symptoms) amongst children. This revealed an overall IR of asthma exacerba-tions 21\1000 person-years and an IR of 41\1000 person-years for children who were receiving asthma treatment. Asthma treatment was defined as at least 1 prescrip-tion for asthma medicaprescrip-tion.[4] In conclusion, a lot of Dutch children are suffering
of asthma, varying from 7-23 %. Additionally, despite asthma treatment, exacerba-tions of asthma still occur.
Asthma is clinically characterised by airway hyper-responsiveness, inflammation of the airways and airflow obstruction. These can cause various symptoms, such as wheezing, shortness of breath, chest tightness and coughing. Symptoms often worsen at night.[1,5,6] They may also occur or worsen due to exercise, viral infection, weather changes, emotional expressions such as laughing or crying, or by the presence of various irritants. Depending on the individual sensitivity, irritants can be animal fur, house-dust mites, fungi, smoke, pollen and airborne chemicals.[5]
Asthma is diagnosed based upon the occurrence of symptoms, the physical exam-ination, the response to asthma treatment and by measurement of the lung function. The latter can be determined by a spirometry, which is highly recommend by the American Thoracic Society. Spirometry requires a forced expiratory manoeuvre in order to obtain maximal flow-volume loops. The Forced Expiratory Volume in 1 sec-ond (FEV1), Forced Vital Capacity (FVC) and the index of both reflects whether a
patient suffers from bronchial obstruction. Furthermore, a Short-Acting β2-Agonist
in-ence of Exercise-Induced Bronchoconstriction (EIB). The test consists of 6 minutes of Physical Activity (PA), in order to reach a heart rate of 80% of the predicted heart rate (with a predicted heart rate of 220−age in years). This ensures a great enough challenge to provoke bronchial (hyper)reactivity.[7] The effect of the exercise should be measured by regular spirometry, comparing the pulmonary function prior to exercise and post exercise (at t= 1, 3 and 5 minutes).[7–9]
After diagnosis, asthma treatment should focus on the control of symptoms and prevention of exacerbations, according to the Global Initiative for Asthma (GINA). Asthma control can be achieved by medicinal treatment (e.g. Inhaled corticosteroids (ICS) and SABA) and by elimination of symptom triggers, such as previous men-tioned irritants. Self-management of asthma is key in order to prevent exacerbations. The GINA advises to monitor Peak Expiratory Flow (PEF) of asthma patients, in order to monitor recovery after an exacerbation or the effect of a change in treat-ment. Long term monitoring of PEF is advised for patients with a poor perception of asthma, with sudden severe exacerbations or when their asthma is difficult to con-trol. In order to achieve good asthma management, regular contact with a health care provider is advised, in order to review asthma control and treatment issues.[6]
This is where telemedicine comes into play.
An extensive review by McLean et al. included 21 studies, describes multiple tele-healthcare systems designed for asthma patients. The majority of these tele-healthcare systems monitor patients through calls, telecommunication (e.g. Skype or email), questionnaires and telemetry devices. However, telemetry devices have been sparsely used. When these devices are employed for monitoring, most used parameters are
the PEF, FEV1 and FVC. These parameters were combined with several validated
questionnaires. McLean et al. came to the conclusion that those who suffer from severe asthma, might benefit from telehealthcare.[10]
1.1
The WEARCON study
In order to obtain an objective method of monitoring of asthma, the WEARCON study has been initiated by Van der Kamp et al. All patients scheduled for an ECT at the Orthopedisch Centrum Oost Nederland (OCON), with an age between 4-14 years were invited to participate in the WEARCON study. The patients were either previously diagnosed with asthma or suspected to suffer from asthma. Prior to the ECT, patients were monitored off-line for 2 weeks. They were equipped with various telemetry devices, namely:
the Actigraph wGT3X-BT activity tracker
the MIR Spirobank II smart spirometer
the eMotion Faros 180°ElectroCardioGraphy (ECG) device
the Cohero Health smart inhalers.[11]
Patients’ activity was monitored for the full time span of 2 weeks, by the activity tracker. Besides an accelerometer, the activity tracker also includes a lux (light) sensor, in order to obtain objective information on time spend outside. Patients were instructed to perform a FVC-spirometry before and after PA or when they were experiencing more symptoms then usual. During the two week period, the ECG device has been worn for 2 consecutive days, of which at least one day with intense PA. The smart inhalers were used during the two week period to monitor the use of aerosol inhalers, which counted the amount of doses of ICS and SABA inhaled. Patients were asked to fill in questionnaires with regards to their activity and their asthma on a weekly basis. The questionnaires included the Childhood Asthma Control Test (C-ACT), the Pediatric Asthma Quality of Life Questionnaire (PAQLQ) and the Pediatric Activity Questionnaire-Childhood (PAQ-C). After the monitoring period, the patients were separated into controlled and non-controlled asthma groups based upon their ECT results.[11]
The preliminary results of this study (n=25 patients) revealed a significant dif-ference between groups when comparing the recovery time after intense PA of both heart rate recovery time (p=0.05) and respiratory rate recovery time (p<0.01). Both parameters were derived from the ECG. More results are to be expected, as a control group of 30 healthy subjects also were monitored in order to carry out multivariate analysis of the measured parameters.[11]
1.1.1
Sound analysis
Though the WEARCON study monitored the majority of symptoms of asthma,
there has not been a focus on either coughing or wheezing. Both are however
common in asthma, but, specificity is low.[5,12] Besides an increase in coughing, it is
also well known in clinical practice that cough sound changes due to diseases such as asthma.[13,14] Piiril¨a and Sovji¨arvi showed as early as in 1989 that a (statistically
caused by bronchitis. These differences were however based on case reports.[13] Rietveld et al. evaluated coughing during both challenge tests. They included 30 children (age 7-17 years), with and without asthma, which underwent an ECT. Their results included that the children with asthma coughed significantly more when comparing them to their healthy peers. However, while coughing being fairly sensitive for asthma, the specificity of coughing as a predictor for asthma was low. They also did not take cough features (temporal and spectral) into account and only reviewed the amount of coughs during the challenges in comparison to the lung function.[16] Despite extensive literature research, no articles have been found
describing the differences in cough features while performing an ECT.
1.2
Research objectives
This introduces the primary objective of this study;
To investigate the relation between cough sound characteristics and the Exercise Challenge Test induced changes in the Forced Expiratory Volume in 1 second.
As a final end goal, the measurement device could be implemented in home-monitoring to assess paediatric asthma control. Besides the primary objective, the perception of asthma control and its relation to cough sounds is also a field of interest in this study. This leads to the following secondary objectives of this study;
To explore the agreement between the wearable device and sound recordings.
To assess the agreement between the characteristics of voluntary coughs and involuntary coughs, measured in a clinical environment.
2.
Background
2.1
The cough
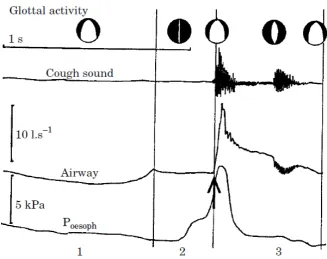
Coughs can be divided into two types; laryngeal or tracheobronchial cough. The laryngeal cough is initiated when foreign material has been aspirated. On the con-trary, the tracheobronchial cough is initiated distal to the larynx. The latter cough can be voluntary. Each cough consist of three phases, an inspiratory, compressive and expiratory phase. The inspiratory phase allows air to flow into the lungs. Then the compressive phase is initiated, in which the glottis closes. This allows for a high intrathoracic pressure to build up, up to 300 mmHg in adults. Finally, the expiratory phase will start with opening of the glottis. A supramaximal expiratory flow due to the build up of pressure is released. This period of high flow lasts from 30-50 ms. Since the glottis is still open, the residual pressure will result in a lower expiratory flow. This will last for a longer period of time, from 200 to 500 ms. The high expiratory flow allows for clearance of debris in the airways. The mechanical action generated from the cough also results into clearance of the lung periphery.[17] The audible part of the cough, starting at the compressive phase and ending with the expiratory phase, is known to have two or three phases.[13,18] Thorpe and
colleagues have described these different phases within cough in asthmatic patients;
1. the end of the compressive cough phase, of which the sound is generated from sudden opening of the glottis
2. a continuous, noisy phase
3. the second cough, due to closing of the glottis.[18]
Korpas et al. measured simultaneously with the cough sound, the air flow and airway pressure as seen in Figure 2.1. In Figure 2.1, the three different phases are clearly distinguishable.
The sound of the cough is dependent on the large airways and laryngeal struc-tures. Turbulent flow through these structures while expiration creates the cough sound. This leads to the idea that coughs are individualised, just like ones voice.[17]
2.2
Cough monitors
The registration of coughs per unit of time has been an area of interest for a long time. An up to date review is given of current automated lung sound analysis (such as wheezing, crackles and rhonchi) devices by Pramono et al. in 2017. They included an overview of the following devices;
the Wheezometer and Wholter (Respiri (former Karmelsonix), Melbourne,
Australia),
the Vibration Response Imaging (VRI) system (Deep Breeze, Or-Akiva,
Is-rael),
the Lung Sounds Analyzer (LSA)-2000 (Kenz-Medico, Saitama, Japan)
the LEOSound (L¨owenstein Medical GmbH & Co., Bad-Ems, Germany),
the Stethograph (STG) (Stethographics Inc., Boston, USA).[20]
The CoughCOUNTTMtechnology is implemented in both the Wheezometer and
Wholter, the LSA-2000 makes use of an electret condenser microphone and the VRI is a device which consists of 40 piezo-elements.[20–22] The basic principle of the sensor used in the LEOSound was not described in literature, they describe their sensors as ’bioacoustic sensors’.[23–25] As the name implies, the STG makes
use of electronic stethoscopes to capture lung sounds.[26] None of these are however suitable for home monitoring: Wholter, VRI, LSA-200, LEOsound and STG are all relative large devices, which are not portable or meant to be used by patients. The Wheezometer is a hand-held device which measures for 30 seconds, making it unsuitable for continuous monitoring.[20,27]
A relatively new device shows more promise for home-monitoring; the Automated Device for Asthma Monitoring (ADAM). The ADAM is a small device, which con-sist of an iPod in order to store data and a lapel microphone (the specifics of this microphone were not found in literature).[28,29] The device has been validated for
adolescents (n=42, mean age of 15.2 years (1.5)) with asthma. The developed algo-rithm to detect coughs should be improved, whereas the sensitivity of the detection of coughs yielded 70%. This translates to two false positive identified coughs per hour.[28]However, the amount of coughs per day counted by the ADAM still displays a significant correlation with measured FEV1, FVC and the Asthma Control
Ques-tionnaire (ACQ).[30] The ADAM might be a good solution for home-monitoring for
2.3
Sensor selection
As illustrated in Section 2.2, several different sensors have been used to register cough; acoustic microphones, accelerometers and piezoelectric elements. The first is not a sensor of interest to this study as acoustic microphones invade the privacy of patients. Furthermore, they will intercept all auditory signals, such as background noise but also other subjects beside the patient will be recorded. It would require filtering to diminish the background noise. In order to combat the invasion of privacy, a smart system could be developed, which would detect when a patient is speaking prior to start the recording. However, using a different type of sensor was considered more feasible for this study.
In order to be able capture the frequency spectrum of cough sounds, a sensor needs to be chosen with a suitable Sampling Frequency (fs). Olia et al. measured
cough of 24 healthy subjects, with a mean age of 30 years. They used a microphone with a frequency response of 20 to 12000 Hz. Subjects were asked to inhale until they reached their Vital Capacity (VC) and then produce a cough. A mean frequency of the obtained coughs of 400 Hz was found.[19] Therefore, to obtain the frequency spectrum of a cough, a sensor should be chosen with a fs of at least 1000 Hz, to
prevent aliasing.[32]
An overview is given in Table 2.1 of accelerometer or piezo-electric based sen-sors, which have been used previously in literature to detect lung sounds. Earlier described systems, as mentioned in Section 2.2, are included. Other frequently used sensors in lung sound analysis are also enclosed in Table 2.1, such as the Knowles electronic sensors.[33–35] Furthermore, the sensors used by the group of Pasterkamp
and Kraman have been included in the overview, which were one of the first sensors used in lung sound analysis.[36,37]
The final goal of the system is to be implemented into home monitoring. There-fore, the used sensor should meet a couple requirements:
the sensor should be piezoelectric or accelerometer based, to secure the pa-tients’ privacy
the sensor should be wireless, to ensure maximum wearing comfort
the sensor should have the memory capacity to save data for a long period of time (12 hours)
the sensor should have a sufficient Sampling Frequency (≥1000 Hz)
the sensor should be easy to affix
the sensor should be safe to wear by children.
The sensors which are described in previous paragraphs and in Table 2.1 do not meet these requirements or are no longer available (such as the Pulmotrack and PhonoPneumoGraph (PPG)). Therefore the available wireless sensors of the WEARCON study were also taken into consideration. Unfortunately the ActiGraph
and eMotion Faros ECG device both have an accelerometer with a fs of 100 Hz
Type Sensor Sensitivity range Sample frequency (fs)
Size (mm)
A BU-1771 & BU-3173,
Knowles Electronics[38]
20 Hz - 10 kHz - 8 × 6× 4 *
A PPG 201,
PPG[36,37]
100 Hz - 4 kHz - 28 × 8†
A EMT 25C,
Siemens[36,37]
100 Hz - 1 kHz - 28 × 13†
A 180°eMotion,
Bittium[39,40]
- 100 Hz 48 × 29 × 12
*
A ActiGraph
wGT3X-BT,
Actigraph[41]
- 100 Hz 46 × 33 × 15
*
P 21050,
Hewlett-Packard[36]
- 14 × 26†
P VRIxp,
Deep Breeze[22]
50 Hz - 0.4 kHz - Covers the
full back of the patient
P Pulmotrack,
KarmelSonix[42]
80 Hz - 2.4 kHz -
-Table 2.1: Overview of several sensors used in lung sound analysis.
A - accelerometer, P - piezoelectric sensor. *length × width × height,
†
diameter × height.
12 consecutive hours at a fs of 1000 Hz.[43] The GENEACtiv Action was attached
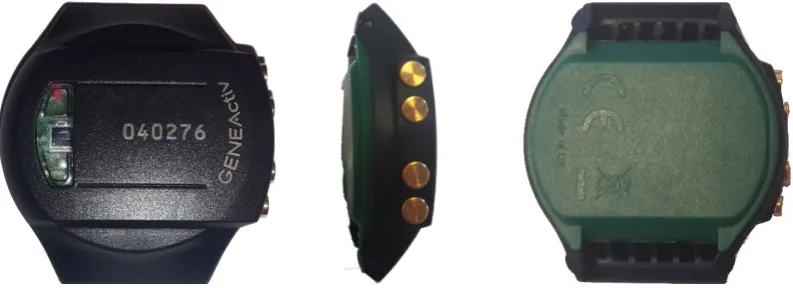
in a non-conventional way. The device needed to be attached as close to the source of the coughs as possible. To be able to achieve this, the straps were removed and edges on the back of the device were melted down. This created a smooth contact surface, as shown in Figure 2.2. After a small trial including 5 healthy adults, the measurement site was selected. This is the sternocleidomastoid region, an in depth overview of the trial can be found in Appendix A. This trial also lead to the method of fixation, which is described into further detail in Appendix B.
The fs of 100 Hz might however be sufficient in order to function as a cough
counter. In 1996, Korpas et al. gave an overview of the analysis of cough sound. They demonstrated that cough also holds frequencies≤ 100 Hz.[13] Similar findings are present in the work of Amoh and Odame.[44] The frequency range of other lung
sounds are also known, a compact overview is given by Pramono et al. Normal lung sounds, such as vesicular, bronchial, tracheal all have a frequency range with a minimum of a 100 Hz. Abnormal lung sounds, such as wheeze, stridor and crackles
are all high frequency sounds, with a pitch ≥ 350 Hz. Only rhonchi have a low
[image:21.595.75.484.68.387.2]Figure 2.2: The GENEActiv Action as employed in this study. Straps of the device
were removed, resulting in a wearable with the dimensions of 43mm × 40mm ×
3.
Method
This study was carried out as a part of the WEARCough study (NTR7329, NL65431.044.18). After receiving approval of the Medical Ethical Committee (in Dutch; Medisch
Ethisch ToetsingsCommissie) (METC) (on 31-07-2018) and the board of directors of the Medical Spectrum Twente (MST) (on 29-08-2018), patients who are routinely scheduled for an ECT at the OCON were approached to participate in the study.
3.1
Study population
As stated in Section 1.1, no literature was found regarding the differences in cough features while performing an ECT. Peduzzi et al. illustrated that at least 10 cases per event per group are required if the effect size is unknown.[45] However, since
patients were recruited and monitored prior to the ECT, an uneven distribution was to be expected. Taking this into consideration, the intended sample size of the WEARCough-study was to recruit 30 patients, to have at least 10 patients in both the controlled and uncontrolled group.
3.1.1
Inclusion criteria
In order to be eligible to participate in this study, a subject must meet all of the following criteria:
Children with paediatrician diagnosed asthma, or children whom are suspected to suffer from asthma, based on reported symptoms, atopy and physical ex-amination performed by a physician.
Children aged between 4 and 14 years old.
3.1.2
Exclusion criteria
A potential subject who meets any of the following criteria will be excluded from participation in this study:
Children who are unable to speak Dutch, or whose legal guardians are unable to speak Dutch.
Children for whom it is not possible to wear all wearables. For example due to severe skin disease.
Children with implanted electrical stimulating devices.
Children with a known band-aid allergy.
Children with psychomotor retardation.
Children with chronic diseases (other than asthma).
Children whom were born prematurely (≤ 37 weeks), since this could lead to underdevelopment of the lungs.[46] This is considered to be a confounder for this study.
3.2
Materials
3.2.1
Telemetric devices
Several telemetric devices were used during the home monitoring period. The ma-jority of the devices were already available due to the previous implementation of the WEARCON-study. The devices were chosen for that study based on several criteria; their availability, their user friendliness, the capacity of their memory (which effects the monitoring time) and the quality of the device and its’ data.[11] The following
devices were already made available for this study;
The ActiGraph wGT3X-BT activity tracker, to monitor PA and sleep
pat-tern.[47]
The MIR Spirobank ® II smart spirometer, to obtain Flow-Volume loops.
The Biomation eMotion Faros 180°ECG, to monitor the heart rate.
GENEActiv Action
To register coughs, the GENEActiv Action has been chosen. This device has been chosen due to it’s high sample frequency and size. It measures continuously for 12 hours with a fsof 1000 Hz. After removal of the straps, the dimensions of the device
yield 43mm×40mm×13mm and it weighs 16 grams. A more in depth description
3.2.2
Questionnaires
Subjects were requested to fill in several questionnaires; the C-ACT (Appendix C.3) and PAQLQ (Appendix C.4), which reflect their perception of their asthma. Patients were also requested to fill in a questionnaire with regards to their medication use (Appendix C.1). A new questionnaire was designed to monitor the experience of wearing the GENEActiv Action in a non-conventional way (Appendix C.2).
3.3
Study design
3.3.1
Home Monitoring Period
Subjects received the devices accompanied by an instruction of use, one week prior to the ECT. Subjects and parents were informed how to attach the wearables and how to use the portable spirometer. The devices did not show interpretable data to the subjects.
Patients wore the GENEActiv Action accelerometer to monitor coughs.[43] The
monitoring period was divided in 4 periods of 12 hours, of which 2 periods took place during the day when a child will engage in planned sports or PA. The other 2 periods took place during the night, since asthma symptoms are prone to worsen overnight. Patients were instructed to have at least 12 hours between the measurement periods. To fit wearing the device in their daily routine, patients were allowed to wear the device an hour less if this suited their routine better. This way the device could be attached/detached early in the morning after wakening and in the evening when changing into pyjamas.
The Actigraph activity tracker was worn for one week to determine the activity level of the subject and to determine when coughs occurred.[41] The activity tracker
was worn in different positions. During the day, the activity tracker was worn at the hips to measure activity. During the night, the tracker was be worn at the wrist to measure sleep. The change of measurement site has been chosen since each parameter (activity and sleep) has a different measurement site which is considered to be the golden standard.[48,49]
PA is considered to be a confounder for this study, since PA is cough provoking. The subjects wore an Actigraph activity tracker to monitor this confounder. Addi-tionally, the activity tracker provides algorithms to determine whether patients were awake or asleep. Synchronization of the GENEActiv Action and the Actigraph to one laptop allowed for determination for when coughs occurred, whilst sleeping or being awake.
Figure 3.1: The set-up of the home monitoring period.
Figure 3.2: The adjusted Exercise Challenge Test protocol with the addition of vol-untary coughs on different time instances. Lung function and coughs are monitored prior and post exercise, and post administration of a SABA.
3.3.2
The Exercise Challenge Test
A thorough medical history was obtained from each patient prior to the ECT, which is carried out at the out-patient clinic at the OCON in Hengelo. Medical history included medication adherence, symptoms, the presence of allergies, if patients were born prematurely and the familiar occurrence of asthma and allergies in the first and second degree. The presence of allergic signs, such as Dannie-Morgan lines and Meyers nasal crease was checked during the physical examination.
The GENEActiv Action was worn during the ECT to register coughs. Addi-tionally, an audio recording was made by using a Samsung S5 mini telephone. The Faros eMotion was worn to determine exercise intensity in retrospect based upon the heart rate. This device also includes an 3D accelerometer with a fs of 100 Hz,
of which its data is analysed for its properties as a cough counter.
The ECT was carried out conform the guidelines of the American Thoracic So-ciety, with an adaptation for children ageing 4-7 (jumping on a bouncing castle to provoke asthma, since running on a treadmill is not feasible for this age group) as described by van Leeuwen et al.[7,8] All involuntary coughs were registered during
the ECT, voluntary coughs were implemented in the ECT protocol. The patient was requested to cough prior to the exercise, immediately after exercise, 3 and 6 min-utes after exercise and after the administration of SABA. An overview of the ECT protocol including the coughs is given in Figure 3.2. The fall and rise of the FEV1
3.4
Data analysis
Prior to analysis, the data of all three devices were synchronised by using differ-ent methods. The audio from the telephone and GENEActiv were synchronised by identifying the tapping sounds created prior to the measurement. For precise synchronization, the data of the GENEActiv was up-sampled to the same fs in both
devices. Then, the exact period of tapping was identified. With the xcorr-function in MATLAB, the delay between the two tapping periods was determined. The GE-NEActiv and the ECG-device were synchronised by instructing the subject to jump up and down 3 times. Since both devices contain a 3D accelerometer, the up and downwards motions of the jumping can be identified. After selection of the period of jumping up and down, the delay between the two devices was also determined by using the xcorr-function in MATLAB. Then, drift was removed from the audio signal from the telephone by a 2nd order highpass Butterworth filter, with a cutoff frequency of 5 Hz. Finally, coughs during the ECT were identified in the telephone data.
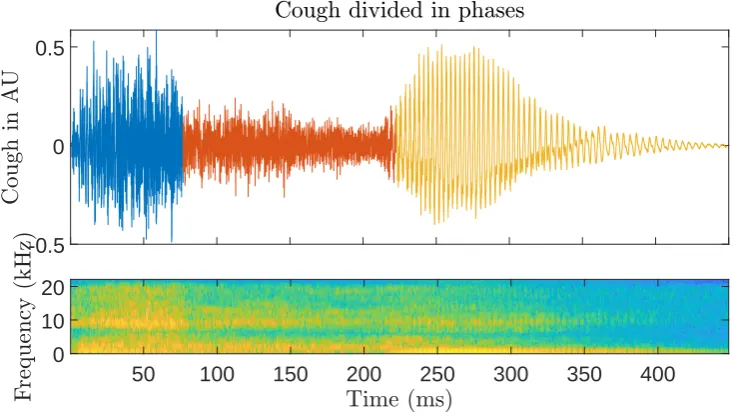
Similar to Thorpe et al. and Olia et al., the three different phases of the coughs were identified.[18,19] The identification of the different phases was carried out by
[image:28.595.122.490.464.672.2]using MATLABs changepnts-function, which identifies when a signal changes most significantly. This change was identified by using two different settings, one which returned the points of change based on the root-mean-square of the signal, the other based on the standard deviation of the signal. After calculation of these points, the correct points were confirmed by comparing the placement of the points to the spectrogram of the cough, which visualizes the frequencies within the signal over time. Then, the cough was divided in three or two phases. An example is given in Figure 3.3.
-0.5 0 0.5
50 100 150 200 250 300 350 400
0 10 20
After the selection of the coughs and their phases, the following parameters were derived; the maximal amplitude, duration, kurtosis, skewness, root-mean-square and the power. A normalized version of both the maximal amplitude and duration were calculated, based on the first phase. Skewness and kurtosis are both statistical parameters, both compare the measured data to a normal distribution. Skewness reflects how much the peak of a signal deviates from the centre. Kurtosis reflects the ‘peakedness’ of a signal, whereas a kurtosis of 3 is the amount of kurtosis for a normal distribution.[50] Then the Welch periodogram was created with a frequency
resolution of 120 Hz. This allowed a sufficient resolution for analysis, without the window being too long for the relative small parts of cough data. Subsequently, the power of the full frequency domain was determined, together with the dominant frequency and it’s corresponding power.
4.
Results
Patients were recruited between September of 2018 - February 2019. A total of 13 patients were included in the WEARCough-study, of whom 6 also participated in the home-monitoring period. One of the subjects dropped out of the study. An additional 6 patients were measured at the OCON, of which 4 displayed hyper-responsiveness to PA during the ECT. The additional patients were registered under the name of ‘Extra’ with a number, in order to prevent confusing their data with the data of the WEARCough-study. This brings the total measured children during the ECT to 16, an overview of patients characteristics is given in Table 4.1.
4.1
Cough sound characteristics and
lung function
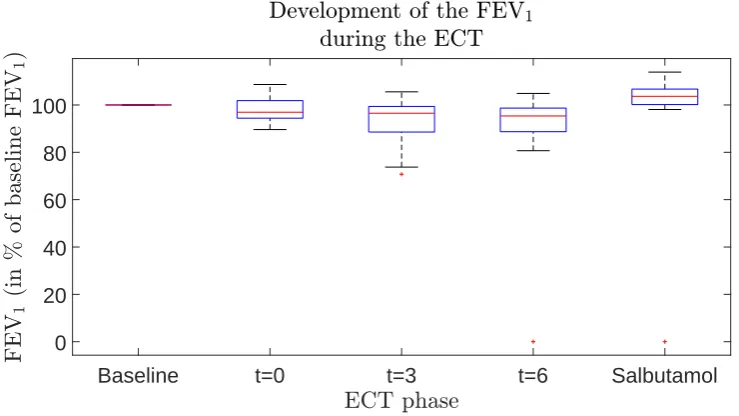
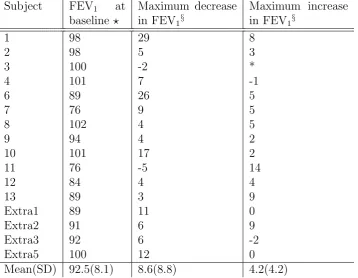
The FEV1 measured during the ECT is given in Table 4.2. A total of 5 subjects
displayed a FEV1 decrease larger then 10 %. The development of the FEV1 during
Baseline t=0 t=3 t=6 Salbutamol 0
[image:33.595.87.457.109.317.2]20 40 60 80 100
Figure 4.1: The development of the FEV1 during the ECT. The FEV1 is expressed
in the percentage of baseline, to be able to compare patients of different sex, age, length and weight.
Baseline t=0 t=3 t=6 Salbutamol
-2000 0 2000 4000 6000 8000 10000
[image:33.595.76.456.467.663.2]Baseline t=0 t=3 t=6 Salbutamol 0
[image:34.595.121.491.122.329.2]0.02 0.04 0.06 0.08 0.1 0.12
Figure 4.3: The development of the power of the Welch periodogram, of the first
cough phase, during the ECT.
Baseline t=0 t=3 t=6 Salbutamol
4 6 8 10 12
[image:34.595.128.491.485.692.2]Subject FEV1 at
baselineb
Maximum decrease in FEV1§
Maximum increase in FEV1§
1 98 29 8
2 98 5 3
3 100 -2 *
4 101 7 -1
6 89 26 5
7 76 9 5
8 102 4 5
9 94 4 2
10 101 17 2
11 76 -5 14
12 84 4 4
13 89 3 9
Extra1 89 11 0
Extra2 91 6 9
Extra3 92 6 -2
Extra5 100 12 0
[image:35.595.70.429.227.505.2]Mean(SD) 92.5(8.1) 8.6(8.8) 4.2(4.2)
Table 4.2: The FEV1 during the ECT. The predicted lung function was based on
GENEActiv Action data Mean (SD)
Telephone data
Mean (SD) p-value
Skewness -0.423 (1.017) 0.200 (0.312) p<0.000
Kurtosis 8.005 (7.692) 8.142 (4.316) p=0.061
Dominant
frequency (Hz) 83 (96) 535 (434) p<0.000
Power of dominant frequency
(arbitrary units)*
3.8 · 10-4
(9.5 · 10-4)
5.0 · 10-5
(6.3 · 10-5) p<0.000 Total power in
[image:36.595.101.488.70.233.2]frequency domain 0.015 (0.028) 0.015 (0.016) p<0.005
Table 4.3: Comparison of the parameters derived from both the GENEActiv Action
and the telephone, a total of 135 paired coughs were analysed. p<0.05 is statistically significant. * in the frequency domain
4.2
Agreement between devices
After synchronization of the data, several parameters were derived from both the GENEActiv Action and the telephone recordings. The duration of the cough was based solely on the audio recording, therefore, duration of the cough was not com-pared between devices. Since the data is in different units, m/s2 versus arbitrary
units of the telephone, the majority of the data in the time domain was not com-pared. It was also found that several GENEActiv Action datafiles were corrupt after downloading, leaving a total of 135 paired coughs to analyse. Both voluntary and involuntary coughs were included in this analysis. The parameters that were analysed were the skewness, kurtosis, the dominant frequency and it’s companying power and the total power of the Welch periodogram. Then, data was analysed by SPSS (IBM Statistics Version 23). First data was visually inspected by creating histograms, then normality of the data was tested by the Shapiro-Wilk test. It was found that all parameters were statistically significant (p<0.05), therefore, all parameters are not normally distributed.
Amount of coughs
Subject 6 4
Subject 9 1
Subject 12 29
Extra 1 2
[image:37.595.195.370.70.157.2]Extra 2 3
Table 4.4: Amount of involuntary coughs exerted during the ECT.
. Voluntary coughs Mean (SD) (n=144) Involuntary coughs Mean (SD) (n=39) p-value
Duration (ms) 32.296 (10.743) 30.205 (12.049) p=0.501
Root-mean-square
(arbitrary units) 0.116 (0.052) 0.039 (0.023) p<0.000
Total power in time
domain (arbitrary
units)
0.026 (0.015) 0.009 (0.008) p<0.000
Skewness 0.220 (0.277) 0.143 (0.354) p=0.097
Kurtosis 8.030 (4.845) 9.760 (3.606) p<0.000
Dominant frequency
(Hz) 399 (149) 527 (493) p=0.753
Power in frequency domain of dominant frequency (arbitrary units)
6.605· 10-5 (6.307·
10-5)
9.142· 10-6 (1.269·
10-5) p<0.000
Total power in fre-quency domain (ar-bitrary units)
0.017 (0.014) 0.002 (0.002) p<0.000
Table 4.5: Comparison between voluntary and involuntary coughs. p<0.05 is statis-tically significant.
4.3
Agreement between voluntary and
involuntary coughs
[image:37.595.68.487.218.517.2]4.4
Clinical feasibility
5.
Discussion
In this study, it was found that the majority of the derived cough sound parameters displayed no relation to the decrease and increase of FEV1 of children who were
suspected to suffer from asthma.
5.1
Cough sound characteristics and
lung function
It was hypothesized that the ECT would have an effect on both the frequency com-ponents of the cough, and the power of the cough. As previously mentioned, an ECT can induce EIB. Two different pathways describe in literature the working mecha-nism of EIB. One of the mechamecha-nisms proposes that vasoconstriction is induced by airway cooling. The vasoconstriction in turn leads to reactive hyperemia and edema after exercise. In this hypothesis, the bronchoconstriction is a reaction caused by the vascular events. The other hypothesis proposes that dehydration of the airways increases the osmolarity of the airway surface liquid. It is proposed that this hyper osmolarity results in the release of mediators, which in turn induces contraction of the airway smooth muscle cells. This contraction leads to airway narrowing. Fur-thermore, these mediators could also induce transient edema, which amplifies airway narrowing. Additionally, the increase in osmolarity leads to glandular secretion of mucus, resulting in cough.[52] Since more mucus is produced, it was expected that this would have an effect on the frequency (in Hertz) of the cough. Furthermore, the constricted airways could also influence the frequency of the cough, since the diameter of the airways becomes smaller and the wall tension becomes higher. The induced EIB is measured by a decrease in FEV1. The decrease in lung function could
influence the power of the cough, resulting in a smaller cough amplitude when mea-sured in the time domain. This is in line with what is known in clinical practice.[13,14] In this work, the coughs were measured by a holding the phone close to the patients mouth, to obtain the coughs. However, when one assumes that the sound of the cough is in an open area, the intensity decreases by the inverse square of the distance (I ∝ 1
r2).[53] Therefore, the measurement method used for the WEARCough study
introduced an uncertainty when it comes to measuring the intensity of the cough sound, since the distance might not be uniform in all measurements. The measure-ment protocol was always carried out by one researcher, however, recordings by a lapel microphone versus the telephone would have standardized the measurement.
It was found, as depicted in Figure 4.3, that the power of the Welch periodogram was lower at three minutes after exercise, of the first cough phase. At three minutes after exercise, the majority of the patients also displayed their lowest FEV1, as shown
as seen in Figure 4.2. This dominant frequency at zero minutes after exercise was significantly higher then the baseline measurement (p <0.05). It is hypothesized that this is caused by the induced EIB, the airway narrowing and that the amplified mucus production might influence the dominant frequency. The dominant frequency
might act as a precursor of the to be expected drop in FEV1. The higher pitch
however may be due to a higher respiratory rate after exercise. It is hypothesized that when the respiratory rate goes up, faster vibrations are created by the higher flow in the glottis. This could in term result in a higher dominant frequency. The pitch however might also be influenced by the age of subjects, which could not be excluded due to the broad variety of the age (see Table 4.1). A sub-analysis could neither dismiss nor confirm whether age is a confounder for the dominant frequency. Additionally, the same sub-analysis was performed to explore if gender is a confounder for the dominant frequency. This sub-analysis also could not confirm if gender plays a role in the dominant frequency. However, literature suggests that the pitch is depended on gender, which contradicts the outcomes of the study.[54]
This might be due to the small sample size of the WEARCough-study.
In this work, a lower kurtosis after salbutamol for the full cough duration was found, as shown in Figure 4.4. This is in contrast to the work of Thorpe et al. They compared the kurtosis of the second cough phase from asthmatic to non-asthmatics. They reported a negative kurtosis of -13 for asthmatics versus 50 for healthy subjects (p<0.05). The trend shown in Figure 4.4 does not correspond to their findings. In contrast to Thorpe et al., the kurtosis of the full cough was given in Figure 4.4. Additionally, the comparison can only be made after salbutamol and not in comparison to healthy subjects. Also, in the work of Thorpe et al, asthmatics displayed a drop in PEF ranging from 17-75% compared to baseline. The included patients in this study displayed a drop in FEV1 ranging from an actual increase in
lung function to a maximum of 29%. In conclusion, Thorpe reported cough sound characteristics of patients with a greater drop in lung function.[18]
No trends were found on the duration of the coughs, however, based on the work of Piiril¨a ands Sovji¨ardi, it was expected that the duration of the cough sound
would increase due to the induced bronchoconstriction. Furthermore, they also
found that the upper limit of the frequency band was significantly lower in asthma, in comparison to chronic bronchitis and tracheobrochial collapse syndrome.[15] Due
to the lack of a control group in the WEARCough study, this comparison could not be made.
More recent work of Abaza et al. created a cough classifier for lung diseases. They compared their cough classifier, which was based upon features of both cough sound and airflow during cough, to the diagnosis of pulmonary physicians. In their study, 3 coughs of 112 subjects were analysed, analysis for males (n=58) and females (n=54) were carried out separately. Of the male disease coughs, 94% of the coughs were classified correctly when comparing them to the physicians diagnosis. For females, the system was able to classify 90 % of the disease coughs correctly. Though they did report which parameters were derived from the cough sound, they did not report which parameters were most valuable in their model.[55] Additionally, coughs
were not obtained while asthma responses were provoked, such as during exercise or during the inhalation of histamines.
30 asthmatic children and adolescents to 30 healthy subjects. All children with
asthma displayed a decrease in FEV1 of at least 10%. This study only involved
involuntary coughing.[16]Therefore it was expected for the WEARCough study that
the children who had a decrease in FEV1 of at least 10 %, would experience more
involuntary coughing. This was not found, when comparing the FEV1 in Table 4.2
with Table 4.4. Only 2 out of 5 subjects who coughed involuntarily had an EIB
>10%. The contradiction between this work and the work of Rietveld could be
caused by the small sample size of this study. Additionally, there was no healthy control group measured in the WEARCough study.
5.2
Agreement between devices
It was found that the GENEActiv Action data was not comparable to the audio recordings, as shown in Table 4.3. Based on the work of Paul et al., it was hy-pothesized that the GENEActiv Action could be a sufficient device for monitoring of coughs. They compared their accelerometer measurements to video recordings. Two investigators scored the amount of coughs exerted on both recordings, the correlation coefficient was determined per investigator. They found a correlation coefficient between the different recordings of at least 0.918 (p <0.05).[33] Paul et al., and their predecessor Pavesi et al. did however not enclose the used fs of
their accelerometer, which can have a fs up to 10 kHz, as previously mentioned in
Section 2.3.[33,56] Therefore their accelerometer could have been able to measure a broader frequency range. Additionally, they measured their audio recordings at the suprasternal notch, which was not feasible in this study. Finally, Paul et al. did not compare the frequency components between devices, they only compared the amount of coughs measured.[33] Using an accelerometer as cough counter induces only the
requirement of being able to distinguish coughs from other sounds. Whereas when an accelerometer is employed to substitute measurements recorded with a micro-phone, maintaining the majority of the frequency components is considered to be more challenging.
A great advantage of the use of the GENEActiv action was that privacy of the patient was ensured, since the measured acceleration data only reflects a small part of the frequency spectrum of a sound. This also introduces a great disadvantage; due to sound absorption of the body and the relative low fs, the characteristics of
5.3
Agreement between voluntary and
involuntary coughs
Though Chang describes that the mechanical pathway to exert a cough is identical for voluntary and involuntary coughs, it was found that only the duration, skewness and dominant frequency did not differ (p>0.05, Table 4.5).[17]However, since not all patients exerted involuntary coughs, the involuntary coughs only contain coughs of 5 patients. Furthermore, out of the 39 involuntary coughs, 29 coughs were exerted by one patient (see Table 4.4). Matching the involuntary coughs to voluntary coughs, based on when they were exerted, was not deemed feasible. The majority of the coughs exerted by subject 12 occurred after the inhalation of salbutamol. Therefore, matching these coughs to voluntary coughs would imply comparing them to coughs which occurred up to 3 minutes before or 3 minutes after the involuntary cough occurred. This was considered to be too different to be able to make a comparison.
5.4
Clinical feasibility
During the course of this study, it became clear that participation in this study was lower than expected, based on the inclusion rate during the previous WEARCON study. Patients and parents did not feel comfortable to participate in the study since the cough monitoring device was worn visibly in the neck area. This caused resistance to wearing the device in a home environment. An amendment was written; if a patient did not want to participate because of the home monitoring period, they were offered the option to participate in the trial only during the ECT. The
amendment was approved by the METC Twente on the 9th of January 2019. Once
5.5
General remarks
During this study, a small amendment in the measurement protocol was made. Instead of asking children to cough immediately when they step off the treadmill or bouncing castle, the children were asked to cough a few seconds later in the office. This change has been carried out to eliminate the background noise which was constantly present in the cold exercise lab, due to the air conditioning.
In Section 3.3.1 a home-monitoring period has been described. This data has not been analysed up to date, since up to this point, it would not be clinically relevant. A small pilot study has been carried out by a student of Technical Medicine for a 10 week intern-ship, defining if the GENEActiv Action was capable of distinguishing between coughs and shouting, spoken words, laughter etcetera. Several parame-ters were selected to be derived from both measured audio by a telephone and the GENEActiv Action, e.g. duration, signal energy, skewness and root-mean-square. The audio was used to label each sound for automated sound classification. Several machine learning algorithms were evaluated for the automated classification. It was found that subject specific training for the learning algorithm gave an accuracy of 88% for measurements carried out with healthy children.[57] The home-monitoring
data could be analysed with a similar method, using the ECT data for the learning part of the model, subsequently classifying the home-monitoring data.
5.6
Future work
Future work should focus on if cough parameters, measured with a standardized protocol whilst provoking EIB, are indicative of bronchoconstriction. Since no com-parison in this work could be made to a healthy population, it is yet unknown whether the observed trends (as shown in Section 4.1) are indicative of asthma or if these are healthy behaviour. Additionally, at the moment it is still unclear if patients with a severe drop (>25%) in FEV1 display different behaviour in
compar-ison to stable asthmatics, since only 2 patients in this study experienced this during the ECT (Table 4.2). Measurement of a larger population of both asthmatic and healthy subjects would also attribute to the quality of the research. When the spe-cific parameters of cough sound indicating severity of FEV1 decline are identified in
6.
Conclusion
In this work, no relation between cough sound parameters and changes in FEV1
was found. Home-monitoring with the GENEActiv action was feasible, however, preliminary analysis reveals that the device was not sufficient to replace sound data captured with a telephone. After the addition of more patients who do display an FEV1 drop during the ECT, the monitoring of coughs might be clinically relevant.
The power of a cough could be indicative of FEV1, since the measurement of this
Bibliography
[1] P. P. J. Kumar and M. L. Clark,Kumar and Clark’s Clinical Medicine. Kumar & Clark’s Clinical Medicine, Elsevier Science Health Science Division, 2009. pages 846-857.
[2] A. Wijga, L. van Buul, A. Blokstra, and A. Wolse, “Astma bij kinderen tot 12 jaar,” tech. rep., Rijksinstituut voor Volksgezondheid en Milieu, 2011.
[3] M. Engelkes, H. M. Janssens, M. A. J. de Ridder, J. C. de Jongste, M. C. J. M. Sturkenboom, and K. M. C. Verhamme, “Time trends in the incidence, prevalence and age at diagnosis of asthma in children,” Pediatric Allergy and Immunology, vol. 26, pp. 367–374, jun 2015.
[4] M. Engelkes, H. Janssens, M. de Ridder, M. Sturkenboom, J. de Jongste, and K. Verhamme, “Real life data on incidence and risk factors of severe asthma ex-acerbations in children in primary care,”Respiratory Medicine, vol. 119, pp. 48– 54, oct 2016.
[5] US Department of Health and Human Services, “National Heart, Lung and Blood Institute, National Asthma Education and Prevention Program. Expert Panel Report 3: guidelines for the diagnosis and management of asthma,” 2007.
[6] Global Initiative for Asthma, “Global Strategy for Asthma Management and
Prevention,” 2017. Available from www.ginasthma.org.
[7] R. Crapo, R. Casaburi, A. Coates, P. Enright, J. Hankinson, C. Irvin, N. Mac-Intyre, R. McKay, J. Wanger, S. Anderson, D. Cockcroft, J. Fish, and P. Sterk,
“Guidelines for methacholine and exercise challenge testing—1999,” American
Journal of Respiratory and Critical Care Medicine, vol. 161, pp. 309–329, jan 2000.
[8] J. C. van Leeuwen, J. M. Driessen, F. H. de Jongh, S. D. Anderson, and B. J. Thio, “Measuring breakthrough exercise-induced bronchoconstriction in young
asthmatic children using a jumping castle,” Journal of Allergy and Clinical
Immunology, vol. 131, pp. 1427–1429.e5, may 2013.
[9] E. Vizel, M. Yigla, Y. Goryachev, E. Dekel, V. Felis, H. Levi, I. Kroin, S. God-frey, and N. Gavriely, “Validation of an ambulatory cough detection and count-ing application uscount-ing voluntary cough under different conditions,”Cough, vol. 6, no. 1, p. 3, 2010.
[11] M. van der Kamp, B. Thio, F. de Jongh, J. Driessen, H. Hermens, and P. van Katwijk, “WEARCON. Wearable home-monitoring in asthmatic chil-dren,” 2017.
[12] S. McKenzie, “Cough–but is it asthma?,” Archives of Disease in Childhood,
vol. 70, pp. 1–2, jan 1994.
[13] J. Korp´aˇs, J. Sadloˇnov´a, and M. Vrabec, “Analysis of the cough sound: an overview,” Pulmonary Pharmacology, vol. 9, pp. 261–268, oct 1996.
[14] L. Toop, C. Thorpe, and R. Fright, “Cough sound analysis: A new tool for the diagnosis of asthma?,” Family Practice, vol. 6, no. 2, pp. 83–85, 1989.
[15] P. Piiril and A. R. Sovijrvi, “Differences in acoustic and dynamic characteristics of spontaneous cough in pulmonary diseases,” Chest, vol. 96, pp. 46–53, jul 1989.
[16] S. Rietveld, L. H. M. R. Nouwens, and P. J. M. Prins, “Cough as the ambiguous indicator of airway obstruction in asthma,”Journal of Asthma, vol. 36, pp. 177– 186, jan 1999.
[17] A. B. Chang, “The physiology of cough,”Paediatric Respiratory Reviews, vol. 7, pp. 2–8, mar 2006.
[18] C. Thorpe, L. Toop, and K. Dawson, “Towards a quantitative description of asthmatic cough sounds,”European Respiratory Journal, vol. 5, no. 6, pp. 685– 692, 1992.
[19] P. M. Olia, P. Sestini, and M. Vagliasindi, “Acoustic parameters of voluntary cough in healthy non-smoking subjects,” Respirology, vol. 5, pp. 271–275, sep 2000.
[20] R. X. A. Pramono, S. Bowyer, and E. Rodriguez-Villegas, “Automatic adven-titious respiratory sound analysis: A systematic review,” PLOS ONE, vol. 12, p. e0177926, may 2017.
[21] H. Ono, Y. Taniguchi, K. Shinoda, T. Sakamoto, S. Kudoh, and A. Gemma, “Evaluation of the usefulness of spectral analysis of inspiratory lung sounds recorded with phonopneumography in patients with interstitial pneumonia,”
Journal of Nippon Medical School, vol. 76, no. 2, pp. 67–75, 2009.
[22] R. P. Dellinger, J. E. Parrillo, A. Kushnir, M. Rossi, and I. Kushnir, “Dynamic visualization of lung sounds with a vibration response device: A case series,”
Respiration, vol. 75, pp. 60–72, jun 2007.
[23] U. Koehler, O. Hildebrandt, C. Nell, R. Alakhras, W. Nikolaizik, A. Weissflog, L. Hoehle, K. Sohrabi, L. Totta, and V. Gross, “Akustisches langzeit-monitoring
von atem- und lungengeruschen im schlaf,” Somnologie - Schlafforschung und
Schlafmedizin, vol. 18, pp. 225–230, oct 2014.
[25] M. von Heydebrand, O. Hildebrandt, W. Cassel, A. Schfer, K. Kesper, A. Weiss-flog, N. Taher, K. Sohrabi, V. Gross, and U. Koehler, “Ein vergleich der apnoeerkennung bei patienten mit obstruktiver schlafapnoe (OSA) anhand
von atemgeruschaufzeichnungen und polysomnografie,” Pneumologie, vol. 71,
pp. 594–599, jul 2017.
[26] R. Murphy, “Computerized multichannel lung sound analysis,”IEEE
Engineer-ing in Medicine and Biology Magazine, vol. 26, no. 1, p. 16, 2007.
[27] N. Gavriely and S. Godfrey, “Wheezes, rhonchi and whistles are acoustically distinct, yet all are manifestations of airflow through constricted pulmonary
airways,” in Wheezes, Rhonchi And Whistles Are Acoustically Distinct, Yet
All Are Manifestations Of Airflow Through Constricted Pulmonary Airways, American Thoracic Society, may 2011.
[28] H. Rhee, S. Miner, M. Sterling, J. S. Halterman, and E. Fairbanks, “The development of an automated device for asthma monitoring for adolescents:
Methodologic approach and user acceptability,” JMIR mHealth and uHealth,
vol. 2, p. e27, jun 2014.
[29] M. Sterling, H. Rhee, and M. Bocko, “Automated cough assessment on a mobile platform,”Journal of Medical Engineering, vol. 2014, pp. 1–9, 2014.
[30] H. Rhee, M. J. Belyea, M. Sterling, and M. F. Bocko, “Evaluating the validity of an automated device for asthma monitoring for adolescents: Correlational design,” Journal of Medical Internet Research, vol. 17, p. e234, oct 2015.
[31] Health Care Originals, 2017.http://healthcareoriginals.com/solutions/,
visited on 27-11-2017.
[32] M. Weeks, Digital Signal Processing Using MATLAB & Wavelets. Jones & Bartlett Learning, LLC, 2010. pages 190-191.
[33] I. M. Paul, K. Wai, S. J. Jewell, M. L. Shaffer, and V. V. Varadan, “Evaluation of a new self-contained, ambulatory, objective cough monitor,” Cough, vol. 2, no. 1, p. 7, 2006.
[34] I. Mazi´c, M. Bonkovi´c, and B. Dˇzaja, “Two-level coarse-to-fine classification algorithm for asthma wheezing recognition in children’s respiratory sounds,”
Biomedical Signal Processing and Control, vol. 21, pp. 105–118, aug 2015.
[35] W. Ser, T. T. Zhang, J. Yu, and J. Zhang, “Detection of wheezes using a
wearable distributed array of microphones,” Wearable and Implantable Body
Sensor Networks, 2009. BSN 2009. Sixth International Workshop on, pp. 296– 300, 2009.
[36] H. Pasterkamp, S. S. Kraman, P. D. DeFrain, and G. R. Wodicka, “Measure-ment of respiratory acoustical signals,” Chest, vol. 104, pp. 1518–1525, nov 1993.
[38] Knowles Electronics, 2017. http://www.knowles.com/eng/Products/ Sensors/Accelerometers, accessed on 04-12-2017.
[39] Bittium, 2017. https://www.bittium.com/products_services/medical/
bittium_faros#technical_details, accessed on 04-12-2017.
[40] Iotool, 2017. https://iotool.io/extensions/sensors/
emotion-faros-180-7, accessed on 04-12-2017.
[41] Actigraph, 2017. http://actigraphcorp.com/products-showcase/
activity-monitors/actigraph-wgt3x-bt/, accessed on 05-12-2017.
[42] J. B. Eising, C. S. P. M. Uiterwaal, and C. K. van der Ent, “Nocturnal wheeze measurement in preschool children,” Pediatric Pulmonology, vol. 49, pp. 257– 262, jun 2013.
[43] Activinsights, “GENEActiv Action.” https://www.activinsights.com/
actigraphy/geneactiv-action/, accessed on 20-02-2018.
[44] J. Amoh and K. M. Odame, “Technologies for developing ambulatory cough monitoring devices,” Critical Reviews in Biomedical Engineering, 2014.
[45] P. Peduzzi, J. Concato, E. Kemper, T. R. Holford, and A. R. Feinstein, “A simulation study of the number of events per variable in logistic regression analysis,” Journal of Clinical Epidemiology, vol. 49, pp. 1373–1379, dec 1996.
[46] A. Spittle, J. Orton, P. J. Anderson, R. Boyd, and L. W. Doyle, “Early devel-opmental intervention programmes provided post hospital discharge to prevent
motor and cognitive impairment in preterm infants,” Cochrane Database of
Systematic Reviews, nov 2015.
[47] ActiGraph LLC., “Children,” Aug. 2018. https://actigraphcorp.com/
category/research-database/children/, accessed on 02-08-2018.
[48] M. F. Hjorth, C. Jean-Philippe, C. T. Damsgaard, D. Stine-Mathilde, K. F. Michaelsen, I. Tetens, and A. Sj¨oden, “Measure of sleep and physical activity by a single accelerometer: Can a waist-worn Actigraph adequately measure sleep in children?,” Sleep and Biological Rhythms, vol. 10, pp. 328–335, oct 2012.
[49] M. J. Mathie, A. C. F. Coster, N. H. Lovell, and B. G. Celler, “Accelerometry: providing an integrated, practical method for long-term, ambulatory monitoring
of human movement,” Physiological Measurement, vol. 25, pp. R1–R20, apr
2004.
[50] J. Augen,The Volatility Edge in Options Trading: New Technical Strategies for Investing in Unstable Markets, The. Pearson Education, 2008. page 73-74.
[51] Voedingscentrum, 2018. https://www.voedingscentrum.nl/
[52] S. D. Anderson and P. Kippelen, “Exercise-induced bronchoconstriction: Pathogenesis,” Current Allergy and Asthma Reports, vol. 5, pp. 116–122, mar 2005.
[53] D. Giancoli,Physics for Scientists and Engineers with Modern Physics. Physics for Scientists & Engineers with Modern Physics, Pearson Prentice Hall, 2008. page 429.
[54] L. E. Glaze, D. M. Bless, P. Milenkovic, and R. D. Susser, “Acoustic char-acteristics of children's voice,” Journal of Voice, vol. 2, no. 4, pp. 312–319, 1988.
[55] A. A. Abaza, J. B. Day, J. S. Reynolds, A. M. Mahmoud, W. T. Goldsmith, W. G. McKinney, E. L. Petsonk, and D. G. Frazer, “Classification of voluntary cough sound and airflow patterns for detecting abnormal pulmonary function,”
Cough, vol. 5, no. 1, p. 8, 2009.
[56] L. Pavesi, S. Subburaj, and K. Porter-Shaw, “Application and validation of a computerized cough acquisition system for objective monitoring of acute cough,” Chest, vol. 120, pp. 1121–1128, oct 2001.
[57] J. de Haan, B. Thio, and F. de Jongh, “Analysis of cough measured with accelerometers compared with sound recording in healthy adults and children.,” 2018.
[58] BSN Medical, “Fixomull Stretch.” https://www.bsnmedical.com/products/
wound-care-vascular/category-product-search/acute-wound-care/ fixation/fixomullr-stretch.html, accessed on 18-06-2018.
[59] P. Davies and M. Rippon, “Evidence review: the clinical benefits of Safetac technology in wound care.,” Journal of wound care, vol. Suppl, pp. 3–31, nov 2008.
[60] C. Morris, P. Emsley, E. Marland, F. Meuleneire, and R. White,Dressings With Soft Silicone Technology In The Management Of Paediatric Wounds: Results Of An Observational Study. jun 2018.
[61] BSN Medical, “Leukoflex.” https://www.bsnmedical.com/products/
wound-care-vascular/category-product-search/acute-wound-care/ fixation/leukoflexr.html, accessed on 08-06-2018.
[62] C. Medical, “Mepilex border flex,” July 2018. https://www.capesmedical.
Appendix A
Measurement site of the GENEActiv Action
Attachment of the GENEActiv Action on the pectoralis major muscle has been explored first. This was the preferred measurement location, since if suitable, the device could be worn underneath clothing. Then the device would be undetectable in their social environment, making patients more willing to wear the device. Unfor-tunately we found that since the pectoralis is situated above rib cage, it dampened the cough sounds. Then, fixation above the suprasternal notch was opted, similar to Paul et al.[33] During testing, this gave data of good quality, coughs were clearly
distinguishable in the frequency domain. The placement however would make the child susceptible for injuries, such as when flexion of the neck takes place. Therefore different placements were compared to the suprasternal notch; the sternocleidomas-toid region and the trapezoid region. The data quality at these sites were compared by recording coughs simultaneously, the attachment of the devices is shown in Figure A.1.
Multiple coughs were performed while wearing the devices and the sound was simultaneously recorded with a telephone (Samsung S5 mini). The coughs were performed whilst standing and while jumping up and down. Raw data of all devices was extracted and data was further analysed in Matlab. First the resultant of the x-y- and z-direction (=px2+y2+z2−1) was created. This resultant was transferred
[image:53.595.86.461.561.689.2]to the frequency domain by creating a spectrogram. When comparing the data of the sound recording to the data of the GENEActiv Action in the time domain, no obvious similarities were observed. Visual inspection of the spectrogram did reveal similarities in the frequency domain, between the signal of the sternocleidomastoid
trape-Figure A.2: Comparison of all locations and the microphone in the frequency domain. Only the z-direction of the GENEActiv Action has been analysed, giving greater distinctions for coughs. The microphone obtained sound has been downsampled from 44100 Hz to 1000 Hz, which enable comparison with the accelerometer, which also has a fs of 1000 Hz.
[image:54.595.107.525.82.307.2]