Original Article
The effect of prednisone acetate combined with
cyclophosphamide on systemic lupus erythematosus
and serum IL-4, IL-6, and IL-10 expressions
Jidi Lu1*, Peng Cheng2*, Yanxin Zhang3, Xiuqing Jia4, Ni Zhang5
1Department of Rheumatology, Lu’an People’s Hospital, Lu’an, Anhui Province, China; 2Department of Intensive
Care Medicine, Yidu Central Hospital of Weifang, Weifang, Shandong Province, China; 3Department of Renal
Rheumatology, Leling People’s Hospital of Shandong, Leling, Shandong Province, China; 4Department of Center
Drug Distribution Room, Ji’ning First People’s Hospital, Ji’ning, Shandong Province, China; 5Department of
Rheumatology and Immunology, The Second Hospital of Shandong University, Ji’nan, Shandong Province, China.
*Equal contributors and co-first authors.
Received August 21, 2019; Accepted October 10, 2019; Epub December 15, 2019; Published December 30, 2019
Abstract: Objective: To investigate the efficacy of prednisone acetate combined with cyclophosphamide for the treatment of systemic lupus erythematosus and their effects on serum interleukin (IL)-4, IL-6, and IL-10. Methods: A total of 90 patients with systemic lupus erythematosus were randomly assigned into a control group and an observation group. The control group was treated with prednisone (n=45), while the observation group was given an additional cyclophosphamide (n=45). The serum levels of IL-4, IL-6, and IL-10 were measured by ELISA after 28 days of treatment. The changes in the IL-4, IL-6, and IL-10 expressions, efficacy and adverse reactions after treat-ment were compared between the two groups. According to the efficacy after 90 days of treattreat-ment, the patients were divided into two subgroups, the favorable efficacy subgroup (patients of markedly effective efficacy) and the poor efficacy subgroup (patients of effective and ineffective efficacy). The expressions of IL-4, IL-6, and IL-10 were compared between the two subgroups. A receiver operating characteristic curve was plotted to observe the predic-tive value of each indicator for efficacy. Results: There were no statistical differences in the baseline data between the two groups (all P>0.05). After treatment, the expressions of serum IL-4, IL-6, and IL-10 in the observation group were significantly lower than they were in the control group (all P<0.05). The total incidence of adverse reactions between the two groups was not significant (P>0.05). The clinical outcomes between the two groups were signifi-cantly different (P<0.05). The expressions of serum IL-4, IL-6, and IL-10 in the patients with favorable efficacy were significantly lower than those in the patients with poor efficacy (all P<0.05). The receiver operating characteristic curve analysis showed that the areas under the curve of IL-4, IL-6, and IL-10 were 0.703, 0.782, and 0.670, respec-tively. Conclusion: Prednisone acetate combined with cyclophosphamide can effectively improve the conditions of patients with systemic lupus erythematosus, and the expressions of IL-4, IL-6, and IL-10 in the serum can be used as potential indicators for the prediction of clinical efficacy.
Keywords: Cyclophosphamide, prednisone acetate, systemic lupus erythematosus, clinical efficacy, cytokines
Introduction
Systemic lupus erythematosus (SLE) is a kind of autoimmune connective tissue disease in- volving multiple organs and systems. Patients with SLE have various kinds of autoantibodies in the serum, showing pathological manifesta-tions of complex pathogenic autoantibody re- sponses and an accumulation of immune com-plex [1, 2]. In a survey of SLE in Asia by Osio-Salido et al., the incidence of SLE in 24
coun-tries is usually 30-50/100,000, and it is signifi-cantly higher in women than in men, and most of them were young and middle-aged [3]. To date, the cause of SLE is not clear yet, but stud-ies have confirmed that the causes of SLE include the neuroendocrine system, infections, genetics, immunological abnormalities, etc. [4-6].
affect the quality of life and the survival of patients [7]. Therefore, the treatment for SLE is particularly important. With the improvement of medical understanding and the deepening of scientific research, the treatment for SLE has been continuously improved. Prednisone ace-tate, a glucocorticoid drug, can reduce the amo- unt of capillary exudation and inhibit the phago-cytosis of leukocytes by increasing the vascular tension in the early stage, so as to inhibit the inflammatory reaction and immune response [8]. As a bifunctional alkylating nitrogen mus-tard agent, cyclophosphamide inhibits T and B cells so as to inhibit cell proliferation at various stages, and it also inhibits complement activity and reduces renal damage in patients [9]. A clinical study showed that prednisone acetate combined with cyclophosphamide significantly improved the condition of SLE patients [10]. But there are few diagnostic indicators for the efficacy of SLE treatment. In recent years, stud-ies have shown that IL-4, IL-6, and IL-10 are differentially expressed in the serum of SLE patients [11]. However, whether they can be used as predictive indicators for the efficacy of treatment for SLE has not been reported. Therefore, we enrolled 90 patients with SLE in a randomized, controlled trial and hope to pro-vide a reference for clinical treatment.
Materials and methods
Clinical data
In this study, we enrolled 90 patients with SLE who were treated at The Second Hospital of Shandong University as the subjects. The pa- tients were randomly assigned into an observa-tion group or a control group, with 45 patients in each group. Another 40 healthy subjects who underwent physical examinations were enrolled in the normal group. This study was approved by the Medical Ethics Committee of The Second Hospital of Shandong University, and an infor- med consent was obtained from each of the subjects.
Inclusion criteria & exclusion criteria
Patients were eligible for the study if they: met the SLE classification standard revised by the American College of Rheumatology in 1997 [12]; were treated for the first time; were aged 14-60 years old; had a SLEDAI score of 5-14
points; had a predictive survival of the whole treatment period; had complete clinical data. Patients were excluded if they had other malig-nant tumors, autoimmune diseases other than SLE, coronary heart disease, hypertension, or digestive system disease; had allergies or con-traindications to the experimental drugs; had poor compliance with treatment; were pregnant or lactating; had refractory SLE.
Materials
The ELISA kits for detecting IL-4, IL-6, and IL-10 were obtained from Shanghai Beyotime, China. The prednisone acetate tablets were obtained from Tianjin Lisheng, China. The cyclophospha-mide for injection was obtained from Jiangsu Shengdi, China.
Therapeutic regimen
The control group and the observation group were treated with single treatment and com-bined treatment, respectively. The control group was treated with oral prednisone acetate tablets 0.2 mg/kg in the morning for 6 continu-ous weeks. The dosage was reduced according to their improvement in condition (generally decreasing at a rate of 5 mg per week), and then maintained at 5-10 mg/d. Patients in the observation group were given cyclophospha-mide on the basis of the control group. Cy- clophosphamide 500 mg was dissolved in 250 mL of 0.9% NaCl for intravenous injection, 14 days/time for the first 3 times, and 28 days/ time for the remaining period of the course (90 days per course).
Detection of IL-4, IL-6, and IL-10
Table 1. Evaluation of efficacy
Efficacy Manifestation
Markedly effective The clinical symptoms of the patients completely disappeared or significantly improved, and the relevant laboratory indica-tors returned to normal or significantly improved.
Effective The patient’s clinical symptoms recovered to a certain level, and the laboratory indicators were improved. Ineffective The patient’s clinical symptoms remained or were aggravated, and the laboratory indicators were not improved.
count data were expressed as the rate (%), and processed using chi-squared test, denoted as χ2. The ranked data were processed using a
non-parametric test, denoted by Z. The distri-bution of the measurement data was analyzed using a K-S test. The measurement data in accordance with the normal distribution was expressed as the mean ± standard deviation (mean ± sd), and compared between the two groups using an independent sample t test, denoted by t. The ROC curve was used to evalu-ate the predictive value of IL-4, IL-6, and IL-10 for the post-treatment efficacy. There was a statistical difference between two groups when P<0.05.
Results
Comparison of the clinical data
There were no statistical differences in gender, age, BMI, duration of disease, past medical his-tory, smoking hishis-tory, alcohol abuse hishis-tory, systemic lupus erythematosus disease activity index (SLEDAI) score, cause of disease, C3, or C4 between the two groups (all P>0.05). See Table 2.
Expressions of IL-4, IL-6, and IL-10
The expressions of serum IL-4, IL-6, and IL-10 after 28 days in the observation group were sig-nificantly lower than they were in the control group, with significant differences (all P<0.05). The differences between before and after treat-ment in the observation group were more sig-nificant as compared with the differences in the control group (all P<0.05). See Tables 3-5.
Adverse reactions and evaluation of clinical efficacy
The adverse reactions in the two groups were recorded. In the observation group, there were 2 case of intestinal reactions, 2 cases of men-strual disorders, 3 cases of nausea and vomit-ing, and 2 cases of hypertension, with a total well was full of the washing solution but without
overflowing, for 30 seconds, and then the plate was patted dry. After being washed five tim- es, 50 μL of the enzyme standard solution was added to each well to seal the plate again for 60 min incubation at 37°C. Again, the plate was washed 5 times and patted dry thoroughly after the last time with the use of absorbent paper. Horseradish peroxidase of 100 μL/well was added and incubated at 37°C for 15 min in the dark. Then, the color substrate TMB at 100 μL/well was added and incubated at room tem-perature for 20 min in the dark. At last, a stop buffer of 50 μL/well was added. The determi-nation of the maximum absorption wavelength of 450 nm was performed using a microplate reader within 15 min. In this experiment, 3 duplicate wells were set, and the experiment was repeated 3 times.
Outcome measures
The main outcome measures were the changes in the IL-4, IL-6, and IL-10 expressions after 28 days of treatment, and the therapeutic effects after treatment. See Table 1 for the evaluation criteria.
The secondary outcome measure was the ad- verse events during treatment.
According to the treatment efficacy, the patients were divided into a favorable efficacy subgroup (patients of markedly effective efficacy), and a poor efficacy subgroup (patients of effective and ineffective efficacy). The expressions of IL-4, IL-6, and IL-10 were compared after the treatment in the two subgroups. The receiver operating characteristic (ROC) curve was plot-ted to observe the predictive value of IL-4, IL-6, and IL-10 for efficacy.
Statistical analysis
incidence of 20.00%. In the control group, there were 3 cases of intestinal reactions, 2 cases of menstrual disorders, 3 cases of nausea and vomiting, and 3 cases of hypertension, with a total incidence of 24.44%. There was no statis-tical difference in the total incidence of adverse reactions between the two groups (X2=0.257,
P=0.612).
The clinical efficacy of the two groups was eval-uated after one course of treatment. The con-trol group had 17 patients of markedly effec-tive, 18 patients of effeceffec-tive, and 10 patients of ineffective, while the observation group had 28 patients of markedly effective, 13 patients of effective, and 4 patients of ineffective, and
observe the predictive value of each indicator for clinical efficacy. The results showed that the area under the IL-4 curve was 0.703, 95% CI: 0.589-0.816; the area under the IL-6 curve was 0.782, 95% CI: 0.685-0.879; the area under the IL-10 curve was 0.670, 95% CI: 0.558-0.782. See Table 8 and Figure 2.
Discussion
[image:4.612.90.391.85.478.2]SLE mostly develops in young and middle-aged women, with a small proportion in children and the elderly, showing an n-shaped distribution. As an autoimmune disease, SLE affects multi-ple organs and tissues of the patients and seri-ously harms their lives and health [13]. How- Table 2. Clinical data
Control group
(n=45) group (n=45) t/χObservation 2 P Sex
Male 9 (20.00) 7 (15.56) 0.304 0.581
Female 36 (80.00) 38 (84.44)
Age (year) 31.9±7.0 32.3±6.0 0.291 0.771
BMI (kg/m2) 23.51±1.80 22.80±1.59 1.983 0.051
Duration of disease 3.29±0.69 3.11±0.76 1.176 0.243 Past medical history
Diabetes 8 (17.78) 6 (13.33) 0.338 0.561 Hypertension 9 (20.00) 10 (22.22) 0.067 0.796
COPD 2 (4.44) 3 (6.67) 0.212 0.645
Hyperlipidemia 6 (13.33) 8 (17.78) 0.338 0.561
Smoking history 0.207 0.649
Yes 15 (33.33) 13 (28.89)
No 30 (66.67) 32 (71.11)
Alcohol abuse 0.549 0.459
Yes 3 (6.67) 5 (11.11)
No 42 (93.33) 40 (88.89)
SLEDAI 0.227 0.634
Moderate 34 (75.56) 32 (71.11)
Severe 11 (24.44) 13 (28.89)
Cause of disease 1.586 0.811
Genetic 8 (17.78) 10 (22.22)
Virus infection 12 (26.67) 8 (17.78)
Drug 3 (6.67) 3 (6.67)
Abnormal sex hormone levels 15 (33.33) 14 (31.11) No obvious cause 7 (15.56) 10 (22.22)
C3 (g/L) 0.38±0.08* 0.40±0.06* 1.342 0.183
C4 (g/L) 0.10±0.03* 0.11±0.03* 1.581 0.117
Note: BMI: body mass index, COPD: chronic obstructive pulmonary disease, SLEDAI: sys-temic lupus erythematosus disease activity index, C3: complement C3, C4: complement C4. Compared with the control group, *P<0.05.
there was a significant dif-ference in clinical efficacy between the two groups (P<0.05). See Table 6.
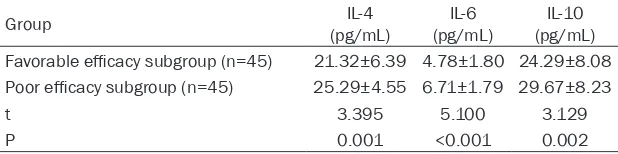
Expressions of serum IL-4, IL-6, and IL-10 in the favorable and poor effi-cacy subgroups
According to the clinical efficacy after one course of treatment, the patien- ts were divided into a fa- vorable efficacy subgro- up (patients of markedly effective efficacy, n=45), and a poor efficacy sub-group (patients of effec-tive and ineffeceffec-tive effica-cy, n=45). The expressi- ons of serum IL-4, IL-6, and IL-10 were found to be significantly lower in the favorable efficacy sub-group than they were in the poor efficacy subgroup (all P<0.05). See Table 7 and Figure 1.
Predictive value of serum IL-4, IL-6, and IL-10 for clinical efficacy
ever, the pathogenesis of SLE has not been thoroughly studied at present, but the factors related to the disease at present are genetics, the environment, viral infections, and autoim-mune defects [14]. The common treatments for SLE in clinical practice are corticosteroids and
stances in vivo by inhibiting the abnormal prolif-eration of connective tissue in SLE patients [16].
[image:5.612.90.523.86.165.2]In the present study, we observed the clinical efficacy of two drugs for the treatment of SLE. Table 3. Changes in IL-4 expression
Group IL-4 (g/mL) t P Difference value
Before treatment After 28 d of treatment
Control group (n=45) 35.17±10.32* 26.60±5.15 3.400 0.001 8.58±5.57
Observation group (n=45) 34.72±10.60* 21.57±4.54 9.647 <0.001 13.14±6.28
t 0.204 4.915 3.644
P 0.838 <0.001 <0.001
[image:5.612.91.524.214.292.2]Note: Compared with the control group, *P<0.05.
Table 4. Changes in IL-6 expression
Group IL-6 (g/mL) t P Difference value
Before treatment After 28 d of treatment
Control group (n=45) 9.30±3.03* 6.86±2.02 3.022 0.004 2.45±1.23
Observation group (n=45) 8.97±2.55* 5.16±2.55 7.087 <0.001 3.81±2.94
t 0.559 3.506 2.862
P 0.578 <0.001 0.005
[image:5.612.91.524.338.418.2]Note: Compared with the control group, *P<0.05.
Table 5. Changes in IL-10 expression
Group IL-10 (g/mL) t P Difference value
Before treatment After 28 d of treatment
Control group (n=45) 49.49±16.16* 31.57±9.54 7.792 <0.001 17.68±7.13
Observation group (n=45) 48.59±19.21* 24.97±7.55 7.072 <0.001 23.63±11.91
t 0.240 3.639 2.875
P 0.810 <0.001 0.005
Note: Compared with the control group, *P<0.05.
Table 6. Evaluation of clinical efficacy
Group Markedly effective Effective Ineffective Z P Control group (n=45) 17 (37.78) 18 (40.00) 10 (22.22) -2.448 0.014 Observation group (n=45) 28 (62.22) 13 (28.89) 4 (8.89)
Table 7. Expression of serum IL-4, IL-6, and IL-10 in the favorable and poor efficacy subgroups
Group (pg/mL)IL-4 (pg/mL)IL-6 (pg/mL)IL-10 Favorable efficacy subgroup (n=45) 21.32±6.39 4.78±1.80 24.29±8.08 Poor efficacy subgroup (n=45) 25.29±4.55 6.71±1.79 29.67±8.23
t 3.395 5.100 3.129
P 0.001 <0.001 0.002
[image:5.612.91.401.464.518.2] [image:5.612.90.399.565.642.2]sub-The clinical efficacy of the control group, treat-ed with a single drug, was significantly less promising than that of the observation group, treated with a combination of two drugs. In a study by An et al., 77.60% of SLE patients tre- ated with cyclophosphamide combined with prednisone showed a markedly effective out-come, which is basically consistent with our stu-
indicating that the combination of the two drugs does not increase the adverse reactions in patients.
In recent years, with the deepening of research on the mechanism of SLE, increasing biological indicators have been found to be closely relat-ed to the development of SLE. As an important Th2 cytokine, IL-4 can promote the transforma-tion of Th0 cells into Th2 cells, and can also promote the proliferation of B cells to produce a large number of antibodies, which can increase the expressions of IgE and IgG in vivo
[image:6.612.93.520.71.229.2][18]. Studies have shown that IL-4 can induce Th2 cell differentiation, and Th2 cell differentia-tion can increase the expression of IL-4. The interaction between the two can promote the autoimmune response of SLE patients, result-ing in the aggravation of SLE [19]. IL-6 can stim-ulate the maturation of B cells, inducing B cell differentiation to become a mature immuno-globulin, thereby secreting plasma cells [20]. In the studies of Eilertsen and Umare et al., the expression of IL-6 in the peripheral blood and
Figure 1. Expressions of serum IL-4, IL-6, and IL-10 in the favorable and poor efficacy subgroups. A. The expression of serum IL-4 in the favorable efficacy subgroup was significantly lower than it was in the poor efficacy subgroup (**P<0.01). B. The expression of serum IL-6 in the favorable efficacy subgroup was significantly lower than it was in
the poor efficacy subgroup (***P<0.001). C. The expression of serum IL-10 in the favorable efficacy subgroup was
[image:6.612.90.376.336.400.2]significantly lower than it was in the poor efficacy subgroup (**P<0.01).
Table 8. Receiver operating characteristic curves of serum IL-4, IL-6, and IL-10
Index AUC 95% CI Sensitivity (%) Specificity (%) Youden’s index (%) (pg/mL)Cut-off IL-4 0.703 0.589-0.816 68.89 82.22 51.11 <22.565 IL-6 0.782 0.685-0.879 68.89 80.00 48.89 <5.760 IL-10 0.670 0.558-0.782 46.67 86.67 33.33 <23.075
Note: AUC: area under the curve; 95% CI: 95% confidence interval.
Figure 2. Receiver operating characteristic curve of serum IL-4, IL-6, and IL-10.
[image:6.612.91.285.433.571.2]urine of patients with SLE was significantly higher its expression in normal subjects, and the IL-6 expression in patients was significantly reduced after treatment [21, 22]. As an anti-inflammatory factor, IL-10 has its inhibitory effect in a variety of cells. The main function of anti-inflammatory factors is to inhibit tissue damage caused by specific and non-specific immune responses, and to enhance the im- mune function of patients, similar to the role of a “scavenger” [23]. In the present study, the serum levels of IL-4, IL-6, and IL-10 in the nor-mal subjects were significantly lower than those in the SLE patients, indicating that the expres-sions of serum IL-4, IL-6, and IL-10 were in- creased in patients who developed SLE. In the studies of Guimarães and Wong et al., the expressions of IL-4, IL-6, and IL-10 in the periph-eral blood of patients with SLE were higher than those in the normal group, which is consis-tent with our study [24, 25]. However, the expressions of the indicators in SLE patients after treatment, and whether they can be used as efficacy indicators for the treatment of SLE are not clear yet. Therefore, we further tested the serum IL-4, IL-6, and IL-10 in patients after treatment. The results showed that the expres-sions of IL-4, IL-6 and IL-10 in the serum of the two groups after treatment were significantly lower than they were before treatment. Also, the different values before and after treatment were smaller in the control group than they were in the observation group, suggesting that the combination of the two drugs was better at decreasing the expressions of serum IL-4, IL-6, and IL-10 than the single drug. We speculate that this may be because cyclophosphamide can not only kill the lymphocytes in the prolifer-ating phase, but it also has a certain effect on the cells in the quiescent phase, thus reducing the number of circulating B lymphocytes and T cells, thereby inhibiting the production of IL-4, IL- 6, and IL-10, so that the level of the indica-tors in the body can return to a normal level. At the end of the study, we divided the patients into a favorable efficacy subgroup and a poor efficacy subgroup, and found that the expres-sions of serum IL-4, IL-6, and IL-10 in the favor-able efficacy subgroup were significantly lower than they were in the poor efficacy subgroup. The ROC curve was plotted according to the expressions. It was found that the areas under the IL-4, IL-6, and IL-10 curves were 0.703, 0.782, and 0.670, respectively, suggesting that
IL-4, IL-6, and IL-10 have a good predictive value for the clinical efficacy of patients and are expected to be potential indicators for thera-peutic effects in patients with SLE.
However, there are still some limitations in this study. Firstly, this clinical trial did not clarify the mechanism of prednisone acetate combined with cyclophosphamide affecting the expres-sions of IL-4, IL-6, and IL-10 in the serum of patients with SLE. Secondly, we only studied the indicators in a single center. So, it is unclear whether there are differences between differ-ent regions and ethnic groups. Lastly, we did not observe the combined predictive value of the indicators for the clinical outcomes. The- refore, we will carry out further experiments with larger sample sizes to verify the results of this study.
In summary, prednisone acetate combined with cyclophosphamide can effectively improve the condition of patients with SLE, and the expres-sions of IL-4, IL-6, and IL-10 in the serum can be used as potential indicators to predict the clini-cal efficacy.
Disclosure of conflict of interest
None.
Address correspondence to: Ni Zhang, Department of Rheumatology and Immunology, The Second Hospital of Shandong University, No. 247 Bei- yuan Street, Ji’nan 250033, Shandong Province, China. Tel: 51630729; Fax: +86-0531-51630729; E-mail: zhangni425@163.com
References
[1] Tsokos GC, Lo MS, Costa Reis P and Sullivan KE. New insights into the immunopathogene-sis of systemic lupus erythematosus. Nat Rev Rheumatol 2016; 12: 716-730.
[2] Xiao YB, Guo MY and Zuo XX. Immunometabo-lism and systemic lupus erythematosus.Bei-jing Da Xue Xue Bao Yi Xue Ban 2018; 50: 1120-1124.
[3] Osio-Salido E and Manapat-Reyes H. Epidemi-ology of systemic lupus erythematosus in Asia. Lupus 2010; 19: 1365-1373.
[4] Paolino S, Smith V, Pizzorni C, Seriolo B, Sulli A and Cutolo M. Vitamin D, autoimmune diseas-es, and systemic lupus erythematosus. Con-nective Tissue Disease 2016.
erythemato-sus and lupus nephritis. Nat Rev Nephrol 2015; 11: 329-341.
[6] Bowman JD, Rahman SM and Choudhury M. Endocrine disruptors and epigenetics, gene regulation, epigenetics and hormone signaling 2017.
[7] Brunner HI, Gulati G, Klein-Gitelman MS, Rouster-Stevens KA, Tucker L, Ardoin SP, Onel KB, Mainville R, Turnier J, Aydin POA, Witte D, Huang B, Bennett MR and Devarajan P. Urine biomarkers of chronic kidney damage and re-nal functiore-nal decline in childhood-onset sys-temic lupus erythematosus. Pediatr Nephrol 2019; 34: 117-128.
[8] Dengfeng L and Jinxiang R. Clinical observa-tion of prednisone acetate combined with leflunomide in the treatment of IgA nephropa-thy. China Pharmacy 2016; 27: 1118-1120. [9] Rathi M, Goyal A, Jaryal A, Sharma A, Gupta
PK, Ramachandran R, Kumar V, Kohli HS, Sakhuja V, Jha V and Gupta KL. Comparison of low-dose intravenous cyclophosphamide with oral mycophenolate mofetil in the treatment of lupus nephritis. Kidney Int 2016; 89: 235-242. [10] Takada K, Illei GG and Boumpas DT. Cyclo-phosphamide for the treatment of systemic lu-pus erythematosus. Lulu-pus 2001; 10: 154-161.
[11] Talaat RM, Mohamed SF, Bassyouni IH and Raouf AA. Th1/Th2/Th17/Treg cytokine imbal-ance in systemic lupus erythematosus (SLE) patients: correlation with disease activity. Cyto-kine 2015; 72: 146-153.
[12] Hochberg MC. Updating the American College of Rheumatology revised criteria for the classi-fication of systemic lupus erythematosus. Ar-thritis Rheum 1997; 40: 1725.
[13] Hermansen ML, Lindhardsen J, Torp-Pedersen C, Faurschou M and Jacobsen S. Incidence of systemic lupus erythematosus and lupus ne-phritis in denmark: a nationwide cohort study. J Rheumatol 2016; 43: 1335-1339.
[14] Lee YH, Choi SJ, Ji JD and Song GG. Overall and cause-specific mortality in systemic lupus ery-thematosus: an updated meta-analysis. Lupus 2016; 25: 727-734.
[15] Sciascia S, Mompean E, Radin M, Roccatello D and Cuadrado MJ. Rate of adverse effects of medium- to high-dose glucocorticoid therapy in systemic lupus erythematosus: a systematic review of randomized control trials. Clin Drug Investig 2017; 37: 519-524.
[16] Touma Z and Urowitz MB. Systemic glucocorti-coids. Systemic Lupus Erythematosus 2016: 521-531.
[17] Li A, Li ZP and Chen WJ. Analysis on curative effect and safety of cyclophosphamide com-bined with prednisone in the treatment of sys-temic lupus erythematosus. Chinese Journal of Modern Drug Application 2017; 11: 12-14. [18] Woytschak J, Keller N, Krieg C, Impellizzieri D,
Thompson RW, Wynn TA, Zinkernagel AS and Boyman O. Type 2 interleukin-4 receptor sig-naling in neutrophils antagonizes their expan-sion and migration during infection and inflam-mation. Immunity 2016; 45: 172-184. [19] Zhu J. Thelper 2 (Th2) cell differentiation, type
2 innate lymphoid cell (ILC2) development and regulation of interleukin-4 (IL-4) and IL-13 pro-duction. Cytokine 2015; 75: 14-24.
[20] Arkatkar T, Du SW, Jacobs HM, Dam EM, Hou B, Buckner JH, Rawlings DJ and Jackson SW. B cell-derived IL-6 initiates spontaneous germi-nal center formation during systemic autoim-munity. J Exp Med 2017; 214: 3207-3217. [21] Eilertsen GO, Nikolaisen C, Becker-Merok A
and Nossent JC. Interleukin-6 promotes arthri-tis and joint deformation in patients with sys-temic lupus erythematosus. Lupus 2011; 20: 607-613.
[22] Umare V, Pradhan V, Nadkar M, Rajadhyaksha A, Patwardhan M, Ghosh KK and Nadkarni AH. Effect of proinflammatory cytokines (IL-6, TNF-α, and IL-1β) on clinical manifestations in Indian SLE patients. Mediators Inflamm 2014; 2014: 385297.
[23] Moore KW, de Waal Malefyt R, Coffman RL and O’Garra A. Interleukin-10 and the Interleu-kin-10 receptor. Annu Rev Immunol 2001; 19: 683-765.
[24] Simão ANC, Guimarães PM, Acavuzzi BM, Alf-ieri DF, Stadtlober NP, Lozovoy MAB, Reiche EMV, Morimoto HK, Almeida ERD, Iriyoda TMV, Costa NT, Dichi I and Maes M. 459 systemic lupus erythematosus and severity of illness are associated with t helper 1 and 17 cyto-kines profiles together with a lowered il-4 pro-duction. BMJ 2017; 221.