Multi-Granular Aspect Aggregation in Aspect-Based Sentiment Analysis
John Pavlopoulos
and
Ion Androutsopoulos
Department of Informatics
Athens University of Economics and Business
Patission 76, GR-104 34 Athens, Greece
http://nlp.cs.aueb.gr/
Abstract
Aspect-based sentiment analysis estimates the sentiment expressed for each particu-lar aspect (e.g., battery, screen) of an en-tity (e.g., smartphone). Different words or phrases, however, may be used to re-fer to the same aspect, and similar as-pects may need to be aggregated at coarser or finer granularities to fit the available space or satisfy user preferences. We in-troduce the problem of aspect aggrega-tion at multiple granularities. We decom-pose it in two processing phases, to al-low previous work on term similarity and hierarchical clustering to be reused. We show that the second phase, where aspects are clustered, is almost a solved prob-lem, whereas further research is needed in the first phase, where semantic simi-larity measures are employed. We also introduce a novel sense pruning mecha-nism for WordNet-based similarity mea-sures, which improves their performance in the first phase. Finally, we provide pub-licly available benchmark datasets.
1 Introduction
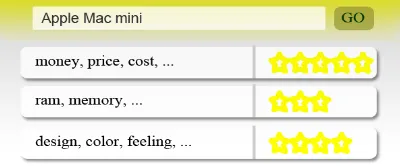
Given a set of texts discussing a particular en-tity (e.g., reviews of a laptop),aspect-based senti-ment analysis(ABSA) attempts to identify the most prominent (e.g., frequently discussed) aspects of the entity (e.g., battery, screen) and the average sentiment (e.g., 1 to 5 stars) for each aspect or group of aspects, as in Fig. 1. MostABSAsystems perform all or some of the following (Liu, 2012):
[image:1.595.311.511.219.302.2]subjectivity detectionto retain only sentences (or other spans) expressing subjective opinions; as-pect extractionto extract (and possibly rank) terms corresponding to aspects (e.g., ‘battery’); aspect aggregation to group aspect terms that are near-synonyms (e.g., ‘price’, ‘cost’) or to obtain aspects
Figure 1: Aspect groups and scores of an entity.
at a coarser granularity (e.g., ‘chicken’,‘steak’, and ‘fish’ may be replaced by ‘food’ in restaurant reviews); andaspect sentiment score estimationto estimate the average sentiment for each aspect or group of aspects. In this paper, we focus on aspect aggregation, the least studied stage of the four.
Aspect aggregation is needed to avoid reporting separate sentiment scores for aspect terms that are very similar. In Fig. 1, for example, showing sep-arate lines for ‘money’, ‘price’, and ‘cost’ would be confusing. The extent to which aspect terms should be aggregated, however, also depends on the available space and user preferences. On de-vices with smaller screens, it may be desirable to aggregate aspect terms that are similar, though not necessarily near-synonyms (e.g., ‘design’, ‘color’, ‘feeling’) to show fewer lines (Fig. 1), but finer as-pects may be preferable on larger screens. Users may also wish to adjust the granularity of aspects, e.g., by stretching or narrowing the height of Fig. 1 on a smartphone to view more or fewer lines. Hence, aspect aggregation should be able to pro-duce groups of aspect terms formultiple granular-ities. We assume that the aggregated aspects are displayed as lists of terms, as in Fig. 1. We make no effort to order (e.g., by frequency) the terms in each list, nor do we attempt to produce a single (more general) term to describe each aggregated aspect, leaving such tasks for future work.
Ag-gregating only synonyms (or near-synonyms), however, does not allow users to select the desir-able aspect granularity, and ignores the hierarchi-cal relations between aspect terms. For example, ‘pizza’ and ‘steak’ are kinds of ‘food’ and, hence, the three terms can be aggregated to show fewer, coarser aspects, even though they are not syn-onyms. Carenini et al. (2005) used a predefined domain-specific taxonomy to hierarchically aggre-gate aspect terms, but taxonomies of this kind are often not available. By contrast, we use only general-purpose taxonomies (e.g., WordNet), term similarity measures based on general-purpose tax-onomies or corpora, and hierarchical clustering.
We definemulti-granular aspect aggregationto be the task of partitioning a given set of aspect terms (generated by a previous aspect extraction stage) into knon-overlapping clusters, for multi-ple values of k. A further constraint is that the clusters have to beconsistent for differentk val-ues, meaning that if two aspect terms t1, t2 are placed in the same cluster for k = k1, then t1 andt2must also be grouped together (in the same cluster) for everyk = k2 withk2 < k1, i.e., for every coarser grouping. For example, if ‘waiter’ and ‘service’ are grouped together fork= 5, they must also be grouped together for k = 4,3,2 and (trivially) k = 1, to allow the user to feel that selecting a smaller number of aspect groups (narrowing the height of Fig. 1) has the effect of zooming out (without aspect terms jumping un-expectedly to other aspect groups), and similarly for zooming in.1 This requirement is satisfied by using agglomerative hierarchical clustering algo-rithms (Manning and Sch¨utze, 1999; Hastie et al., 2001), which in our case produce term hierarchies like the ones of Fig. 2. By using slices (nodes at a particular depth) of the hierarchies that are closer to the root or the leaves, we obtain fewer or more clusters. The vertical dotted lines of Fig. 2 illus-trate two slices fork = 4. By contrast, flat clus-tering algorithms (e.g.,k-means) do not satisfy the consistency constraint for differentkvalues.
Agglomerative clustering algorithms require a measure of the distance between individuals, in our case a measure of how similar two aspect terms are, and a linkage criterion to specify which clusters should be merged to form larger (coarser) clusters. To experiment with different term
sim-1We also require the clusters to be non-overlapping to
[image:2.595.309.514.82.230.2]make this zooming in and out metaphor clearer to the user.
Figure 2: Example aspect hierarchies produced by agglomerative hierarchical clustering.
food fish sushi dishes wine
food 5 4 4 4 2
fish 4 5 4 2 1
sushi 4 4 5 3 1
dishes 4 2 3 5 2
wine 2 1 1 2 5
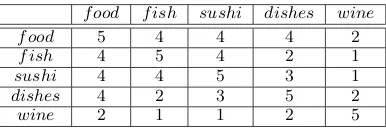
Table 1: An aspect term similarity matrix.
ilarity measures and linkage criteria, we decom-pose multi-granular aspect aggregation in two pro-cessing phases. Phase A fills in a symmetric ma-trix, like the one of Table 1, with scores show-ing the similarity of each pair of input aspect terms; the matrix in effect defines the distance measure to be used by agglomerative clustering. In Phase B, the aspect terms are grouped into k non-overlapping clusters, for varying values ofk, given the matrix of Phase A and a linkage crite-rion; a hierarchy like the ones of Fig. 2 is first formed via agglomerative clustering, and fewer or more clusters (for different values of k) are then obtained by using different slices of the hierarchy, as already discussed. Our two-phase decomposi-tion can also accommodate non-hierarchical clus-tering algorithms, provided that the consistency constraint is satisfied, but we consider only ag-glomerative hierarchical clustering in this paper.
[image:2.595.314.507.291.357.2]measure. Thirdly, the decomposition leads to high inter-annotator agreement, as we show experimen-tally. By contrast, in preliminary experiments we found that asking humans to directly evaluate as-pect hierarchies produced by hierarchical cluster-ing, or to manually create gold aspect hierarchies led to poor inter-annotator agreement.
We show that existing term similarity measures perform reasonably well in Phase A, especially when combined, but there is a large scope for im-provement. We also propose a novelsense pruning
method for WordNet-based similarity measures, which leads to significant improvements in Phase A. In Phase B, we experiment with agglomera-tive clustering using four different linkage criteria, concluding that they all perform equally well and that Phase B is almost a solved problem when the gold similarity matrix of Phase A is used; how-ever, further improvements are needed in the sim-ilarity measures of Phase A to produce a suffi-ciently good similarity matrix. We also make pub-licly available the datasets of our experiments.
Our main contributions are: (i) to the best of our knowledge, we are the first to consider multi-granular aspect aggregation (not just merg-ing near-synonyms) in ABSA without manually crafted domain-specific ontologies; (ii) we pro-pose a two-phase decomposition that allows previ-ous work on term similarity and hierarchical clus-tering to be reused and evaluated with high inter-annotator agreement; (iii) we introduce a novel sense pruning mechanism that improves WordNet-based similarity measures; (iv) we provide the first public datasets for multi-granular aspect aggrega-tion; (v) we show that the second phase of our de-composition is almost a solved problem, and that research should focus on the first phase. Although we experiment with customer reviews of products and services,ABSA and the work of this paper in particular are, at least in principle, also applicable to texts expressing opinions about other kinds of entities (e.g., politicians, organizations).
Section 2 below discusses related work. Sec-tions 3 and 4 present our work for Phase A and B, respectively. Section 5 concludes.
2 Related work
Most existing approaches to aspect aggregation aim to produce a single, flat partitioning of as-pect terms into asas-pect groups, rather than asas-pect groups at multiple granularities. The most
com-mon approaches (Liu, 2012) are to aggregate only synonyms or near-synonyms, using WordNet (Liu et al., 2005), statistics from corpora (Chen et al., 2006; Bollegala et al., 2007a; Lin and Wu, 2009), or semi-supervised learning (Zhai et al., 2010; Zhai et al., 2011), or to cluster the aspect terms using (latent) topic models (Titov and McDonald, 2008a; Guo et al., 2009; Brody and Elhadad, 2010; Jo and Oh, 2011). Topic models do not perform better than other methods (Zhai et al., 2010), and their clusters may overlap.2 The topic model of Titov et al. (2008b) uses two granularity levels; we consider many more (3–10 levels).
Carenini et al. (2005) used apredefined domain-specifictaxonomy and similarity measures to ag-gregate related terms. Yu et al. (2011) used a tai-lored version of an existing taxonomy. By con-trast, we assume no domain-specific taxonomy. Kobayashi et al. (2007) proposed methods to ex-tract aspect terms and relations between them, in-cluding hierarchical relations. They extract, how-ever, relations by looking for clues in texts (e.g., particular phrases). By contrast, we employ simi-larity measures and hierarchical clustering, which allows us to group similar aspect terms even when they do not cooccur in texts. Also, in contrast to Kobayashi et al. (2007), we respect the consis-tency constraint discussed in Section 1.
A similar task is taxonomy induction. Cimi-ano and Staab (2005) automatically construct tax-onomies from texts via agglomerative clustering, much as in our Phase B, but not in the context of ABSA, and without trying to learn a similarity ma-trix first. They also label the hierarchy’s concepts, a task we do not consider. Klapaftis and Manand-har (2010) show how word sense induction can be combined with agglomerative clustering to obtain more accurate taxonomies, again not in the con-text ofABSA. Our sense pruning method was in-fluenced by their work, but is much simpler than their word sense induction. Fountain and Lapata (2012) study unsupervised methods to induce con-cept taxonomies, without consideringABSA.
3 Phase A
We now discuss our work for Phase A. Recall that in this phase the input is a set of aspect terms and
2Topic models are typically also used to perform aspect
the goal is to fill in a matrix (Table 1) with scores showing the similarity of each pair of aspect terms.
3.1 Datasets used in Phase A
We used two benchmark datasets that we had pre-viously constructed to evaluateABSAmethods for subjectivity detection, aspect extraction, and as-pect score estimation, but not asas-pect aggregation. We extended them to support aspect aggregation, and we make them publicly available.3
The two original datasets contain sentences from customer reviews of restaurants and laptops, respectively. The reviews are manually split into sentences, and each sentence is manually anno-tated as ‘subjective’ (expressing opinion) or ‘ob-jective’ (not expressing opinion). The restaurants dataset contains 3,710 English sentences from the restaurant reviews of Ganu et al. (2009). The lap-tops dataset contains 3,085 English sentences from 394 customer reviews, collected from sites that host customer reviews. In the experiments of this paper, we use only the 3,057 (out of 3,710) sub-jective restaurant sentences and the 2,631 (out of 3,085) subjective laptop sentences.
For each subjective sentence, our datasets show the words that human annotators marked as aspect terms. For example, in “Thedessertwas divine!” the aspect term is ‘dessert’, and in “Really bad
waiter.” it is ‘waiter’. Among the 3,057 subjective restaurant sentences, 1,129 contain exactly one as-pect term, 829 more than one, and 1,099 no asas-pect term; a subjective sentence may express an opin-ion about the restaurant (or laptop) being reviewed without mentioning a specific aspect (e.g., “Really nice restaurant!”), which is why no aspect terms are present in some subjective sentences. There are 558 distinct multi-word aspect terms and 431 distinct single-word aspect terms in the subjective restaurant sentences. Among the 2,631 subjective sentences of the laptop reviews, 823 contain ex-actly one aspect term, 389 more than one, and 1,419 no aspect term. There are 273 distinct multi-word aspect terms and 330 distinct single-multi-word as-pect terms in the subjective laptop sentences.
From each dataset, we selected the 20 (distinct) aspect terms that the human annotators had anno-tated most frequently, taking annotation frequency to be an indicator of importance; there are only two multi-word aspect terms (‘hard drive’,
‘bat-3The datasets are available at http://nlp.cs.
aueb.gr/software.html.
tery life’) among the 20 most frequent ones in the laptops dataset, and none among the 20 most fre-quent aspect terms of the restaurants dataset. We then formed all the 190 possible pairs of the 20 terms and constructed an empty similarity matrix (Fig. 1), one for each dataset, which was given to three human judges to fill in (1: strong dis-similarity, 5: strong similarity).4 For each aspect term, all the subjective sentences mentioning the term were also provided, to help the judges un-derstand how the terms are used in the particu-lar domains (e.g., ‘window’ and ‘Windows’ have domain-specific meanings in laptop reviews).
The Pearson correlation coefficient indicated high inter-annotator agreement (0.81 for restau-rants,0.74for laptops). We also measured the ab-solute inter-annotator agreementa(l1, l2), defined below, wherel1, l2 are lists containing the scores (similarity matrix values) of two judges,N is the length of each list, andvmax,vmin are the largest
and smallest possible scores (5 and 1).
a(l1, l2) = N1
N
X
i=1
1−|l1(i)−l2(i)|
vmax−vmin
The absolute interannotator agreement was also high (0.90for restaurants,0.91for laptops).5With both measures, we compute the agreement of each judge with the averaged (for each matrix cell) scores of the other two judges, and we report the mean of the three agreement estimates. Finally, we created thegoldsimilarity matrix of each dataset by placing in each cell the average scores that the three judges had provided for that cell.
In preliminary experiments, we gave aspect terms to human judges, asking them to group any terms they considered near-synonyms. We then asked the judges to group the aspect terms into fewer, coarser groups by grouping terms that could be viewed as direct hyponyms of the same broader term (e.g., ‘pizza’ and ‘steak’ are both kinds of ‘food’), or that stood in a hyponym-hypernym re-lation (e.g., ‘pizza’ and ‘food’). We used the Dice coefficient to measure inter-annotator agree-ment, and we obtained reasonably good agreement for near-synonyms (0.77 for restaurants, 0.81 for laptops), but poor agreement for the coarser
as-4The matrix is symmetric; hence, the judges had to fill in
only half of it. The guidelines and an annotation tool that were given to the judges are available upon request.
5The Pearson correlation ranges from−1to1, whereas
pects (0.25 and 0.11).6 In other preliminary ex-periments, we asked human judges to rank alter-native aspect hierarchies that had been produced by applying agglomerative clustering with differ-ent linkage criteria to 20 aspect terms, but we ob-tained very poor inter-annotator agreement (Pear-son score−0.83for restaurants and0for laptops).
3.2 Phase A methods
We employed five term similarity measures. The first two are WordNet-based (Budanitsky and Hirst, 2006). The next two combine WordNet with statistics from corpora. The fifth one is a corpus-based distributional similarity measure.
The first measure isWu and Palmer’s(1994). It is actually a sense similarity measure (a term may have multiple senses). Given two sensessij, si0j0
of termsti, ti0, the measure is defined as follows:
WP(sij, si0j0) = 2· depth(lcs(sij, si0j0))
depth(sij) +depth(sij),
where lcs(sij, si0j0) is the least common
sub-sumer, i.e., the most specific common ancestor of the two senses in WordNet, and depth(s) is the depth of sensesin WordNet’s hierarchy.
Most terms have multiple senses, however, and word sense disambiguation methods (Navigli, 2009) are not yet robust enough. Hence, when given two aspect termsti, ti0, rather than particular
senses of the terms, a simplisticgreedyapproach is to compute the similarities of all the possible pairs of sensessij, si0j0ofti, ti0, and take the
sim-ilarity of ti, ti0 to be the maximum similarity of
the sense pairs (Bollegala et al., 2007b; Zesch and Gurevych, 2010). We use this greedy approach with all the WordNet-based measures, but we also propose a sense pruning mechanism below, which improves their performance. In all the WordNet-based measures, if a term is not in WordNet, we take its similarity to any other term to be zero.7
The second measure, PATH(sij, si0j0), is
sim-ply the inverse of the length (plus one) of the short-est path connecting the sensessij, si0j0in WordNet
(Zhang et al., 2013). Again, the greedy approach can be used with terms having multiple senses.
6The Dice coefficient ranges from0to1. There was a very
large number of possible responses the judges could provide and, hence, it would be inappropriate to use Cohen’sK.
7This never happened in the restaurants dataset. In the
laptops dataset, it only happened for ‘hard drive’ and ‘bat-tery life’. We use theNLTKimplementation of the first four measures (seehttp://nltk.org/) and our own imple-mentation of the distributional similarity measure.
The third measure isLin’s(1998), defined as:
LIN(sij, si0j0) = 2·ic(lcs(sij, si0j0))
ic(sij) +ic(si0j0) ,
where sij, si0j0 are senses of terms ti, ti0,
lcs(sij, si0j0) is the least common subsumer of
sij, si0j0 in WordNet, and ic(s) =−logP(s) is
theinformation contentof senses(Pedersen et al., 2004), estimated from a corpus. When the cor-pus is not sense-tagged, we follow the common approach of treating each occurrence of a word as an occurrence of all of its senses, when estimat-ingic(s).8 We experimented with two variants of Lin’s measure, one where the ic(s) scores were estimated from the Brown corpus (Marcus et al., 1993), and one where they were estimated from the (restaurant or laptop) reviews of our datasets.
The fourth measure is Jiang and Conrath’s
(1997), defined below. Again, we experimented with two variants ofic(s), as above.
JCN(sij, si0j0) =
1
ic(sij) +ic(si0j0)−2·lcs(sij, si0j0)
For all the above WordNet-based measures, we experimented with a sense pruning mechanism, which discards some of the senses of the aspect terms, before applying the greedy approach. For each aspect term ti, we consider all of its
Word-Net sensessij. For eachsijand each other aspect
term ti0, we compute (using PATH) the
similar-ity betweensij and each sensesi0j0ofti0, and we
consider therelevanceofsijtoti0 to be:9
rel(sij, ti0) = max
si0j0∈senses(ti0)PATH(sij, si 0j0)
The relevance of sij toallof the N other aspect
termsti0 is taken to be:
rel(sij) = N1 ·
X
i06=i
rel(sij, ti0)
For each aspect termti, we retain only its senses
sij with the top rel(sij) scores, which tends to
8http://www.d.umn.edu/˜tpederse/Data/
README-WN-IC-30.txt. We use the default counting.
9We also experimented with other similarity measures
when computing rel(sij, ti0), instead ofPATH, but there
without SP with SP
Method Rest. Lapt. Rest. Lapt.
WP 0.475 0.216 0.502 0.265
PATH 0.524 0.301 0.529 0.332
LIN@domain 0.390 0.256 0.456 0.343 LIN@Brown 0.434 0.329 0.471 0.391 JCN@domain 0.467 0.348 0.509 0.448 JCN@Brown 0.403 0.469 0.419 0.539
DS 0.283 0.517 (0.283) (0.517)
AVG 0.499 0.352 0.537 0.426 WN 0.490 0.328 0.530 0.395
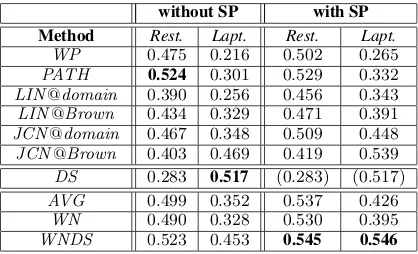
[image:6.595.83.292.80.207.2]WNDS 0.523 0.453 0.545 0.546
Table 2: Phase A results (Pearson correlation to gold similarities)withandwithoutsense pruning.
prune senses that are very irrelevant to the par-ticular domain (e.g., laptops). This sense prun-ing mechanism is novel, and we show experimen-tally that it improves the performance of all the WordNet-based similarity measures we examined. We also implemented a distributional simi-larity measure (Harris, 1968; Pad´o and Lap-ata, 2007; Cimiano et al., 2009; Zhang et al., 2013). Following Lin and Wu (2009), for each aspect term t, we create a vector ~v(t) =
hPMI(t, w1), . . . ,PMI(t, wn)i. The vector
com-ponents are the Pointwise Mutual Information scores oftand each wordwiof a corpus:
PMI(t, wi) =−logP(Pt)(t, w·P(iw) i)
We treatP(t, wi)as the probability oft, wi
cooc-curring in the same sentence, and we use the (lap-top or restaurant) reviews of our datasets as the corpus to estimate the probabilities. The distribu-tional similarityDS(t, t0)of two aspect termst, t0
is the cosine similarity of~v(t),~v(t0).10
Finally, we tried combinations of the similarity measures: AVG is the average of all five;WN is the average of the first four, which employ Word-Net; andWNDS is the average of WN andDS; all the scores range in[0,1]. We also tried regres-sion (e.g.,SVR), but there was no improvement.
3.3 Phase A experimental results
Each similarity measure was evaluated by comput-ing its Pearson correlation with the scores of the gold similarity matrix. Table 2 shows the results.
Our sense pruning consistently improves all four WordNet-based measures. It does not apply to
10We also experimented with Euclidean distance, a
nor-malized PMI (Bouma, 2009), and the Brown corpus, but there was no improvement.
DS, which is why theDSresults are identical with and without pruning. A pairedttest indicates that the other differences (with and without pruning) of Table 2 are statistically significant (p <0.05). We used the senses with the top fiverel(sij)scores for
each aspect termtiduring sense pruning. We also
experimented with keeping fewer senses, but the results were inferior or there was no improvement. Lin’s measure performed better when infor-mation content was estimated on the (much larger, but domain-independent) Brown corpus (LIN@Brown), as opposed to using the (domain-specific) reviews of our datasets (LIN@domain), but we observed no similar consistent pattern for
JCN. Given its simplicity,PATH performed re-markably well in the restaurants dataset; it was the best measure (including combinations) without sense pruning, and the best uncombined measure with sense pruning. It performed worse, however, compared to several other measures in the laptops dataset. Similar comments apply toWP, which is among the top-performing uncombined measures in restaurants, both with and without sense prun-ing, but the worst overall measure in laptops. DS
is the best overall measure in laptops when com-pared to measures without sense pruning, and the third best overall when compared to measures that use sense pruning, but the worst overall in restau-rants both with and without pruning. LIN and
JCN, which use both WordNet and corpus statis-tics, have a more balanced performance across the two datasets, but they are not top-performers in any of the two. Combinations of similarity mea-sures seem more stable across domains, as the re-sults ofAVG,WN, andWNDS indicate, though experiments with more domains are needed to in-vestigate this issue. WNDS is the best overall method with sense pruning, and among the best three methods without pruning in both datasets.
To get a better view of the performance of
WNDS with sense pruning, i.e., the best overall measure of Table 2, we compared it to two state of the art semantic similarity systems. First, we ap-plied the system of Han et al. (2013), one of the best systems of the recent *Sem 2013 semantic text similarity competition, to our Phase A data. The performance (Pearson correlation with gold similarities) of the same system on the widely used
Method Restaurants Laptops
Han et al. (2013) 0.450 0.471
Word2Vec 0.434 0.485
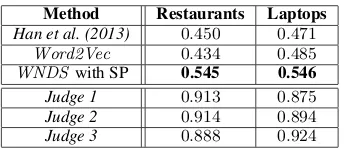
WNDSwith SP 0.545 0.546
Judge 1 0.913 0.875 Judge 2 0.914 0.894 Judge 3 0.888 0.924
Table 3: Phase A results (Pearson correlation to gold similarities) of WNDS with SP against se-mantic similarity systems and human judges.
[image:7.595.102.274.78.152.2]which suggests that our data are more difficult.11 We also employed the recent Word2Vec sys-tem, which computes continuous vector space rep-resentations of words from large corpora and has been reported to improve results in word similarity tasks (Mikolov et al., 2013). We used the English Wikipedia to compute word vectors with 200 fea-tures.12 The similarity between two aspect terms was taken to be the cosine similarity of their vec-tors. This system performed better than Han et al.’s with laptops, but not with restaurants.
Table 3 shows that WNDS (with sense prun-ing) performed clearly better than the system of Han et al. and Word2Vec. Table 3 also shows the Pearson correlation of each judge’s scores to the gold similarity scores, as an indication of the best achievable results. Although WNDS (with sense pruning) performs reasonably well in both domains,13there is large scope for improvement.
4 Phase B
In Phase B, the aspect terms are to be grouped into k non-overlapping clusters, for varying val-ues ofk, given a Phase A similarity matrix. We experimented with both the gold similarity matrix of Phase A and similarity matrices produced by
WNDS(with SP), the best Phase A method.
4.1 Phase B methods
We experimented with agglomerative clustering and four linkage criteria: single, complete, av-erage, and Ward (Manning and Sch¨utze, 1999; Hastie et al., 2001). Letd(t1, t2)be the distance of
11The system of Han et al. (2013) is available from
http://semanticwebarchive.cs.umbc.edu/ SimService/; we use theSTSsimilarity.
12Word2Vec is available from https://code.
google.com/p/word2vec/. We used the continuous bag of words model with default parameters, the first billion characters of the English Wikipedia, and the preprocessing of
http://mattmahoney.net/dc/textdata.html.
13Recall that the Pearson correlation ranges from−1to1.
two individual instancest1, t2; in our case, the in-stances are aspect terms andd(t1, t2)is the inverse of the similarity oft1, t2, defined by the Phase A similarity matrix (gold or produced by WNDS). Different linkage criteria define differently the dis-tance of two clusters D(C1, C2), which affects the choice of clusters that are merged to produce coarser (higher-level) clusters:
Dsingle(C1, C2) = t min
1∈C1,t2∈C2d(t1, t2)
Dcompl(C1, C2) = t max
1∈C1,t2∈C2d(t1, t2)
Davg(C1, C2) = |C 1 1||C2|
X
t1∈C1
X
t2∈C2
d(t1, t2)
Complete linkage tends to produce more compact clusters, compared to single linkage, with average linkage being in between. Ward minimizes the to-tal in-cluster variance; consult Milligan (1980) for further details.14
4.2 Phase B experimental results
To evaluate thekclusters produced at each aspect granularity by the different linkage criteria, we used theSilhouette Index(SI) (Rousseeuw, 1987), a cluster evaluation measure that considers both inter- and intra-cluster coherence.15 Given a set of clusters{C1, . . . , Ck}, eachSI(Ci)is defined as:
SI(Ci) = |C1i|· |Ci|
X
j=1
bj−aj
max(bj, aj),
where aj is the mean distance from thej-th
in-stance ofCito the other instances inCi, andbj is
the mean distance from thej-th instance of Cito
the instances in the cluster nearest toCi. Then:
SI({C1, . . . , Ck}) = 1k · k
X
i=1
SI(Ci)
We always use the correct (gold) distances of the instances (terms) when computing theSI scores.
As shown in Fig. 3,no linkage criterion clearly outperforms the others, when the gold matrix of Phase A is used; all four criteria perform reason-ably well. Note that the SI ranges from −1 to
14We used the SCIPY implementations of
agglomera-tive clustering with the four criteria (see http://www. scipy.org), relying onmaxclustto obtain the slice of the resulting hierarchy that leads tok(or approx.k) clusters.
15We used the SI implementation of Pedregosa et
(a) restaurants (b) laptops
Figure 3: Silhouette Index (SI) results for Phase B, using thegoldsimilarity matrix of Phase A.
(a) restaurants (b) laptops
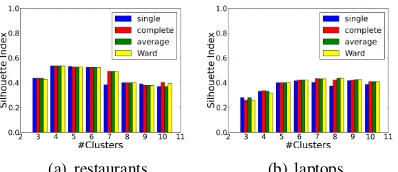
Figure 4: SI results for Phase B, using theWNDS (with SP)similarity matrix of Phase A.
1, with higher values indicating better clustering. Figure 4 shows thatwhen the similarity matrix of WNDS (with SP) is used, theSI scores deterio-rate significantly; again, there is no clear winner among the linkage criteria, but average and Ward seem to be overall better than the others.
[image:8.595.86.285.89.175.2](a) Restaurants (b) Laptops
Figure 5: Human evaluation of aspect groups.
In a final experiment, we showed clusterings of varying granularities (kvalues) to four human judges (graduate CS students). The clusterings were produced by two systems: one that used the
gold similarity matrix of Phase A and agglomer-ative clustering with average linkage in Phase B, and one that used thesimilarity matrix ofWNDS
(with SP) and again agglomerative clustering with average linkage. We showed all the clusterings to all the judges. Each judge was asked to
eval-uate each clustering on a 1–5 scale. We measured the absolute inter-annotator agreement, as in Sec-tion 3.1, and found high agreement in all cases (0.93 and 0.83 for the two systems, respectively, in restaurants; 0.85 for both in laptops).16
[image:8.595.86.283.241.327.2]Figure 5 shows the average human scores of the two systems for different granularities. The judges considered the aspect groups always per-fect or near-perper-fect when the gold similarity ma-trix of Phase A was used, but they found the as-pect groups to be of rather poor quality when the similarity matrix of the best Phase A mea-sure was used. These results, along with those of Fig. 3–4, show thatmore effort needs to be devoted to improving the similarity measures of Phase A, whereas Phase B is in effect an almost solved problem, if a good similarity matrix is available.
5 Conclusions
We considered a new, more demanding form of aspect aggregation inABSA, which aims to aggre-gate aspects at multiple granularities, as opposed to simply merging near-synonyms, and without as-suming that manually crafted domain-specific on-tologies are available. We decomposed the prob-lem in two processing phases, which allow pre-vious work on term similarity and hierarchical clustering to be reused and evaluated appropri-ately with high inter-annotator agreement. We showed that the second phase, where we used ag-glomerative clustering, is an almost solved prob-lem, whereas further research is needed in the first phrase, where term similarity measures are em-ployed. We also introduced a sense pruning mech-anism that significantly improves WordNet-based similarity measures, leading to a measure that out-performs state of the art similarity methods in the first phase of our decomposition. We also made publicly available the datasets of our experiments.
Acknowledgments
We thank G. Batistatos, A. Zosakis, and G. Lam-pouras for their annotations in Phase A. We thank A. Kosmopoulos, G. Lampouras, P. Malakasiotis, and I. Lourentzou for their annotations in Phase B.
16The Pearson correlation cannot be computed, as several
[image:8.595.87.282.489.576.2]References
E. Agirre, E. Alfonseca, K. Hall, J. Kravalova, M. Pas¸ca, and A. Soroa. 2009. A study on similar-ity and relatedness using distributional and
wordnet-based approaches. In Proceedings of the Annual
Conference of NAACL, pages 19–27, Boulder, CO, USA.
D. Bollegala, Y. Matsuo, and M. Ishizuka. 2007a. An integrated approach to measuring semantic sim-ilarity between words using information available
on the web. InProceedings of HLT-NAACL, pages
340–347, Rochester, NY, USA.
D. Bollegala, Y. Matsuo, and M. Ishizuka. 2007b. Measuring semantic similarity between words using
web search engines. InProceedings of the 16th
In-ternational Conference of WWW, volume 766, pages 757–766, Banff, Alberta, Canada.
G. Bouma. 2009. Normalized (pointwise) mutual
in-formation in collocation extraction. Proceedings of
the Biennial Conference of GSCL, pages 31–40. S. Brody and N. Elhadad. 2010. An unsupervised
aspect-sentiment model for online reviews. In
Pro-ceedings of the Annual Conference of NAACL, pages 804–812, Los Angeles, CA, USA.
A. Budanitsky and G. Hirst. 2006. Evaluating
WordNet-based measures of lexical semantic
relat-edness. Computational Linguistics, 32(1):13–47.
G. Carenini, R. T. Ng, and E. Zwart. 2005.
Extract-ing knowledge from evaluative text. InProceedings
of the 3rd International Conference on Knowledge Capture, pages 11–18, Banff, Alberta, Canada. H. Chen, M. Lin, and Y. Wei. 2006. Novel association
measures using web search with double checking. InProceedings of the 21st International Conference of COLING and the 44th Annual Meeting of ACL, pages 1009–1016, Sydney, Australia.
P. Cimiano and S. Staab. 2005. Learning concept hier-archies from text with a guided hierarchical
cluster-ing algorithm. InProceedings of ICML – Workshop
on Learning and Extending Lexical Ontologies with Machine Learning Methods, Bonn, Germany. P. Cimiano, A. M¨adche, S. Staab, and J. V¨olker. 2009.
Ontology learning. In Handbook on Ontologies,
pages 245–267. Springer.
D. L. Davies and D. W. Bouldin. 1979. A cluster
sepa-ration measure. IEEE Transactions on Pattern
Anal-ysis and Machine Intelligence, 1(2):224–227. J. C. Dunn. 1974. Well-separated clusters and optimal
fuzzy partitions. Journal of Cybernetics, 4(1):95–
104.
T. Fountain and M. Lapata. 2012. Taxonomy induction
using hierarchical random graphs. InProceedings of
NAACL:HLT, pages 466–476, Montreal, Canada.
G. Ganu, N. Elhadad, and A. Marian. 2009. Beyond the stars: Improving rating predictions using review
text content. In Proceedings of the 12th
Interna-tional Workshop on the Web and Databases, Prov-idence, RI, USA.
H. Guo, H. Zhu, Z. Guo, X. Zhang, and Z. Su. 2009. Product feature categorization with multilevel latent
semantic association. InProceedings of the 18th
CIKM, pages 1087–1096.
L. Han, A. Kashyap, T. Finin, J. Mayfield, and J. Weese. 2013. Umbc ebiquity-core: Semantic
tex-tual similarity systems. InProceedings of the 2nd
Joint Conference on Lexical and Computational Se-mantics, pages 44–52, Atlanta, GA, USA.
Z. Harris. 1968. Mathematical Structures of
Lan-guage. Wiley.
T. Hastie, R. Tibshirani, and J. Friedman. 2001. The
Elements of Statistical Learning. Springer.
J. J. Jiang and D. W. Conrath. 1997. Semantic similar-ity based on corpus statistics and lexical taxonomy. InProceedings of ROCLING, pages 19–33, Taiwan, China.
Y. Jo and A. H. Oh. 2011. Aspect and sentiment
unifi-cation model for online review analysis. In
Proceed-ings of the 4th International Conference of WSDM, pages 815–824, Hong Kong, China.
I. P. Klapaftis and S. Manandhar. 2010. Taxonomy
learning using word sense induction. InProceedings
of NAACL, pages 82–90, Los Angeles, CA, USA. N. Kobayashi, K. Inui, and Y. Matsumoto. 2007.
Ex-tracting aspect-evaluation and aspect-of relations in
opinion mining. InProceedings of the Joint
Confer-ence on EMNLP-CoNLL, pages 1065–1074, Prague, Czech Republic.
D. Lin and X. Wu. 2009. Phrase clustering for
dis-criminative learning. InProceedings of ACL, pages
1030–1038, Suntec, Singapore. ACL.
D. Lin. 1998. An information-theoretic definition of
similarity. InProceedings of the 15th ICML, pages
296–304, Madison, WI, USA.
B. Liu, M. Hu, and J. Cheng. 2005. Opinion observer: analyzing and comparing opinions on the web. In
Proceedings of the 14th International Conference of
WWW, pages 342–351, Chiba, Japan.
B. Liu. 2012.Sentiment Analysis and Opinion Mining.
Synthesis Lectures on Human Language Technolo-gies. Morgan & Claypool.
C. D. Manning and H. Sch¨utze. 1999. Foundations
of Statistical Natural Language Processing. MIT Press, Cambridge, MA, USA.
M. P. Marcus, M. A. Marcinkiewicz, and B. Santorini. 1993. Building a large annotated corpus of
en-glish: The penn treebank. Computational
T. Mikolov, C. Kai, G. Corrado, and J. Dean. 2013. Efficient estimation of word representations in
vec-tor space. CoRR, abs/1301.3781.
G.W. Milligan. 1980. An examination of the effect of six types of error perturbation on fifteen clustering
algorithms. Psychometrika, 45(3):325–342.
S. Moghaddam and M. Ester. 2012. On the design of
lda models for aspect-based opinion mining. In
Pro-ceedings of the 21st CIKM, pages 803–812, Maui, HI, USA.
R. Navigli. 2009. Word sense disambiguation: A sur-vey.ACM Computing Surveys, 41(2):10:1–10:69. S. Pad´o and M. Lapata. 2007. Dependency-based
con-struction of semantic space models. Computational
Linguistics, 33(2):161–199.
T. Pedersen, S. Patwardhan, and J. Michelizzi. 2004. Wordnet::similarity: measuring the relatedness of
concepts. InProceedings of NAACL:HTL –
Demon-strations, pages 38–41, Boston, MA, USA.
F. Pedregosa, G. Varoquaux, A. Gramfort, V. Michel, B. Thirion, O. Grisel, M. Blondel, P. Pretten-hofer, R. Weiss, V. Dubourg, J. Vanderplas, A. Pas-sos, D. Cournapeau, M. Brucher, M. Perrot, and E. Duchesnay. 2011. Scikit-learn: Machine
learn-ing in python. Journal of Machine Learning
Re-search, 12:2825–2830.
P. Rousseeuw. 1987. Silhouettes: a graphical aid to the interpretation and validation of cluster analysis.
Journal of Computational and Applied
Mathemat-ics, 20(1):53–65.
I. Titov and R. T. McDonald. 2008a. A joint model of text and aspect ratings for sentiment summarization. InProceedings of the 46th Annual Meeting of
ACL-HLT, pages 308–316, Columbus, OH, USA.
I. Titov and R. T. McDonald. 2008b. Modeling online
reviews with multi-grain topic models. In
Proceed-ings of the 17th International Conference of WWW, pages 111–120, Beijing, China.
Z. Wu and M. Palmer. 1994. Verbs semantics and
lexi-cal selection. InProceedings of the 32nd ACL, pages
133–138, Las Cruces, NM, USA.
J. Yu, Z. Zha, M. Wang, K. Wang, and T. Chua. 2011. Domain-assisted product aspect hierarchy genera-tion: towards hierarchical organization of
unstruc-tured consumer reviews. InProceedings of EMNLP,
pages 140–150, Edinburgh, UK.
T. Zesch and I. Gurevych. 2010. Wisdom of crowds versus wisdom of linguists - measuring the semantic
relatedness of words. Natural Language
Engineer-ing, 16(1):25–59.
Z. Zhai, B. Liu, H. Xu, and P. Jia. 2010. Group-ing product features usGroup-ing semi-supervised learnGroup-ing
with soft-constraints. In Proceedings of the 23rd
International Conference of COLING, pages 1272– 1280, Beijing, China.
Z. Zhai, B. Liu, H. Xu, and P. Jia. 2011. Clustering
product features for opinion mining. InProceedings
of the 4th International Conference of WSDM, pages 347–354, Hong Kong, China.
Z. Zhang, A. Gentile, and F. Ciravegna. 2013. Re-cent advances in methods of lexical semantic
relat-edness - a survey. Natural Language Engineering,