3938
Question Answering as an Automatic Evaluation Metric for News Article
Summarization
Matan Eyal1, 2, Tal Baumel1, 3, Michael Elhadad1
1Dept. Computer Science, Ben Gurion University 2IBM Research, Israel,3Microsoft
{mataney, elhadad}@cs.bgu.ac.il, [email protected]
Abstract
Recent work in the field of automatic sum-marization and headline generation focuses on maximizing ROUGE scores for various news datasets. We present an alternative, extrin-sic, evaluation metric for this task,Answering Performance for Evaluation of Summaries. APES utilizes recent progress in the field of reading-comprehension to quantify the ability of a summary to answer a set of manually cre-ated questions regarding central entities in the source article. We first analyze the strength of this metric by comparing it to known man-ual evaluation metrics. We then present an end-to-end neural abstractive model that maxi-mizes APES, while increasing ROUGE scores to competitive results.
1 Introduction
The task of automatic text summarization aims to produce a concise version of a source document while preserving its central information. Current summarization models are divided into two ap-proaches,extractiveandabstractive. In extractive summarization, summaries are created by select-ing a collection of key sentences from the source document (e.g., Nallapati et al. (2017); Narayan et al.(2018)). Abstractive summarization, on the other hand, aims to rephrase and compress the in-put text in order to create the summary. Progress in sequence-to-sequence models (Sutskever et al.,
2014) has led to recent success in abstractive sum-marization models. Current models (Nallapati et al.,2016;See et al.,2017;Paulus et al.,2017;
Celikyilmaz et al., 2018) made various adjust-ments to sequence-to-sequence models to gain im-provements in ROUGE (Lin,2004) scores.
ROUGE has achieved its status as the most common method for summaries evaluation by showing high correlation to manual evaluation methods, e.g., the Pyramid method (Nenkova
See et al.(2017)’s Summary:bolton will offer new contracts to emile heskey, 37, eidur gudjohnsen, 36, and adam bogdan, 27. heskey and gudjohnsen joined on short-term deals in december. eidur gudjohnsen has scored five times in the championship .
APES score: 0.33
Baseline Model Summary (Encoder / Decoder / Attention / Copy / Coverage):bolton will offer new contracts to emile hes-key, 37, eidur gudjohnsen, 36, and goalkeeper adam bogdan, 27. heskey and gudjohnsen joined on short-term deals in december, and have helped neil lennon ’s side steer clear of relegation. ei-dur gudjohnsen has scored five times in the championship, as well as once in the cup this season .
APES score: 0.33
Our Model (APES optimization):bolton will offer new con-tracts to emile heskey, 37, eidur gudjohnsen, 36, and goalkeeper adam bogdan, 27. heskey joined on short-term deals in decem-ber, and have helped neil lennon ’s side steer clear of relegation. eidur gudjohnsen has scored five times in the championship, as well as once in the cup this season. lennon has also fined mid-fielders barry bannan and neil danns two weeks wages this week. both players have apologised to lennon .
APES score: 1.00
Questions from the CNN/Daily Mail Dataset:
Q: goalkeeper also rewarded with new contract;A:adam bogdan
Q: and neil danns both fined by club after drinking inci-dent;A:barry bannan
Q: barry bannan and both fined by club after drinking in-cident;A:neil danns
Figure 1: Example 3083 from the test set.
et al.,2007). Tasks like TAC AESOP (Owczarzak and Dang, 2011) used ROUGE as a strong base-line and confirmed the correlation of ROUGE with manual evaluation.
we introduce a new automatic evaluation metric more suitable for such single reference news arti-cle datasets.
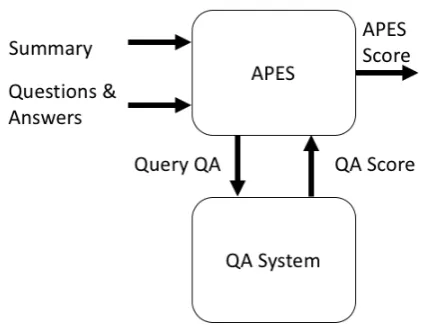
We define APES, Answering Performance for
Evaluation of Summaries, a new metric for au-tomatically evaluating summarization systems by querying summaries with a set of questions central to the input document (see Fig.1).
Reducing the task of summaries evaluation to an extrinsic task such as question answering is in-tuitively appealing. This reduction, however, is ef-fective only under specific settings: (1) Availabil-ity of questions focusing on central information and (2) availability of a reliable question answer-ing (QA) model.
Concerning issue 1, questions focusing on salient entities can be available as part of the dataset: the headline generation dataset most used in recent years, theCNN/Daily Maildataset ( Her-mann et al., 2015), was constructed by creating questions about entities that appear in the refer-ence summary. Since the target summary contains salient information from the source document, we consider all entities appearing in the target sum-mary as salient entities. In other cases, salient questions can be generated in an automated man-ner, as we discuss below.
Concerning issue 2, we focus on a relatively easy type of questions: given source documents and associated questions, a QA system can be trained over fill-in-the-blank type questions as was shown in Hermann et al. (2015) and Chen et al.
(2016). In their work,Chen et al.(2016) achieve ‘ceiling performance’ for the QA task on the CNN/Daily Mail dataset. We empirically assess in our work whether this performance level (accu-racy of 72.4 and 75.8 overCNNandDaily Mail re-spectively) makes our evaluation scheme feasible and well correlated with manual summary evalua-tion.
[image:2.595.309.520.68.233.2]Given the availability of salient questions and automatic QA systems, we propose APES as an evaluation metric for news article datasets, the most popular summarization genre in recent years. To measure the APES metric of a candidate summary, we run a trained QA system with the summary as input alongside a set of questions as-sociated with the source document. The APES metric for a summarization model is the percent-age of questions that were answered correctly over the whole dataset, as depicted in Fig.2. We leave
Figure 2: Evaluation flow of APES.
the task of extending this method to other genres for future work.
Our contributions in this work are: (1) We first present APES, a new extrinsic summarization evaluation metric; (2) We show APES strength through an analysis of its correlation with Pyra-mid and Responsiveness manual metrics; (3) we present a new abstractive model which maximizes APES by increasing attention scores of salient entities, while increasing ROUGE to competitive level. We make two software packages avail-able online: (a) An evaluation library which re-ceives the same input as ROUGE and produces both APES and ROUGE scores.1 (b) Our PyTorch (Paszke et al.,2017) based summarizer that opti-mizes APES scores together with trained models.2
2 Related Work
2.1 Evaluation Methods
Automatic evaluation metrics of summarization methods can be categorized into either intrinsic or extrinsic metrics. Intrinsic metrics measure a summary’s quality by measuring its similarity to a manually produced target gold summary or by inspecting properties of the summary. Exam-ples of such metrics include ROUGE (Lin,2004), Basic Elements (Hovy et al., 2006) and Pyramid (Nenkova et al., 2007). Alternatively, extrinsic metrics test the ability of a summary to support performing related tasks and compare the perfor-mance of humans or systems when completing a task that requires understanding the source docu-ment (Steinberger and Jeˇzek,2012). Such extrin-sic tasks may include text categorization,
infor-1
www.github.com/mataney/APES
mation retrieval, question answering (Jing et al.,
1998) or assessing the relevance of a document to a query (Hobson et al.,2007).
ROUGE, or “Recall-Oriented Understudy for Gisting Evaluation” (Lin, 2004), refers to a set of automatic intrinsic metrics for evaluating au-tomatic summaries. ROUGE-N scores a candi-date summary by counting the number of N-gram overlaps between the automatic summary and the reference summaries. Other notable metrics from this family are ROUGE-L, where scores are given by the Longest Common Subsequence (LCS) be-tween the suggested and reference documents, and ROUGE-SU4, which uses skip-bigram, a more flexible method for computing the overlap of bi-grams.
The Pyramid method (Nenkova et al.,2007) is a manual evaluation metric that analyzes multiple human-made summaries into “Summary Content Units” (SCUs) and assigns importance weights to each SCU. Different summaries are scored by as-sessing the extent to which they convey SCUs ac-cording to their respective weights. Pyramid is most effective when multiple human-made sum-maries alongside manual intervention to detect SCUs in source and target documents. The Ba-sic Elements method (Hovy et al., 2006), an au-tomated procedure for finding short fragments of content, has been suggested to automate a method related to Pyramid. Like Pyramid, this method requires multiple human-made gold summaries, making this method expensive in time and cost. Responsiveness (Dang, 2005), another manual metric is a measure of overall quality combining both content selection, like Pyramid, and linguis-tic quality. Both Pyramid and Responsiveness are the standard manual approaches for content evalu-ation of summaries.
Automated Pyramid evaluation has been at-tempted in the past (Owczarzak,2009;Yang et al.,
2016; Hirao et al., 2018). This task is complex because it requires (1) identifying SCUs in a text, which requires syntactic parsing and the extraction of key subtrees from the identified units, and (2) the clustering of these extracted textual elements into semantically similar SCUs. These two opera-tions are noisy, and the compounded performance summary evaluation is relying on noisy intermedi-ary representation accordingly suffers.
Other relevant quantities for summaries qual-ity assessment include: readabilqual-ity (or fluency),
grammaticality, coherence and structure, focus, referential clarity, and non-redundancy. Although some automatic methods were suggested as sum-marization evaluation metrics (Vadlapudi and Ka-tragadda, 2010; Tay et al., 2017), these metrics are commonly assessed manually, and, therefore, rarely reported as part of experiments.
Our proposed evaluation method, APES, at-tempts to capture the capability of a summary to enable readers to answer questions – similar to the manual task initially discussed inJing et al.(1998) and recently reported inNarayan et al.(2018). Our contribution consists of automating this method and assessing the feasibility of the resulting ap-proximation.
2.2 Neural Methods for Abstractive and Extractive Summarization
The first paper to use an end-to-end neural network for the summarization task wasRush et al.(2015): this work is based on a sequence-to-sequence model (Sutskever et al., 2014) augmented with an attention mechanism (Bahdanau et al., 2014).
Nallapati et al.(2016) was the first to tackle the headline generation problem using theCNN/Daily Mail dataset (Hermann et al., 2015) adopted for the summarization task.
See et al.(2017) followed the work ofNallapati et al.(2016) and added an additional loss term to reduce repetitions at decoding time. Paulus et al.
(2017) introduces intra-attention in order to attend over both the input and previously generated out-puts. The authors also present a hybrid learning objective designed to maximize ROUGE scores using Reinforcement Learning.
All the papers mentioned above have been eval-uated using ROUGE, and all, except forRush et al.
(2015), usedCNN/Daily Mailas their main head-line generation dataset. Of all the mentioned mod-els we compare our suggested model only to (See et al.,2017), as it is the only paper to publish out-put summaries.
3 APES
re-Original Reference Summary:
Arsenal beat Burnley 1-0 in the EPL. a goal from Aaron Ramsey secured all three points. win cuts Chelsea ’s EPL lead to four points .
Produces questions:
Q: beat @entity7 1-0 in the @entity4;A: Arsenal
Q: @entity0 beat 1-0 in the @entity4;A: Burnley
Q: @entity0 beat @entity7 1-0 in the ;A: EPL
Q: a goal from secured all three points;A: Aaron Ramsey
Q: win cuts ’s @entity4 lead to four points;A: Chelsea
Q: win cuts @entity19 ’s lead to four points;A: EPL
Figure 3: Example 202 from theCNN/Daily Mailtest set.
ceived summaries. The evaluation process is de-picted in Fig.2. We useChen et al.(2016)’s model trained on theCNN dataset as our QA system for all our experiments. For a given summarizer and a given dataset, APES reports the average number of questions correctly answered from the summaries produced by the system.
This method is especially relevant for the main headline generation dataset used in recent years, the CNN/Daily Mail dataset, as it was initially created for the question answering task by Her-mann et al. (2015). It contains 312,085 articles with relevant questions scraped from the two news agencies’ websites. The questions were created by removing different entities from the manually produced highlights to create 1,384,887 fill-in-the-blank questions. The dataset was later repur-posed by Cheng and Lapata (2016) and Nallap-ati et al.(2016) to the summarization task by re-constructing the original highlights from the ques-tions. Fig.3shows an example for creating ques-tions out of a given summary.
3.1 Using APES as an Evaluation Metric for any News Datasets
When questions are not intrinsically available, one requires to (1) automatically generate relevant questions; (2) use an appropriate automatic QA system.
Similarly to the method used inHermann et al.
(2015), we produce fill-in-the-blank questions in the following way: given a reference summary, we find all possible entities, (i.e., Name, Nation-ality, Organization, Geopolitical Entity or Facil-ity) using an NER system (Honnibal and Johnson,
2015) and we create fill-in-the-blank type ques-tions where the answers are these entities. We pro-vide code for this procedure and apply it on the
AESOPdatasets in our experiments3.
For the automatic QA system, we reused in our experiment the same QA system trained on CNN/Daily Mail for different News datasets (in-cluding AESOP). To enable reproducibility, the trained models used are available online.
4 APES on the TAC2011 AESOP Task
To evaluate if an automatic metric can accu-rately measure a summarization system perfor-mance, we measure its correlation to manual met-rics. The TAC 2011 Automatically Evaluating Summaries of Peers (AESOP) task (Owczarzak and Dang, 2011) has provided a dataset that in-cludes, alongside the source documents and refer-ence summaries, three manual metrics: Pyramid (Nenkova et al., 2007), Overall Responsiveness (Dang, 2005) and Overall Readability. Two sets of documents are provided, we use only the docu-ments from the first set (Generic summarization), as the second set is relevant to the update summa-rization task.
To evaluate APES on the AESOP dataset, we create the required set of questions as presented in Fig. 3. We used the same QA system (Chen et al.,2016) trained on theCNNdataset. This sys-tem is a competent QA syssys-tem for this dataset, as both AESOP and CNN consist of news articles. Training a QA model on the AESOP dataset would be optimal, but it is not possible due to the small size of this dataset. Nonetheless, even this incom-plete QA system reports valuable results that jus-tify APES value.
While the two datasets are similar, they dif-fer dramatically in the type of topics the articles cover. CNN/Daily Mail articles deal with peo-ple, or more generally, Named Entities, averag-ing 6 named entities per summary. In contrast, TAC summaries average 0.87 entities per sum-mary. The TAC dataset is divided into various topics. The first four topics, Accidents and Nat-ural Disasters,Attacks,Health and Safetyand En-dangered Resources average 0.65 named entities per summary, making them incomparable to the typical case in theCNN/Daily Mail dataset. The last topic,Investigations and Trials, averages 3.35 named entities per summary, making it more sim-ilar. We report correlation only on this segment of TAC, which contains 204 documents.
3https://github.com/mataney/
ROUGE-1 ROUGE-2 ROUGE-L ROUGE-SU APES
Pyramid 0.590 0.468* 0.599 0.563* 0.608
[image:5.595.119.481.61.105.2]Responsiveness 0.540 0.518* 0.537 0.541 0.576
Table 1: Pearson Correlation of ROUGE and APES against Pyramid and Responsiveness on summary level. Sta-tistically significant differences are marked with *.
R-1 R-2 R-L R-SU APES
R-1 1.00 0.83 0.92 0.94 0.66
R-2 1.00 0.82 0.90 0.61
R-L 1.00 0.89 0.66
R-SU 1.00 0.67
APES 1.00
Table 2: Correlation matrix of ROUGE and APES.
We follow the work of Louis and Nenkova
(2013) and compare input level APES scores with manual Pyramid and Responsiveness scores pro-vided in the AESOP task. Results are in Table1. In Input level, correlation is computed for each summary against its manual score. In contrast, system levelreports the average score for a sum-marization system over the entire dataset.
While ROUGE baselines were beaten only by a very small number of suggested metrics in the original AESOP task, we find that APES shows better correlation than the popular R-1, R-2 and R-L, and the strong R-SU. Although showing sta-tistical significance for our hypothesis is difficult because of the small dataset size, we claim APES gives an additional value comparing to ROUGE: ROUGE metrics are highly correlated with each other (around 0.9) as shown in Table2, indicating that multiple ROUGE metrics provide little addi-tional information. In contrast, APES is not cor-related with ROUGE metrics to the same extent (around 0.6). The above suggests that APES of-fers additional information regarding the text in a manner that ROUGE does not. For this reason, we believe APES complements ROUGE.
Louis and Nenkova (2013) further shows that ROUGE correlation to manual scores tends to drop when reducing the number of reference sum-maries. While APES is not immune to this, as the number of questions becomes smaller when the number of reference summaries is reduced, it still performs well when reducing the number of references to a single document. In the AESOP dataset, when comparing with respect to each of the 8 assessors separately on Pyramid and
Respon-Model APES #Entities #Salient
Entities
See et al.(2017) 38.2 4.90 2.57
Baseline model 39.8 4.99 2.61
[image:5.595.315.518.156.220.2]Gold Summaries 85.5 6.00 4.90
Table 3: Average number of entities and salient entities.
siveness, the correlation of APES is highest in 7 out of 16 trials, while that of R1 is highest in 6 tri-als and RL in 2 tritri-als. In general, the correlation between any of the metrics and single references is extremely noisy, indicating that reliance on evalu-ations of a single reference, which is standard on large-scale summarization datasets, is far from sat-isfactory.
We have established that APES achieves equal or improved correlation with manual metrics when compared to ROUGE, and captures a different type of information than ROUGE, by that, APES can complement ROUGE as an automatic evalua-tion metric. We now turn to develop a model that directly attempts to optimize APES.
5 Model
News articles include a high number of named en-tities. When analyzing systems performance on APES (Table 3), a system may fail either when it misses to generate a salient entity in the sum-mary, or when it includes the salient entity, but in a context not relevant to corresponding questions. When this happens, the QA system would not be able to identify the entity as an answer to a ques-tion referring to the context.
[image:5.595.79.283.157.239.2]a decrease in the QA accuracy, as the number of possible answers increases, which would distract the QA system. This has motivated us in suggest-ing the followsuggest-ing model.
5.1 Baseline Model
To experiment with direct optimization of APES, we reconstruct as a starting point a model that encapsulates the key techniques used in recent abstractive summarization models. Our model is based on the OpenNMT project (Klein et al.,
2017). All PyTorch (Paszke et al.,2017) code, in-cluding entities attention and beam search refine-ment is available online4. We also include gener-ated summaries and trained models in this reposi-tory.
Recent work in the field of abstractive summa-rization (Rush et al.,2015;Nallapati et al.,2016;
See et al.,2017;Paulus et al.,2017) share a com-mon architecture as the foundation for their neu-ral models: an encoder-decoder model (Sutskever et al., 2014) with an attention mechanism ( Bah-danau et al., 2014). Nallapati et al. (2016) and
See et al.(2017) augment this model with a copy mechanism (Vinyals et al., 2015). This architec-ture minimizes the following loss function:
losst=−logP(w∗t)
loss= 1 Ty
Ty
X
t=0 losst
(1)
losst, is the negative log likelihood of generat-ing the gold target word wt∗ at timestep t where
P(·)is the probability distribution over the vocab-ulary. We refer the reader toSee et al.(2017) for a more detailed description of this architecture.
UnlikeSee et al.(2017), we do not train a spe-cific coverage mechanism to avoid repetitions. In-stead, we incorporate Wu et al. (2016)’s refine-ments of beam search in order to manipulate both the summaries’ coverage and their length. In the standard beam search, we search for a sequence
Y that maximizes a score function s(Y, X) = log(P(Y|X)). Wu et al. (2016) introduce two additional regularization factors,coverage penalty and length penalty. These two penalties, with an additional refinement suggested in Gehrmann et al.(2018), yield the following score function:
4www.github.com/mataney/APES-optimizer
s(Y, X) = log(P(Y|X))/lp(Y)−cp(X;Y)
lp(Y) = (5 +|Y|)
α
(5 + 1)α
cp(X;Y) =β(−TX +
TX
X
i=1
max(
TY
X
j=1
ai,j,1.0))
(2) where α, β are hyper-parameters that control the length and coverage penalties respectively andai,j is the attention probability of thej-th target word on thei-th source word.
cp(X;Y), the coverage penalty, is designed to
discourage repeated attention to the same source word and favor summaries that cover more of the source document with respect to the attention dis-tribution.
lp(Y), the length normalization, is designed to compare between beam hypotheses of different length accurately. In general, beam search favors shorter outputs as log-probability is added at each step, yielding lower scores for longer sequences.
lpcompensates for this tendency.
In the following section, we describe how we extend this baseline model in order to maximize the APES metric. The new model learns to incor-porate more of the salient entities from the source document in order to optimize its APES metric.
5.2 Entities Attention Layer
As we observed, failure to capture salient entities in summaries is one cause for low APES score. To drive our model towards the identification and mention of salient entities from the source docu-ment, we introduce an additional attention layer that learns the important entities of a source docu-ment. We hypothesize that these entities are more likely to appear in the target summary, and thus are better candidate answers to one of the salient questions for this document.
We learn for each word in the source document its probability of belonging to a salient entity men-tion. We adopt the classical soft attention mech-anism ofBahdanau et al. (2014): after encoding the source document, we run an additional single alignment model with an empty query and a sig-moid layer instead of the standard softmax layer.
aej =σ(eej)
eej =vTtanh(U hj+b)
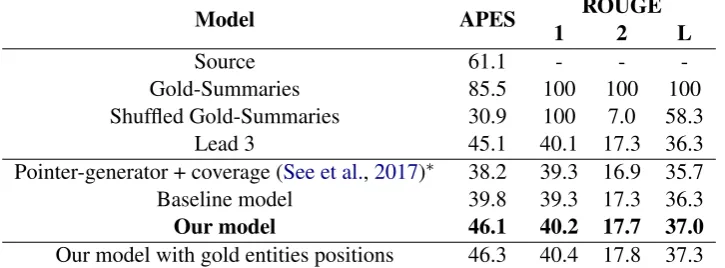
Model APES ROUGE
1 2 L
Source 61.1 - -
-Gold-Summaries 85.5 100 100 100
Shuffled Gold-Summaries 30.9 100 7.0 58.3
Lead 3 45.1 40.1 17.3 36.3
Pointer-generator + coverage (See et al.,2017)∗ 38.2 39.3 16.9 35.7
Baseline model 39.8 39.3 17.3 36.3
Our model 46.1 40.2 17.7 37.0
[image:7.595.119.482.66.200.2]Our model with gold entities positions 46.3 40.4 17.8 37.3
Table 4: APES: Percent of questions answered correctly using by document. *Obtained from the model uploaded togithub.com/abisee/pointer-generator.
whereU, b, vare learnable weight matrices,hj is the encoder hidden state for thej-th word andσ(·)
is a logistic sigmoid function.aejreflects the prob-ability of thej-th token of being a salient entity.
The second modification comparing to Bah-danau et al.(2014) is that we replace the softmax function with a sigmoid: while in the standard alignment model, we intend to obtain a normal-ized probability distribution over all the tokens of the source document, here we would like to get a probability of each token being a salient entity in-dependently of other tokens. In order to drive this attention layer towards salient entities, we define an additional term in the loss function.
losse=BCE(ae, s∗) (4)
wheres∗ is a binary vector of source length size, where s∗j = 1 if xj is a salient entity, and 0 otherwise, andBCE is the binary cross entropy function. This term is added to the standard log-likelihood loss, changing equation (1) to the fol-lowing composite loss function:
loss=δ losse+ (1−δ)
1 Ty
Ty
X
t=0
losst (5)
whereδ is a hyper-parameter. We join these two terms in the loss function in order to learn the enti-ties attention layer while keeping the summariza-tion ability learned by Eq. (1).
5.3 Entities Attention and Beam Search
After the attention layer has learned the probabil-ity of each source token to belong to a salient en-tity, we pass the predicted alignment to the beam search component at test-time. Using this align-ment data, we wish to encourage beam search to favor hypotheses attending salient entities.
Accordingly, we introduce a new termepto the beam search score function of equation (2):
s(Y, X) = log(P(Y|X))/lp(Y)−cp(X;Y)
−ep(X;Y)
ep(X;Y) =γ
TX
X
i=1
max(aei −
TY
X
j=1
ai,j,0.0)
(6)
ep(X;Y) penalizes summaries that do not
at-tend parts of the source document we believe are central.
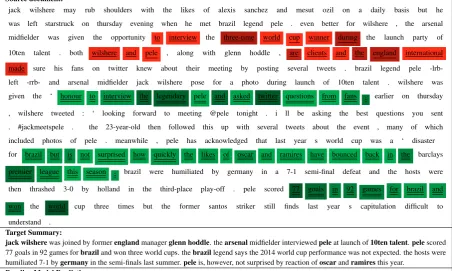
Fig. 4 compares summaries produced by this model and the baseline model by showing their respective attention distribution and the impact on the decision of which words to include in the sum-mary based on the attention level derived from salient entities.
6 Results
We report our results in Table 4. For each sys-tem, we present its APES score alongside its F1 scores for ROUGE-1, ROUGE-2 and ROUGE-L, computed using pyrouge5.
We first report APES results on full source doc-uments and gold summaries, in order to assess the capabilities of the QA system used for APES. A simple answer extractor could answer 100% of the questions given the gold-summaries. But the QA system is trained over the source documents and learns to generalize and not “just” extract the an-swer. Answering questions from the full docu-ments is indeed more difficult than from the gold-summaries because the QA system must locate the answer among multiple distractors. While gold-summaries present a very high APES score, the
Source document:
jack wilshere may rub shoulders with the likes of alexis sanchez and mesut ozil on a daily basis but he
was left starstruck on thursday evening when he met brazil legend pele . even better for wilshere , the arsenal
midfielder was given the opportunity to interview the three-time world cup winner during the launch party of
10ten talent . both wilshere and pele , along with glenn hoddle , are clients and the england international
made sure his fans on twitter knew about their meeting by posting several tweets . brazil legend pele
-lrb-left -rrb- and arsenal midfielder jack wilshere pose for a photo during launch of 10ten talent . wilshere was
given the ‘ honour to interview the legendary pele and asked twitter questions from fans . earlier on thursday
, wilshere tweeted : ‘ looking forward to meeting @pele tonight . i ll be asking the best questions you sent
. #jackmeetspele . the 23-year-old then followed this up with several tweets about the event , many of which
included photos of pele . meanwhile , pele has acknowledged that last year s world cup was a ‘ disaster
for brazil but is not surprised how quickly the likes of oscar and ramires have bounced back in the barclays
premier league this season . brazil were humiliated by germany in a 7-1 semi-final defeat and the hosts were
then thrashed 3-0 by holland in the third-place play-off . pele scored 77 goals in 92 games for brazil and
won the world cup three times but the former santos striker still finds last year s capitulation difficult to
understand .
Target Summary:
jack wilsherewas joined by formerenglandmanagerglenn hoddle. thearsenalmidfielder interviewedpeleat launch of10ten talent.pelescored 77 goals in 92 games forbraziland won three world cups. thebrazillegend says the 2014 world cup performance was not expected. the hosts were humiliated 7-1 bygermanyin the semi-finals last summer.peleis, however, not surprised by reaction ofoscarandramiresthis year.
Baseline Model Prediction:
jack wilshere was given the opportunity to interview the three-time world cup winner. both wilshere and pele are clients and the england international. pele has acknowledged that last year’s world cup was a ‘disaster’
Our Model Prediction:
[image:8.595.73.526.70.341.2]jack wilshere was given the ‘honour to interview the legendary pele’ and asked twitter questions from fans. pele has acknowledged that last year’s world cup was a ‘disaster’ for brazil but is not surprised how quickly the likes of oscar and ramires have bounced back in the premier league this season. the brazil legend scored 77 goals in 92 games for brazil and won the world cup three times.
Figure 4: Example 4134 from theCNN/Daily Mailtest set. Colors and underlines in the source reflect differences between baseline and our model attention weights: Red and a single underline reflects words attended by baseline model and not our model, Green and double underline reflects the opposite. Entities in bold in the target summary are answers to the example questions.
score reported for the source documents (61.1%) is a realistic upper bound for APES.
We then present shuffled gold-summaries, where we randomly shuffled the location of each unigram in the gold summary. This score shows that even when all salient entities are in the shuf-fled text, APES is sensitive to the loss of coher-ence, readability and meaning. This confirms that APES does not only match the presence of enti-ties. In contrast, ROUGE-1 fails to punish such incoherent sequences. Finally, we report ROUGE and APES for the strong Lead 3 sentences of the source document - a baseline known to beat most existing abstractive methods.
We then present APES and ROUGE scores for abstractive models,See et al.(2017)’s model, our baseline model and our APES-optimized model. Our model achieves significantly higher APES scores (46.1 vs. 39.8) and improves all ROUGE metrics (by about 1 F-point over the baselines).
The scores on the validation set are 46.6, 41.2, 18.4, 38.1 for APES, R1, R2, RL respectively.
While our objective is maximizing APES score, our model also increases its corresponding ROUGE scores. UnlikePaulus et al.(2017) where the authors suggested a Reinforcement Learning based model to optimize ROUGE specifically, we optimize for APES and gain better ROUGE score.
We finally report the results obtained by our model when gold salient entities positions are given as oracle inputs instead of the predictedae
scores. The corresponding score (46.3 vs. 46.1) is only slightly above the score obtained by our model. This indicates that the component of our model predicting entity saliency is good enough to drive summarization.
of 11,490 total) to the summaries with zero APES score (1,691). We measure the density of salient named entities in the source document: #(salient entity mentions)/#(distinct salient entities). This density in the case of perfect APES summaries is much higher than that for low APES summaries (4.9 vs. 3.6). This observation suggests that we fail to produce higher APES scores when the salient entities aren’t marked through sheer repeti-tion.
7 Conclusion
We introduced APES, a new automatic sum-marization evaluation metric for news articles datasets based on the ability of a summary to an-swer questions regarding salient information from the text. This approach is useful in domains with source documents of about 1k words that focus on named entities - such as news articles, where named entities are effectively aligned with Pyra-mid SCUs. In other non-news domains, and longer documents, other methods for generating ques-tions should be designed. We compare APES to manual evaluation metrics on the TAC 2011 AE-SOP task and confirm its value as a complement to ROUGE.
We introduce a new abstractive model that opti-mizes APES scores on theCNN/Daily Maildataset by attending salient entities from the input doc-ument, which also provides competitive ROUGE scores.
Acknowledgements
This research was supported by the Lynn and William Frankel Centre for Computer Science at Ben-Gurion University.
References
Dzmitry Bahdanau, Kyunghyun Cho, and Yoshua Ben-gio. 2014. Neural machine translation by jointly learning to align and translate. arXiv preprint arXiv:1409.0473.
Asli Celikyilmaz, Antoine Bosselut, Xiaodong He, and Yejin Choi. 2018. Deep communicating agents for abstractive summarization. arXiv preprint arXiv:1803.10357.
Danqi Chen, Jason Bolton, and Christopher D Man-ning. 2016. A thorough examination of the cnn/daily mail reading comprehension task. arXiv preprint arXiv:1606.02858.
Jianpeng Cheng and Mirella Lapata. 2016. Neural summarization by extracting sentences and words. arXiv preprint arXiv:1603.07252.
Hoa Trang Dang. 2005. Overview of duc 2005. In Pro-ceedings of the document understanding conference, volume 2005, pages 1–12.
John Duchi, Elad Hazan, and Yoram Singer. 2011. Adaptive subgradient methods for online learning and stochastic optimization. Journal of Machine Learning Research, 12(Jul):2121–2159.
Sebastian Gehrmann, Yuntian Deng, and Alexander M Rush. 2018. Bottom-up abstractive summarization. arXiv preprint arXiv:1808.10792.
David Graff, Junbo Kong, Ke Chen, and Kazuaki Maeda. 2003. English gigaword. Linguistic Data Consortium, Philadelphia, 4:1.
Karl Moritz Hermann, Tomas Kocisky, Edward Grefenstette, Lasse Espeholt, Will Kay, Mustafa Su-leyman, and Phil Blunsom. 2015. Teaching ma-chines to read and comprehend. InAdvances in Neu-ral Information Processing Systems, pages 1693– 1701.
Tsutomu Hirao, Hidetaka Kamigaito, and Masaaki Na-gata. 2018. Automatic pyramid evaluation exploit-ing edu-based extractive reference summaries. In EMNLP.
Stacy President Hobson, Bonnie J Dorr, Christof Monz, and Richard Schwartz. 2007. Task-based evalu-ation of text summarizevalu-ation using relevance pre-diction. Information Processing & Management, 43(6):1482–1499.
Matthew Honnibal and Mark Johnson. 2015. An im-proved non-monotonic transition system for depen-dency parsing. In Proceedings of the 2015 Con-ference on Empirical Methods in Natural Language Processing, pages 1373–1378, Lisbon, Portugal. As-sociation for Computational Linguistics.
Eduard Hovy, Chin-Yew Lin, Liang Zhou, and Junichi Fukumoto. 2006. Automated summarization eval-uation with basic elements. In Proceedings of the Fifth Conference on Language Resources and Eval-uation (LREC 2006), pages 604–611. Citeseer.
Hongyan Jing, Regina Barzilay, Kathleen McKeown, and Michael Elhadad. 1998. Summarization evalu-ation methods: Experiments and analysis. InAAAI symposium on intelligent summarization, pages 51– 59.
Guillaume Klein, Yoon Kim, Yuntian Deng, Jean Senellart, and Alexander M. Rush. 2017. Open-NMT: Open-source toolkit for neural machine trans-lation. InProc. ACL.
Annie Louis and Ani Nenkova. 2013. Automatically assessing machine summary content without a gold standard. Computational Linguistics, 39(2):267– 300.
Ramesh Nallapati, Feifei Zhai, and Bowen Zhou. 2017. Summarunner: A recurrent neural network based se-quence model for extractive summarization of docu-ments. hiP (yi= 1— hi, si, d), 1:1.
Ramesh Nallapati, Bowen Zhou, Caglar Gulcehre, Bing Xiang, et al. 2016. Abstractive text summa-rization using sequence-to-sequence rnns and be-yond.arXiv preprint arXiv:1602.06023.
Shashi Narayan, Shay B Cohen, and Mirella Lapata. 2018. Ranking sentences for extractive summariza-tion with reinforcement learning. arXiv preprint arXiv:1802.08636.
Ani Nenkova, Rebecca Passonneau, and Kathleen McKeown. 2007. The pyramid method: Incorpo-rating human content selection variation in summa-rization evaluation. ACM Transactions on Speech and Language Processing (TSLP), 4(2):4.
Karolina Owczarzak. 2009. Depeval(summ): Dependency-based evaluation for automatic summaries. InACL/IJCNLP.
Karolina Owczarzak and Hoa Trang Dang. 2011. Overview of the tac 2011 summarization track: Guided task and aesop task. In Proceedings of the Text Analysis Conference (TAC 2011), Gaithersburg, Maryland, USA, November.
Adam Paszke, Sam Gross, Soumith Chintala, Gre-gory Chanan, Edward Yang, Zachary DeVito, Zem-ing Lin, Alban Desmaison, Luca Antiga, and Adam Lerer. 2017. Automatic differentiation in pytorch. InNIPS-W.
Romain Paulus, Caiming Xiong, and Richard Socher. 2017. A deep reinforced model for abstractive sum-marization.arXiv preprint arXiv:1705.04304.
Alexander M Rush, Sumit Chopra, and Jason We-ston. 2015. A neural attention model for ab-stractive sentence summarization. arXiv preprint arXiv:1509.00685.
Evan Sandhaus. 2008. The new york times annotated corpus. Linguistic Data Consortium, Philadelphia, 6(12):e26752.
Abigail See, Peter J Liu, and Christopher D Man-ning. 2017. Get to the point: Summarization with pointer-generator networks. arXiv preprint arXiv:1704.04368.
Josef Steinberger and Karel Jeˇzek. 2012. Evaluation measures for text summarization. Computing and Informatics, 28(2):251–275.
Ilya Sutskever, Oriol Vinyals, and Quoc V Le. 2014. Sequence to sequence learning with neural net-works. InAdvances in neural information process-ing systems, pages 3104–3112.
Yi Tay, Minh C Phan, Luu Anh Tuan, and Siu Cheung Hui. 2017. Skipflow: Incorporating neural coher-ence features for end-to-end automatic text scoring. arXiv preprint arXiv:1711.04981.
Ravikiran Vadlapudi and Rahul Katragadda. 2010. On automated evaluation of readability of summaries: Capturing grammaticality, focus, structure and co-herence. InProceedings of the NAACL HLT 2010 student research workshop, pages 7–12. Association for Computational Linguistics.
Oriol Vinyals, Meire Fortunato, and Navdeep Jaitly. 2015. Pointer networks. InAdvances in Neural In-formation Processing Systems, pages 2692–2700.
Yonghui Wu, Mike Schuster, Zhifeng Chen, Quoc V Le, Mohammad Norouzi, Wolfgang Macherey, Maxim Krikun, Yuan Cao, Qin Gao, Klaus Macherey, et al. 2016. Google’s neural ma-chine translation system: Bridging the gap between human and machine translation. arXiv preprint arXiv:1609.08144.
Qian Yang, Rebecca J. Passonneau, and Gerard de Melo. 2016. Peak: Pyramid evaluation via au-tomated knowledge extraction. InAAAI.
A Experiment Settings
For our experiments, we used a bidirectional LSTM encoder with 256-dimensional hidden states for each direction, an LSTM decoder with 512-dimensional hidden states and 128-dimensional embeddings for a 50k shared-vocabulary words. We do not use pretrained word embeddings.
We use the Adagrad (Duchi et al., 2011) opti-mizer with a starting learning rate of0.15and gra-dient clipping with a maximum gragra-dient norm of 2. At train-time source and target documents are truncated to 400 and 100 tokens respectively. Af-ter training our baseline model for 20 epochs, we fine-tune the network with Eq. (5) loss for an ad-ditional 5 epochs starting again with 0.15 as initial learning rate. Results reported in this paper corre-spond toλ= 0.01.
also used Paulus et al.(2017) suggestion of rep-etition avoidance by blocking trigrams appearing more than once at inference time.