Original Article
Which IOL formula should be used to determine the
lens power estimation? A data analysis
based on 3258 eyes
Yang Zhao, Ziyang Wang, Shiqiang Zhao, Kaijie Wang, Siquan Zhu
Beijing Tongren Eye Center, Beijing Tongren Hospital, Capital Medical University, Beijing Ophthalmology and Visual Science Key Laboratory, Beijing, China
Received December 3, 2017; Accepted July 2, 2018; Epub August 15, 2018; Published August 30, 2018
Abstract: This study is a data-based retrospective analysis using 5 formulas: Holladay I, Hoffer Q, SRK/T, Holladay II and Haigis to compare the accuracy of IOL power estimation, the mean absolute errors between postoperative and predictive refractions were compared among five most commonly used IOL power formulas. For the eyes with AL equal to 29 mm or shorter than 21 mm, the effect of Haigis formula performed better than other formulas. For other eyes, Haigis formula seemed to have similar accuracy with other formulae. In China, we suggest that it is better to use Haigis formula to predict the IOL power before cataract surgery.
Keywords: Intraocular lens power, IOL formula, AL, ELP
Introduction
Being an age-related ophthalmological disease, cataract is the cause for more than 30% of world blindness [1]. One of the most successful treatments today is the cataract surgery, in which the natural lens will be replaced by a clear intraocular lens (IOL). To achieve opti- mum outcomes of treatment, the IOL power should be accurately calculated before cata-ract surgery.
In the last two decades, IOL formulas have been optimized from the 1st generation to 4th. Generations, in which the third and fourth gen-eration are theoretical formula based on geo-metrical optics and use the estimated lens position (ELP) to calculate the power of the IOL. The values of ELP are associated with axial length and corneal power.
The third-generation formulae estimate ELP in different way and had been reported to have “good balance” results of IOL power, in addition to those with high and extreme myopia [2, 3]. Until the fourth-generation formula came into being, it was the most commonly used formula, which included three lens constants and said
to be more humanized. However, there was no single formula could be proved to be suitable for all eyes [4].
The objective of this study was designed to evaluate the accuracy of third and fourth generation IOL power formula and to explore which formula is suitable for cataract pa- tients, especially for Chinese eyes, based on 3258 eyes of our outpatients in the past three years.
Patients and methods
right eye on the patient would be the only one included within the study.
All of recruited patients were operated on by one surgeon (Dr. SQ Zhu) using one technique (Phacoemulsification) and one intraocular lens style (AA4203). It is known that the different lens style has a different predictive error by the same IOL power [5]. The axial lengths (AL) of the lens would be measured by one ophthal-mologist with Zeiss IOL Master (version 4.02). Manual keratometry was obtained from all patients. All the other ocular biometry needed by IOL formulae (including horizontal white-to-white (WTW) corneal diameter, mean kerato-metric (K1 and K2) readings, anterior chamber depth (ACD) and axial length) were also mea-sured using Zeiss IOL Master. The predictive IOL powers were estimated by each IOL formu-lae (SRK/T, Hoffer Q, Holladay I, Holladay II and Haigis) with ULIB optimized constants. Based on measured AL by IOL Master, an optimized AL was recalculated in the present study according to ALopt = (ALIOL × 0.9571 + 1.3033) × 1.3549/1.3616 referred by Olsen [6].
The visual acuities were examined at the first and the third month by the same optometrist after surgery separately. The best corrected distance visual acuity was used to calculate the spherical equivalent refraction (IOL power). The absolute differences between predicted IOL power and postoperative IOL power are defined as the absolute error. The normality and homo-geneity was examined before statistical analy-sis and mean absolute error (MAE) or median absolute error (MedAE) would be used to evalu-ate the difference between Haigis’ formula and Holladay 2 using signed ranks test. The abso-lute errors were also analyzed between Haigis and the other formulas using analysis of vari-ance (ANOVA). When the density distribution of data is abnormal, Friedmann test would be used to check if there was significant
differ-as paired comparison with power of 80%. The significant level was set at 0.05. All the statisti-cal analysis was performed with SAS software (Version 9.3).
Results
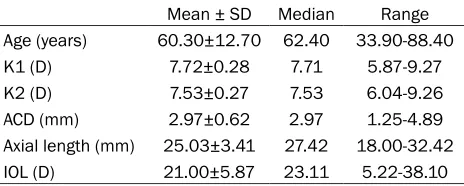
From Aug. 1, 2013 to Aug. 31, 2016, a total of 3258 eligible cataract patients (3258 eyes) aged from 33.9 to 88.4 years old were recruit-ed in the present study. The axial length varirecruit-ed from 18 mm to 32.42 mm and IOL power ranged from + 5.22D to + 38.1D. The mean horizontal (K1) and the vertical (K2) readings were 7.72±0.28 and 7.53±0.27 respectively (Table 1).
The distribution of eyes by various predicted errors for all formulas was shown in Table 2. Most of the eyes had MAEs value between-1 and 1, and no eye had an error of refraction more than 2D. As compared with 3rd generation formula, the 4th generation formula had less proportion (Holladay 2: 6.59%; Haigis: 4.18%) of MAE more than 1D and they had less propor-tion (Holladay 2: 6.04%; Haigis: 4.25%) of MAE less than -1D as well.
[image:2.612.91.323.85.178.2]The comparisons of MAEs between various for-mulas were stratified by axial length. For aver-age length eyes (23≤ axial length <27) no dif-ference was observed between Holladay 1, Hoffer Q, SRK/T and Haigis, which means, for those eyes with average axial length, the for-mula of Holladay 1, Hoffer Q, SRK/T and Haigis had the same accuracy to calculate the IOL power. By the abnormal axial length the MAE of Haigis is 0.58±0.28D, 0.50±0.23D, 0.55± 0.24D and 0.59±0.25D for group of axial length shorter than 21 mm, 21 to <23 mm, 29 to <31 mm and longer than 31 mm respectively and they were less than those of other third ge- neration formulas. The difference was statisti-cal significant with P value lower than 0.05.
Table 1. Ocular biometry of 3258 patients
Mean ± SD Median Range
Age (years) 60.30±12.70 62.40 33.90-88.40
K1 (D) 7.72±0.28 7.71 5.87-9.27
K2 (D) 7.53±0.27 7.53 6.04-9.26
ACD (mm) 2.97±0.62 2.97 1.25-4.89
Axial length (mm) 25.03±3.41 27.42 18.00-32.42
IOL (D) 21.00±5.87 23.11 5.22-38.10
ence between them. Since the present study was a retrospective analysis based on available data, IRB’s approval was not required [7].
However, there was no difference between those formulas for MAEs by group of 27 to <29 mm axial length (P = 0.071). For all eyes with-out stratification by AL, there was no significant difference of MAEs between Haigis and other formulas (P = 0.057) as well (Table 3).
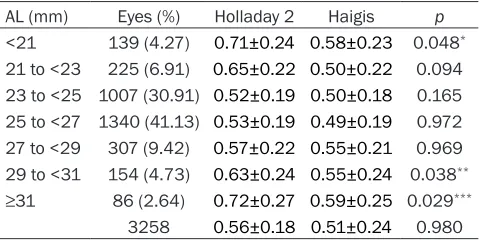
The MAE comparison between Holladay 2 and Haigis was shown in Table 4. Generally, no sig-nificant difference of MAEs between Holladay 2 (MAE: 0.56±0.18D) and Haigis (0.51±0.24D) was observed (P = 0.980). By the shorter (<21 mm) or extreme longer (≥29 mm) eyes, the dif-ference of MAEs between them was statistical-ly significant and showed that Haigis was more accurate than Holladay 2 on these eyes.
Haigis formula showed a lower MAE on average axial length eyes, no statistically significant was observed in the present study.
Although the accuracy of IOL power calculation is related to lens style [5] and measuring equipment [8, 9], lots of studies, that used dif-ferent lens style and even various equipment, had reported that most of formulas performed same effect and no statistically significant dif-ference seemed to be found among their esti-mation on the normal or medium or average AL eyes [10-12].
[image:3.612.89.524.84.165.2]There is no consistent conclusion about the prediction error of long eyes (AL more than 29
Table 2. Percent (%) of eyes by predicted error (D) by various formulas
MAE MedAE -2~-1 -1~-0.5 -0.5~0 0~0.5 0.5~1 1~2
SRK/T 0.66±0.30 0.71 10.75 16.67 23.02 20.07 18.97 10.52
Hoffer Q 0.63±0.29 0.59 8.25 16.41 23.30 23.36 17.15 11.53
Holladay 1 0.63±0.30 0.56 9.16 16.59 22.88 24.30 15.98 11.08
Holladay 2 0.56±0.23 0.46 6.04 18.06 25.58 27.89 15.84 6.59
[image:3.612.89.528.199.318.2]Haigis 0.51±0.24 0.40 4.25 17.44 27.11 28.56 18.46 4.18
Table 3. Mean absolute errors (MAEs) for all eyes by various formula
AL (mm) Eyes (%) SRK/T Hoffer Q Holladay 1 Haigis p
<21 139 (4.27) 0.82±0.40 0.84±0.38 0.81±0.37 0.58±0.28 <0.001*
21 to <23 225 (6.91) 0.79±0.37 0.82±0.38 0.81±0.37 0.50±0.23 0.045
23 to <25 1007 (30.91) 0.56±0.25 0.57±0.26 0.63±0.29 0.50±0.23 0.072
25 to <27 1340 (41.13) 0.62±0.30 0.61±0.27 0.64±0.29 0.49±0.21 0.134
27 to <29 307 (9.42) 0.59±0.28 0.60±0.27 0.64±0.29 0.55±0.26 0.071
29 to <31 154 (4.73) 0.74±0.35 0.77±0.35 0.66±0.30 0.55±0.24 0.047**
≥31 86 (2.64) 0.85±0.40 0.87±0.39 0.69±0.30 0.59±0.25 0.033***
3258 0.63±0.30 0.64±0.29 0.66±0.30 0.51±0.24 0.057
*p value of Friedmann test; **p value of Friedmann test; ***p value of Friedmann test.
Table 4. Mean absolute errors (MAEs) for all eyes by Holladay 2 and Haigis
AL (mm) Eyes (%) Holladay 2 Haigis p
<21 139 (4.27) 0.71±0.24 0.58±0.23 0.048*
21 to <23 225 (6.91) 0.65±0.22 0.50±0.22 0.094 23 to <25 1007 (30.91) 0.52±0.19 0.50±0.18 0.165 25 to <27 1340 (41.13) 0.53±0.19 0.49±0.19 0.972 27 to <29 307 (9.42) 0.57±0.22 0.55±0.21 0.969 29 to <31 154 (4.73) 0.63±0.24 0.55±0.24 0.038**
≥31 86 (2.64) 0.72±0.27 0.59±0.25 0.029***
3258 0.56±0.18 0.51±0.24 0.980
*p value of Friedmann test; **p value of Friedmann test; ***p value of
Friedmann test.
In most cases, the MAEs across all for-mulas were similar for eyes with axial length ranged from 21 to 29 mm. In the present study, based on 11.62% of the eyes (shorter or extreme longer) that Haigis formula was found to be more accurate than the other formulas.
Discussion
[image:3.612.90.330.377.497.2]mm). Our results have showed that optimized Haigis formula performed better than others. Although Aristodemou et al. suggested another formula performed better in their study based on 8018 eyes, we firmly believed the present study achieved the best results according to our study design.
Unlike other studies, the subgroups in the pres-ent study had not been classified according to Hoffer’s reference, because of potential differ-ence of average AL between European and Chinese eyes [13-14]. The subgroups of eyes were divided every 2 millimeters of AL into one group. Another advantage of this study was the consistency of biometric data collection, which has been collected by one optometrist using one equipment (IOL Master), operated by one surgeon using one intraocular lens type (AA4203) and one technique (Phacoemulsifi- cation). Furthermore, the study did not include two genetically identical eyes. We are not sure of the exact effect of two genetically identical eyes in the analysis, but it is possible that two genetically identical eyes in data could strongly enlarge or decrease the working effect of for-mulas. In another study, in which there was only one eye per patient, Cook et al. reported a consistent result that Haigis performed bet-ter than Holladay 1 and 2, SRK/T and Hoffer Q on long AL eyes with more than 1000 eyes [12]. Besides, Cook et al. Also showed that Haigis performed better than Holladay 1 and 2, SRK/T and Hoffer Q on short eyes [11].
The association between myopia and shorter AL is difficult to be explained [15, 16], most of the formulas has more predicted error than they did for normal AL eyes. The ELP, which can-not be measured before operation, becomes the key error source after using PCI technology by IOL Master [17]. The reason that Haigis for-mula had good results seemed to be associat-ed with its three constants, particularly a2, which could be optimized by data collected from the operation before [12].
One of the possible limitations in this study is that the IOL power estimation of Holladay 2 formula is not used lens thickness (LT) because it is unable to be measured by the IOL master. To avoid measurement error between two devices, only IOL Master was used. Moreover, the results for Holladay 2 with or without LT was reported to be no statistically significant
differ-ence [18], and that seemed to be little problem for our results. Our surgical and refractive tech-niques may lead to some bias, though this is very unlikely.
In this study, the absolute predicted error was used to be compared among formulas. But whether the predictive value was more or less than postoperative refraction, whether the positive or negative difference is consistent within formulas and whether there is some relationship between hyperopic and the posi-tive or negaposi-tive difference, were not further and deeply discussed.
In conclusion, our preliminary results suggest that the Haigis formula have more satisfied estimation of IOL power than others among Chinese and then should be used on cataract surgery in the clinic as the first option in China. Even if Haigis Formula is not available, the other formula like Holladay 1&2, Hoffer Q and SRK/T can also get acceptable results on medi-um eyes.
Disclosure of conflict of interest
None.
Address correspondence to: Siquan Zhu, Beijing Tongren Eye Center, Beijing Tongren Hospital, Capi- tal Medical University, Beijing Ophthalmology and Visual Science Key Laboratory, 1 Dong Jiao Min Xiang, Beijing Dongcheng District, Beijing 100730, China. Tel: 13911293003; E-mail: zhusiquan2017@ sina.com
References
[1] Ma X, Jiao X, Ma Z, Hejtmancik JF. Polymor-phism rs7278468 is associated with age-relat-ed cataract through decreasing transcriptional activity of the CRYAA promoter. Sci Rep 2016; 6: 23206.
[2] Wang JK, Hu CY, Chang SW. Intraocular lens power calculation using the IOLMaster and various formulas in eyes with long axial length. J Cataract Refract Surg 2008; 34: 262-7. [3] El-Nafees R, Moawad A, Kishk H, Gaafar W.
In-tra-ocular lens power calculation in patients with high axial myopia before cataract surgery. Saudi J Ophthalmol 2010; 24: 77-80.
[4] Sahin A, Hamrah P. Clinically relevant biome-try. Curr Opin Ophthalmol 2012; 23: 47-53. [5] Narváez J, Zimmerman G, Stulting RD, Chang
and SRK/T formulas. J Cataract Refract Surg 2006; 32: 2050-2053.
[6] Olsen T. Intraocular lens power calculation er-rors in long eyes. J Cataract Refract Surg 2012; 38: 733.
[7] Office for Human Research Protections (Janu-ary 15, 2009). (2014) “Code of Federal Regu-lations”. hhs.gov. p. US 45 CFR 46.101. [8] Reitblat O, Assia EI, Kleinmann G, Levy A,
Bar-rett GD, Abulafia A. Accuracy of predicted re-fraction with multifocal intraocular lenses us-ing two biometry measurement devices and multiple intraocular lens power calculation formulas. Clin Exp Ophthalmol 2015; 43: 328-334.
[9] Buckhurst PJ, Wolffsohn JS, Shah S, Naroo SA, Davies LN, Berrow EJ. A new optical low coher-ence reflectometry device for ocular biometry in cataract patients. Br J Ophthalmol 2009; 93: 949-53.
[10] Sanders DR, Retzlaff JA, Kraff MC, Gimbel HV, Raanan MG. Comparison of the SRK/T la and other theoretical and regression formu-las. J Cataract Refract Surg 1990; 16: 341-6. [11] Aristodemou P, Knox Cartwright NE, Sparrow
JM, Johnston RL. Formula choice: Hoffer Q, Holladay 1, or SRK/T and refractive outcomes in 8108 eyes after cataract surgery with biom-etry by partial coherence interferombiom-etry. J Cataract Refract Surg 2011; 37: 63-71.
[12] Cooke DL. Cooke TL. Comparison of 9 intraocu-lar lens power calculation formulas. J Cataract Refract Surg 2016; 42: 1157-1164.
[13] Hoffer KJ. Clinical results using the Holladay 2 intraocular lens power formula. J Cataract Re-fract Surg 2000; 26: 1233-1237.
[14] Chen F, Sheng YH, Li ZQ. Comparison of SRK-II und the third generation IOL formula. Chinese Journal of Practical Ophthalmology 2000; 18: 3.
[15] Mallen EA, Gammoh Y, Al-Bdour M, Sayegh FN. Refractive error and ocular biometry in Jorda-nian adults. Ophthalmic Physiol Opt 2005; 25: 302-309.
[16] Chen MJ, Liu YT, Tsai CC, Chen YC, Chou CK, Lee SM. Relationship between central corneal thickness, refractive error, corneal curvature, anterior chamber depth and axial length. J Chin Med Assoc 2009; 72: 133-137.
[17] Olsen T. Sources of error in intraocular lens power calculation. J Cataract Refract Surg 1992; 18: 125-129.