Image Description using Visual Dependency Representations
Desmond Elliott School of Informatics University of Edinburgh
Frank Keller School of Informatics University of Edinburgh
Abstract
Describing the main event of an image in-volves identifying the objects depicted and predicting the relationships between them. Previous approaches have represented images as unstructured bags of regions, which makes it difficult to accurately predict meaningful
relationships between regions. In this
pa-per, we introduce visual dependency represen-tations to capture the relationships between the objects in an image, and hypothesize that this representation can improve image
de-scription. We test this hypothesis using a
new data set of region-annotated images, as-sociated with visual dependency representa-tions and gold-standard descriprepresenta-tions. We de-scribe two template-based description gener-ation models that operate over visual depen-dency representations. In an image descrip-tion task, we find that these models outper-form approaches that rely on object proxim-ity or corpus information to generate descrip-tions on both automatic measures and on hu-man judgements.
1 Introduction
Humans are readily able to produce a description of an image that correctly identifies the objects and ac-tions depicted. Automating this process is useful for applications such as image retrieval, where users can go beyond keyword-search to describe their infor-mation needs, caption generation for improving the accessibility of existing image collections, story il-lustration, and in assistive technology for blind and
partially sighted people. Automatic image descrip-tion presents challenges on a number of levels: rec-ognizing the objects in an image and their attributes are difficult computer vision problems; while deter-mining how the objects interact, which relationships hold between them, and which events are depicted requires considerable background knowledge.
Previous approaches to automatic description generation have typically tackled the problem us-ing an object recognition system in conjunction with a natural language generation component based on language models or templates (Kulkarni et al., 2011; Li et al., 2011). Some approaches have utilised the visual attributes of objects (Farhadi et al., 2010), generated descriptions by retrieving the descriptions of similar images (Ordonez et al., 2011; Kuznetsova et al., 2012), relied on an external corpus to pre-dict the relationships between objects (Yang et al., 2011), or combined sentence fragments using a tree-substitution grammar (Mitchell et al., 2012).
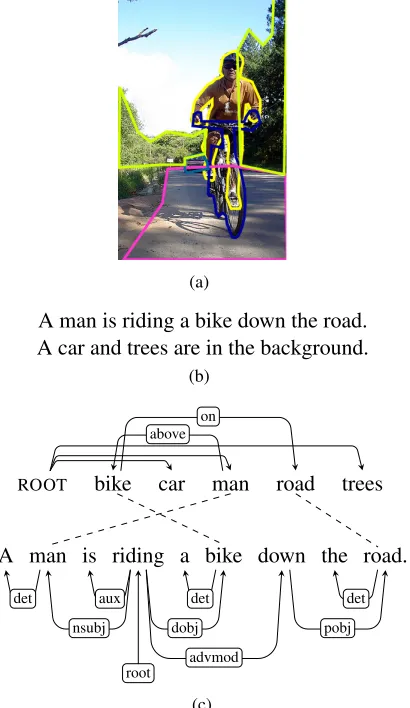
A common aspect of existing work is that an im-age is represented as a bag of imim-age regions. Bags of regions encode which objects co-occur in an im-age, but they are unable to express how the regions relate to each other, which makes it hard to describe what is happening. As an example, consider Fig-ure 1a, which depicts a man riding a bike. If the man was instead repairing the bike, then the bag-of-regions representation would be the same, even though the image would depict a different action and would have to be described differently. This type of co-occurrence of regions indicates the need for a more structured image representation; an image de-scription system that has access to structured
(a)
A man is riding a bike down the road. A car and trees are in the background.
(b)
ROOT bike car man road trees
-
-on above
A man is riding a bike down the road.
det
nsubj aux
root det
dobj
advmod
det
pobj
(c)
Figure 1: (a) Image with regions marked up: BIKE,CAR,
MAN, ROAD, TREES; (b) human-generated image
de-scription; (c) visual dependency representation
express-ing the relationships between MAN, BIKE, and ROAD
aligned to the syntactic dependency parse of the first sen-tence in the human-generated description (b).
sentations would be able to correctly infer the action that is taking place, such as the distinction between repairing or riding a bike, which would greatly im-prove the descriptions it is able to generate.
In this paper, we introducevisual dependency rep-resentations(VDRs) to represent the structure of im-ages. This representation encodes the geometric re-lations between the regions of an image. An ex-ample can be found in Figure 1c, which depicts the VDR for Figure 1a. It encodes that theMANis above theBIKE, and that theBIKEis on theROAD. These relationships make it possible to infer that the man is riding a bike down the road, which corresponds
to the first sentence of the human-generated image description in Figure 1b.
In order to test the hypothesis that structured im-age representations are useful for description gener-ation, we present a series of template-based image description models. Two of these models are based on approaches in the literature that represent images as bags of regions. The other two models use vi-sual dependency representations, either on their own or in conjunction with gold-standard image descrip-tions at training time.
We find that descriptions generated using the VDR-based models are significantly better than those generated using bag-of-region models in au-tomatic evaluations using smoothed BLEU scores and in human judgements. The BLEU score im-provements are found at bi-, tri-, and four-gram lev-els, and humans rate VDR-based image descriptions 1.2 points above the next-best model on a 1–5 scale.
Finally, we also show that the benefit of the vi-sual dependency representation is maintained when image descriptions are generated from automatically parsed VDRs. We use a modified version of the edge-factored parser of McDonald et al. (2005) to predict VDRs over a set of annotated object regions. This result reaffirms the potential utility of this rep-resentation as a means to describe events in images. Note that throughout the paper, we work with gold-standard region annotations; this makes it possible to explore the effect of structured image representa-tions independently of automatic object detection.
2 Visual Dependency Representation
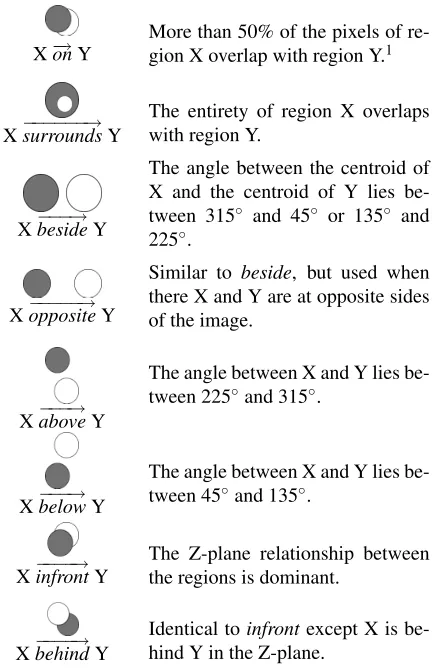
In analogy to dependency grammar for natural lan-guage syntax, we defineVisual Dependency Gram-mar to describe the spatial relations between pairs of image regions. A directed arc between two re-gions is labelled with the spatial relationship be-tween those regions, defined in terms of three ge-ometric properties: pixel overlap, the angle between regions, and the distance between regions. Table 1 presents a detailed explanation of the spatial rela-tionships defined in the grammar.
[image:2.612.84.289.73.427.2]X−→onY
More than 50% of the pixels of
re-gion X overlap with rere-gion Y.1
X−−−−−−→surroundsY
The entirety of region X overlaps with region Y.
X−−−→besideY
The angle between the centroid of X and the centroid of Y lies
be-tween 315◦ and 45◦ or 135◦ and
225◦.
X−−−−−→oppositeY
Similar to beside, but used when
there X and Y are at opposite sides of the image.
X−−−→aboveY
The angle between X and Y lies
be-tween 225◦and 315◦.
X−−−→belowY
The angle between X and Y lies
be-tween 45◦and 135◦.
X−infront−−−→Y
The Z-plane relationship between the regions is dominant.
X−−−−→behindY
Identical toinfrontexcept X is
[image:3.612.78.300.58.392.2]be-hind Y in the Z-plane.
Table 1: Visual Dependency Grammar defines eight re-lations between pairs of annotated regions. To simplify
explanation, all regions are circles, whereX is the grey
region andYis the white region. All relations are
consid-ered with respect to the centroid of a region and the angle between those centroids. We follow the definition of the
unit circle, in which 0◦lies to the right and a turn around
the circle is counter-clockwise.
over the set of regions in an image using the spa-tial relationships in the Visual Dependency Gram-mar. It is created from a region-annotated image and a corresponding image description by first identify-ing the central actor of the image. The central actor is the person or object carrying out the depicted ac-tion; this typically corresponds to the subject of the sentence describing the image. The region corre-sponding to the central actor is attached to theROOT node of the graph. The remaining regions are then attached based on their relationship with either the actor or the other regions in the image as they are
1As per thePASCAL VOCdefinition of overlap in the object
detection task (Everingham et al., 2011).
mentioned in the description. Each arc introduced is labelled with one of the spatial relations defined in the grammar, or with no label if the region is not described in relation to anything else in the image.
As an example of the output of this annotation process, consider Figure 1a, its description in 1b, and its VDR in 1c. Here, the MAN is the central actor in the image, as he is carrying out the depicted action (riding a bike). The region corresponding to MAN is therefore attached to ROOT without a spa-tial relation. TheBIKEregion is then attached to the MANregion using the−−−→aboverelation andBIKEis at-tached to theROADwith the−→onrelation. In the sec-ond sentence of the description,CARandTREESare mentioned without a relationship to anything else in the image, so they are attached to theROOTnode. If these regions were attached to other regions, such as CAR−−−→aboveROADthen this would imply structure in the image that is not conveyed in the description.
2.1 Data
Our data set uses the images from the PASCAL Visual Object Classification Challenge 2011 action recognition taster competition (Everingham et al., 2011). This is a closed-domain data set containing images of people performing ten types of actions, such as making a phone call, riding a bike, and tak-ing a photo. We annotated the data set in a three-step process: (1) collect a description for each image; (2) annotate the regions in the image; and (3) create a visual dependency representation of the image. Note that Steps (2) and (3) are dependent on the image de-scription, as both the region labels and the relations between them are derived from the description.
2.2 Image Descriptions
We collected three descriptions of each image in our data set from Amazon Mechanical Turk. Workers were asked to describe an image in two sentences. The first sentence describes the action in the image, the person performing the action and the region in-volved in the action; the second sentence describes any other regions in the image not directly involved in the action. An example description is given in Figure 1b.
de-man
w
oman
person people trees horse
gir
l
w
all
bo
y
computer
child book phone chair windo
w
gr
ass
camer
a
bicycle
bik
e
laptop
Frequency
[image:4.612.75.297.90.228.2]0 100 200 300 400 500
Figure 2: Top 20 annotated regions.
scriptions. The workers, drawn from those regis-tered in the US with a minimum HIT acceptance rate of 95%, described an average of 145±93 images; they were encouraged to describe fewer than 300 im-ages each to ensure a linguistically diverse data set. They were paid $0.04 per image and it took on av-erage 67±123 seconds to describe a single image. The average length of a description was 19.9±6.5 words in a range of 8–50 words. Dependency parses of the descriptions were produced using the MST-Parser (McDonald et al., 2005) trained on sections 2-21 of the WSJ portion of the Penn Treebank.
2.3 Region Annotations
We trained two annotators to draw polygons around the outlines of the regions in an image using the La-belMe annotation tool (Russell et al., 2008). The regions annotated for a given image were limited to those mentioned in the description paired with the image. Region annotation was performed on a sub-set of 341 images and resulted in a total of 5,034 annotated regions with a mean of 4.19± 1.94 an-notations per image. A total of 496 distinct labels were used to label regions. Figure 2 shows the distribution of the top 20 region annotations in the data; people-type regions are the most commonly annotated regions. Given the prevalence of labels referring to the same types of regions, we defined 26 sets of equivalent labels to reduce label sparsity (e.g.,BIKEwas considered equivalent toBICYCLE). This normalization process reduced the size of the region label vocabulary from 496 labels to 362
la-none
infront beside abo
v
e
on
surrounds
behind belo
w
opposite
Frequency
[image:4.612.319.543.92.230.2]0 500 1000 1500 2000 2500
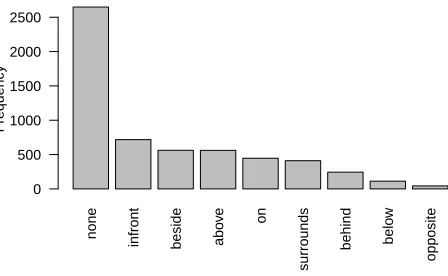
Figure 3: Distribution of the spatial relations.
bels. Inter-annotator agreement was 74.3% for re-gion annotations, this was measured by computing polygon overlap over the annotated regions.
2.4 Visual Dependency Representations
The same two annotators were trained to construct gold-standard visual dependency representations for annotated image–description pairs. The process for creating a visual dependency representation of an image is described earlier in this section of the pa-per. The 341 region-annotated images resulted in a set of 1,023 visual dependency representations. The annotated data set comprised a total of 5,748 spatial relations, corresponding to a mean of 4.79 ±3.51 relations per image. Figure 3 shows the distribution of spatial relation labels in the data set. It can be seen that the majority of regions are attached to the ROOT node, i.e., they have the relation label none. Inter-annotator agreement on a subset of the data was measured at 84% agreement for labelled de-pendency accuracy and 95.1% for unlabelled depen-dency accuracy. This suggests the task of generating visual dependency representations can be performed reliably by human annotators. We induced an align-ment between the annotated region labels and words in the image description using simple lexical match-ing augmented with WordNet hyponym lookup. See Figure 1c for an example of the alignments.
3 Image Description Models
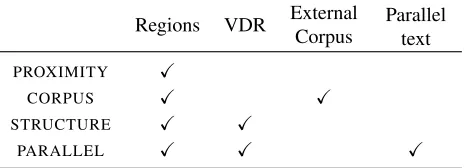
Regions VDR External Corpus
Parallel text
PROXIMITY X
CORPUS X X
STRUCTURE X X
PARALLEL X X X
Table 2: The data available to each model at training time.
presents an overview of the amount of information available to each model at training time, ranging from only the annotated regions of an image to us-ing visual dependency representation of an image aligned with the syntactic dependency representa-tion of its descriprepresenta-tion. At test time, all models have access to image regions and their labels, and use these to generate image descriptions. Two of the models also have access to VDRs at test time, al-lowing us to test the hypothesis that image structure is useful for generating good image descriptions.
The aim of each model is to determine what is happening in the image, which regions are impor-tant for describing it, and how these regions relate to each other. Recall that all our images depict actions, and that the gold-standard annotation was performed with this in mind. A good description therefore is one that relates the main actors depicted in the im-age to each other, typically through a verb; a mere enumeration of the regions in the image is not suffi-cient. All models attempt to generate a two-sentence description, as per the gold standard descriptions.
In the remainder of this section, we will use Fig-ure 1 as a running example to demonstrate the type of language each model is capable of generating. All models share the set of templates in Table 3.
3.1 PROXIMITY
PROXIMITY is based on the assumption that people describe the relationships between regions that are near each other. It has access to only the annotated image regions and their labels.
Region–region relationships that are potentially relevant for the description are extracted by calculat-ing the proximity of the annotated regions. Here, oi is the subject region, oj is the object region, and si j is the spatial relationship between the regions. Let
T1 DTOiAUX REL DTOj.T5?
T2 ThereAUXalso{DTOi}
|unrelated|
i=1 in the image.
T3 DTOiAUX REL DTOjREL DTOk.T5?
T4 REL DTOj.
T5 PRP AUX{REL DTOi}
|dependents|
[image:5.612.73.310.62.146.2]i=1 .
Table 3: The language generation templates.
R={(oi, si j, oj), . . .}be the set of possible region– region relationships found by calculating the near-est neighbour of each region in Euclidean space be-tween the centroids of the polygons that mark the re-gion boundaries. The tuple with the subject closest to the centre of the image is used to describe what is happening in the image, and the remaining regions are used to describe the background.
The first sentence of the description is realised with template T1 from Table 3. oi is the label of
the subject region and oj is the label of the object region.DTis a simple determiner chosen from{the, a}, depending on whether the region label is a plural noun;AUXis either{is, are}, depending on the num-ber of the region label; andRELis a word to describe the relationship between the regions. For this model, RELis the spatial relationship between the centroids chosen from{above, below, beside}, depending on the angle formed between the region centroids, us-ing the definitions in Table 1. The second sentence of the description is realised with template T2 over
the subjects oi in R that were not used in the first sentence. An example of the language generated is:
(1) The man is beside the bike. There is also a road, a car, and trees in the image.
With the exception of visual attributes to describe size, colour, or texture, this model is based on the approach described by Kulkarni et al. (2011).
3.2 CORPUS
external text corpus to determine which pairs of re-gions are likely to be in a describable relationship. Furthermore,CORPUScan generate verbs instead of spatial relations between regions, leading to more human-like descriptions. CORPUSis based on Yang et al. (2011), except we do not use scene type (in-door, out(in-door, etc.) as part of the model. At training time, the model has access to the annotated image regions and labels, and to the dependency-parsed version of the English Gigaword Corpus (Napoles et al., 2012). The corpus is used to extract subject– verb–object subtrees, which are then used to predict the best pairs of regions, as well as the verb that re-lates the regions.
The set of region–region relationships R={(oi, vi j, oj), . . .} is determined by search-ing for the most likely o∗j,v∗ given an oi over a set of verbs
V
extracted from the corpus and the other regions in the image. This is shown in Equation 1.o∗j,v∗|oi=arg max
oj,v
p(oi)·p(v|oi)·p(oj|v,oi) (1)
We can easily estimatep(oi),p(v|oi), andp(oj|v,oi) directly from the corpus. If we cannot find an o∗j,v∗ for a region, we back-off to the spatial relationship calculation as defined in PROXIMITY. When we have found the best pairs of regions, we select the most probable pair and generate the first sentence of the description using that pair an template T1. The second sentence is realised with templateT2over the
subjects in R not used in generating the first sen-tence. An example of the language generated is:
(2) The man is riding the bike. There is also a car, a road, and trees in the image.
In comparison toPROXIMITY, this model will only describe pairs of regions that have observed rela-tions in the external corpus. The corpus also vides a verb that relates the regions, which pro-duces descriptions that are more in line with human-generated text. However, since noun co-occurrence in the corpus controls which regions can be men-tioned in the description, this model will be prone to relating regions simply because their labels occur together frequently in the corpus.
3.3 STRUCTURE
The model STRUCTURE exploits the visual depen-dency representation of an image to generate lan-guage for only the relationships that hold between pairs of regions. It has access to the image regions, the region labels, and the visual dependency repre-sentation of an image.
Region–region relationships are generated during a depth-first traversal of the VDR using templates T1,T3,T4, andT5. The VDR of an image is traversed and language fragments are generated and then com-bined depending on the number of children of a node in the tree. If a node has only one child then we use T1 to generate text for the head-child
relation-ship. If a node has more than one child, we need to decide how to order the language generated by the model. We generate sentence fragments usingT4for
each child independently and combine them later. In STRUCTURE, the sentence fragments are sorted by the Euclidean distance of the children from the par-ent. In order to avoid problematic descriptions such as“The woman is above the horse is above the field is beside the house”, we include a special case for when a node has more than one child. In these cases, the nearest region is realized in direct relation to the head using eitherT3(two children) orT1(more than
two children), and the remaining regions form a sep-arate sentence using T5. This sorting and combing
process would result in “The woman is above the horse. She is above field and beside the house”for the case mentioned above.
An example of the type of description that can be generated during a traversal is:
(3) The man is above the bike above the road. There is also a car and trees in the image.
In comparison toPROXIMITY, this model can exploit a representation of an image that encodes the rela-tionships between regions in an image (the VDR). However, it is limited to generating spatial relations, because it cannot predict verbs to relate regions.
3.4 PARALLEL
predict verbs that relate regions in parent-child re-lationships in a VDR. At training time it has ac-cess to the annotated regions and labels, the visual dependency representations, and the gold-standard image descriptions. Recall from Section 2.1 that the descriptions were dependency-parsed using the parser of McDonald et al. (2005) and alignments were calculated between the nodes in the VDRs and the words in the parsed image descriptions.
We estimate two distributions from the image descriptions using the align-ments: p(verb|ohead,ochild,relhead−child) and p(verb|ohead,ochild). The second distribution is used as a backoff when we do not observe the arc label between the regions in the training data. The gener-ation process is similar to that used inSTRUCTURE, with two exceptions: (1) it can generate verbs during the generation steps, and (2) when a node has multiple dependents, the sentence fragments are sorted by the probability of the verb associated with them. This sorting step governs which child is in a relationship with its parent. When the model generates text, it only generates a verb for the most probable sentence fragment. The remaining fragments revert back to spatial relationships to avoid generating language that places the subject region in multiple relationships with other regions. An example of the language generated is:
(4) The man is riding the bike on the road. There is also a car and trees in the image.
In comparison toCORPUS, this model generates de-scriptions in which the relations between the regions determined by the image itself and not by an external corpus. In comparison toPROXIMITY and STRUC -TURE, this model generates descriptions that express meaningful relations between the regions and not simple spatial relationships.
4 Image Parsing
TheSTRUCTUREandPARALLELmodels rely on vi-sual dependency representations, but it is unreal-istic to assume gold-standard representations will always be available because they are expensive to construct. In this section we describe an image parser that can induce VDRs automatically from
region-annotated images, providing the input for the STRUCTURE-PARSED and PARALLEL-PARSED models at test time.
The parser is based on the arc-factored depen-dency parsing model of McDonald et al. (2005). This model generates a dependency representation by maximizing the scorescomputed over all edges of the representation. In our notation,xvisis the set of annotated regions andyvis is a visual dependency representation of the image; (i,j) is a directed arc from nodeito node jinxvis,f(i,j)is a feature rep-resentation of the arc(i,j), andwis a vector of fea-ture weights to be learned by the model. The overall score of a visual dependency representation is:
s(xvis,yvis) =
∑
(i,j)∈yvis
w·f(i,j) (2)
The features in the model are defined over re-gion labels in the visual dependency representation as well as the relationship labels. As our depen-dency representations are unordered, none of the features encode the linear order of region labels, unlike the feature set of the original model. Uni-gram features describe how likely individual region labels are to appear as either heads or arguments and bigram feature captures which region labels are in head-argument relationships. All features are con-joined with the relationship label.
We evaluate our parser on the 1,023 visual depen-dency representations from the data set. The evalu-ation is run over 10 random splits into 80% train-ing, 10% development, and 10% test data.2 Per-formance is measured with labelled and unlabelled directed dependency accuracy. The parser achieves 58.2%±3.1 labelled accuracy and 65.5%±3.3 un-labelled accuracy, significantly better than the base-line of 51.6%±2.5 for both labelled and unlabelled accuracy (the baseline was calculated by attaching all image regions to the root node; this is the most frequent form of attachment in our data).
5 Language Generation Experiments
We evaluate the image description models in an au-tomatic setting and with human judgements. In
2Different visual dependency representations of the same
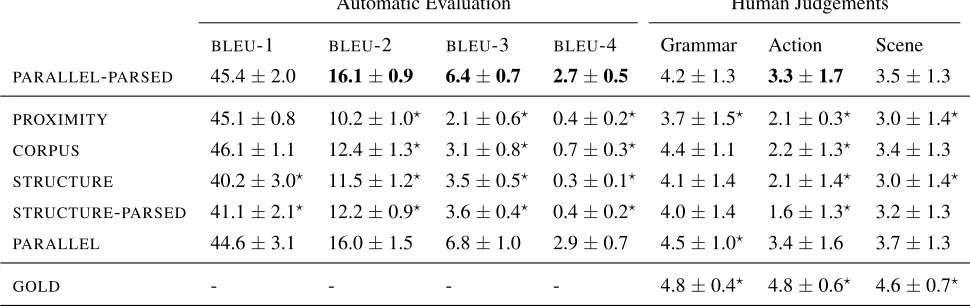
Automatic Evaluation Human Judgements
BLEU-1 BLEU-2 BLEU-3 BLEU-4 Grammar Action Scene
PARALLEL-PARSED 45.4±2.0 16.1±0.9 6.4±0.7 2.7±0.5 4.2±1.3 3.3±1.7 3.5±1.3
PROXIMITY 45.1±0.8 10.2±1.0? 2.1±0.6? 0.4±0.2? 3.7±1.5? 2.1±0.3? 3.0±1.4?
CORPUS 46.1±1.1 12.4±1.3? 3.1±0.8? 0.7±0.3? 4.4±1.1 2.2±1.3? 3.4±1.3
STRUCTURE 40.2±3.0? 11.5±1.2? 3.5±0.5? 0.3±0.1? 4.1±1.4 2.1±1.4? 3.0±1.4?
STRUCTURE-PARSED 41.1±2.1? 12.2±0.9? 3.6±0.4? 0.4±0.2? 4.0±1.4 1.6±1.3? 3.2±1.3
PARALLEL 44.6±3.1 16.0±1.5 6.8±1.0 2.9±0.7 4.5±1.0? 3.4±1.6 3.7±1.3
[image:8.612.66.551.71.224.2]GOLD - - - - 4.8±0.4? 4.8±0.6? 4.6±0.7?
Table 4: Automatic evaluation results averaged over 10 random test splits of the data, and human judgements on the
median scoringBLEU-4 test split forPARALLEL. We find significant differences (?p<0.05) in the descriptions
gener-ated byPARALLEL-PARSEDcompared to models that operate over an unstructured bag of image regions representation.
BoldmeansPARALLEL-PARSEDis significantly better thanPROXIMITY,CORPUS, andSTRUCTURE.
the automatic setting, we follow previous work and measure how close the model-generated descrip-tions are to the gold-standard descripdescrip-tions using the BLEU metric. Human judgements were collected from Amazon Mechanical Turk.
5.1 Methodology
The task is to produce a description of an image. The PROXIMITY and CORPUS models have access to gold-standard region labels and region bound-aries at test time. The STRUCTUREandPARALLEL models have additional access to the visual depen-dency representation of the image. These represen-tations are either the gold-standard, or in the case of STRUCTURE-PARSEDandPARALLEL-PARSED, pro-duced by the image parser described in Section 4. Table 2 provides a reminder of the information the different models have access to at training time.
Our data set of 1,023 image–description–VDR tuples was randomly split into 10 folds of 80% training data, 10% development data, and 10% test data. The results we report are means computed over the 10 splits. The image parser used for mod-els STRUCTURE-PARSED and PARALLEL-PARSED is trained on the gold-standard VDRs of the train-ing splits, and then predicts VDRs on the develop-ment and test splits. Significant differences were measured using a one-wayANOVAwithPARALLEL
-PARSEDas the reference3, with differences between pairs of mean checked with a Tukey HSD test.
5.2 Automatic Evaluation
The model-generated descriptions are compared against the human-written gold-standard descrip-tions using the smoothed BLEU measure (Lin and Och, 2004). BLEU is commonly used in ma-chine translation experiments to measure the effec-tive overlap between a reference sentence and a pro-posed translation sentence. Table 4 shows the re-sults on the test data and Figure 4 shows sample out-puts for two images. PARALLEL, the model with access to both image structure and aligned image descriptions at training time outperforms all other models on higher-order BLEU measures. One rea-son for this improvement is thatPARALLELcan for-mulate sentence fragments that relate the subject, a verb, and an object without trying to predict the best object, unlikeCORPUS. The probability associated with each fragment generated for nodes with mul-tiple children also tends to lead to a more accurate order of mentioning image regions. It can also be seen that PARALLEL-PARSED remains significantly better than the other models when theVDRs of im-ages are predicted by an image parser, rather than being gold-standard.
3Recall that
PARALLEL uses gold-standard VDRs and
The weakest results are obtained from a model that relies on the proximity of regions to generate de-scriptions.PROXIMITYachieves competitiveBLEU -1 scores but this is mostly due to it correctly gener-ating region names and determiners.CORPUSis bet-ter than PROXIMITY at correctly producing higher-order n-grams than because it has a better model of the region–region relationships in an image. How-ever, it has difficulties guessing the correct verb for a description, as it relies on corpus co-occurrences for this (see the second example in Table 4). STRUC -TUREuses the VDR of an image to generate the de-scription, which this leads to an improvement over PROXIMITYon some of theBLEUmetrics; however, it is not sufficient to outperformCORPUS.
5.3 Human Judgements
We conducted a human judgement study on Me-chanical Turk to complement the automatic evalu-ation. Workers were paid $0.05 to rate the quality of an image–description pair generated by one of the models using three criteria on a scale from 1 to 5:
1. Grammaticality: give high scores if the de-scription is correct English and doesn’t contain any grammatical mistakes.
2. Action: give high scores if the description cor-rectly describes what people are doing in the image.
3. Scene: give high scores if the description cor-rectly describes the rest of the image (back-ground, other objects, etc).
A total of 101 images were used for this evalua-tion and we obtained five judgments for each image-description pair, resulting in a total of 3,535 judg-ments. To ensure a fair evaluation, we chose the images from the split of the data that gave median BLEU-4 accuracy forPARALLEL, the best perform-ing model in the automatic evaluations.
The right side of Table 4 shows the mean judge-ments for each model for across the three evalua-tion criteria. The gold-standard descripevalua-tions elicited judgements around five, and were significantly bet-ter than the model outputs on all aspects. Further-more, all models produce highly grammatical out-put, with mean ratings of between 3.7 and 4.5. This
can be explained by the fact that the models all relied on templates to ensure grammatical output.
The ratings of the action descriptions reveal the usefulness of structural information. PROXIMITY, CORPUS, and STRUCTURE all perform badly with mean judgements around two, PARALLEL, which uses both image structure and aligned descriptions, significantly outperforms all other models with the exception of PARALLEL-PARSED, which has very similar performance. The fact that PARALLEL and PARALLEL-PARSED perform similarly on all three human measures confirms that automatically parsed VDRs are as useful for image description as gold-standard VDRs.
When we compare the quality of the scene de-scriptions, we notice that all models perform simi-larly, around the middle of the scale. This is proba-bly due to the fact that they all have access to gold-standard region labels, which enables them to cor-rectly refer to regions in the scene most of the time. The additional information about the relationships between regions that STRUCTURE and PARALLEL have access to does not improve the quality of the background scene description.
6 Related Work
Previous work on image description can be grouped into three approaches: description-by-retrieval, de-scription using language models, and template-based description. Ordonez et al. (2011), Farhadi et al. (2010), and Kuznetsova et al. (2012) gener-ate descriptions by retrieving the most similar image from a large data set of images paired with descrip-tions. These approaches are restricted to generating descriptions that are only present in the training set; also, they typically require large amounts of training data and assume images that share similar properties (scene type, objects present) should be described in a similar manner.
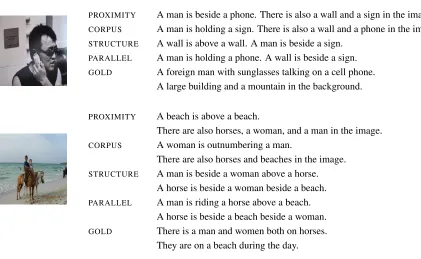
PROXIMITY A man is beside a phone. There is also a wall and a sign in the image.
CORPUS A man is holding a sign. There is also a wall and a phone in the image.
STRUCTURE A wall is above a wall. A man is beside a sign.
PARALLEL A man is holding a phone. A wall is beside a sign.
GOLD A foreign man with sunglasses talking on a cell phone.
A large building and a mountain in the background.
PROXIMITY A beach is above a beach.
There are also horses, a woman, and a man in the image.
CORPUS A woman is outnumbering a man.
There are also horses and beaches in the image.
STRUCTURE A man is beside a woman above a horse.
A horse is beside a woman beside a beach.
PARALLEL A man is riding a horse above a beach.
A horse is beside a beach beside a woman.
GOLD There is a man and women both on horses.
[image:10.612.84.505.53.312.2]They are on a beach during the day.
Figure 4: Some example descriptions produced byPROXIMITY,CORPUS,STRUCTUREandPARALLEL.
background regions. Kulkarni et al. (2011) is closely related to ourPROXIMITYbaseline.
Yang et al. (2011) fill in a sentence template by selecting the likely objects, verbs, prepositions, and scene types based on a Hidden Markov Model. Verbs are generated by finding the most likely pair-ing of object labels in an external corpus. This model is closely related to our CORPUS baseline. Mitchell et al. (2012) over-generates syntactically well-formed sentence fragments and then recom-bines these using a tree-substitution grammar.
Previous research has relied extensively on auto-matically detecting object regions in an image using state-of-the art object detectors (Felzenszwalb et al., 2010). We use gold-standard region annotations to remove this noisy component from the description generation pipeline, allowing us to focus on the util-ity of image structure for description generation.
7 Conclusion
In this paper we introduced a novel representation of an image as a set of dependencies over its an-notated regions. This visual dependency represen-tation encodes which regions are related to each other in an image, and can be used to infer the
ac-tion or event that is depicted. We found that im-age description models based on visual dependency representations significantly outperform competing models in both automatic and human evaluations. We showed that visual dependency representations can be induced automatically using a standard de-pendency parser and that the descriptions generated from the induced representations are as good as the ones generated from gold-standard representations. Future work will focus on improvements to the im-age parser, on exploring this representation in open-domain data sets, and on using the output of an ob-ject detector to obtain a fully automated model.
Acknowledgments
References
Mark Everingham, Luc Van Gool, Christopher K. I. Williams, John Winn, and Andrew Zisserman. 2011. The PASCAL Visual Object Classes Challenge 2011 (VOC2011) Results.
Ali Farhadi, Mohsen Hejrati, Mohammad Amin Sadeghi, Peter Young, Cyrus Rashtchian, Julia Hockenmaier, and David Forsyth. 2010. Every picture tells a story:
generating sentences from images. In ECCV ’10,
pages 15–29, Heraklion, Crete, Greece.
P F Felzenszwalb, R B Girshick, D McAllester, and D Ramanan. 2010. Object Detection with
Discrimi-natively Trained Part-Based Models. IEEE
Transac-tions on Pattern Analysis and Machine Intelligence, 32(9):1627–1645.
Girish Kulkarni, Visruth Premraj, Sagnik Dhar, Siming Li, Yejin Choi, Alexander C. Berg, and Tamara L. Berg. 2011. Baby talk: Understanding and
generat-ing simple image descriptions. In CVPR ’11, pages
1601–1608, Colorado Springs, Colorado, U.S.A. Polina Kuznetsova, Vicente Ordonez, Alexander C. Berg,
Tamara L. Berg, and Yejin Choi. 2012. Collective
Generation of Natural Image Descriptions. In ACL
’12, pages 359–368, Jeju Island, South Korea.
Siming Li, Girish Kulkarni, Tamara L. Berg, Alexan-der C. Berg, and Yejin Choi. 2011. Composing sim-ple image descriptions using web-scale n-grams. In
CoNLL ’11, pages 220–228, Portland, Oregon, U.S.A. Chin-Yew Lin and Franz Josef Och. 2004. Automatic evaluation of machine translation quality using longest common subsequence and skip-bigram statistics. In
ACL ’04, pages 605–612, Barcelona, Spain.
Ryan McDonald, Koby Crammer, and Fernando Pereira.
2005. Online large-margin training of dependency
parsers. In ACL ’05, pages 91–98, University of
Michigan, U.S.A.
Margaret Mitchell, Jesse Dodge, Amit Goyal, Kota Ya-maguchi, Karl Stratos, Alyssa Mensch, Alex Berg, Tamara Berg, and Hal Daum. 2012. Midge : Generat-ing Image Descriptions From Computer Vision
Detec-tions. InEACL ’12, pages 747–756, Avignon, France.
Courtney Napoles, Matthew Gormley, and Benjamin Van
Durme. 2012. Annotated Gigaword. In
AKBC-WEKEX Workshop at NAACL-HLT ’12, Montreal, Canada.
Vicente Ordonez, Girish Kulkarni, and Tamara L. Berg. 2011. Im2Text: Describing Images Using 1 Million
Captioned Photographs. InNIPS 24, Granada, Spain.
Bryan C. Russell, Antonio Torralba, Kevin P. Murphy, and William T. Freeman. 2008. LabelMe: A Database
and Web-Based Tool for Image Annotation. IJCV,
77(1-3):157–173.
Yezhou Yang, Ching Lik Teo, Hal Daum´e III, and Yiannis Aloimonos. 2011. Corpus-Guided Sentence
Genera-tion of Natural Images. InEMNLP ’11, pages 444–