ISSN Online: 2160-5874 ISSN Print: 2160-5866
DOI: 10.4236/jbbs.2019.910026 Oct. 12, 2019 351 Journal of Behavioral and Brain Science
Pilot Test for the Relationship between Drivers’
Hazard Perception Ability and Cognitive Traits
of Empathizing-Systemizing
Mikio Danno
Toyota InfoTechnology Center, Co., Ltd., Tokyo, Japan (Affiliation at the Time This Study Was Conducted)
Abstract
The previous research (Danno & Taniguchi, 2015) showed that near-miss in-cident experience was basically reduced by the Empathy Quotient (EQ) and was disturbed by the Systemizing Quotient (SQ) when the Empathy Quotient was low, based on the Empathizing and Systemizing (E-S) model using a web survey [1]. It means that drivers whose EQ was low and SQ was high had more near-miss incident experience. It suggested that drivers who have a stronger Empathizing function may have stronger hazard perception ability although the Systemizing function may weaken hazard perception ability when Empathizing is weak. And, then, it was revealed that the D score (stan-dard SQ (T) score minus stan(stan-dard EQ (T) score) had a significant effect on the near-miss incident experience. Those results implied that a D score, which is used to classify “E-S types”, should have a relationship with near-miss inci-dent experience, i.e., hazard perception ability. The EQ and SQ scores were supposed to relate to the cognitive ability to estimate other road users’ mental situations and predict their behavior or to recognize stable laws in traffic sit-uations. The aim of this research was to investigate the relationship between a driver’s visual attention ability (gaze movement) and hazard (near-miss inci-dent) perception ability of different EQ and SQ scores. Drivers’ Real-time Use-ful Field of View (rUFOV) [2] was measured under normal and hasty driving conditions in a driving simulator which had six scenarios of traffic situation. The result from seven participants who had different EQ and SQ scores showed that a driver’s visual attention ability (gaze movement) corresponds to their scores. This pilot test research revealed a possibility that the individu-al difference in cognitive trait with E-S model could be a promising tool to understand the mechanism of hazard perception since a D score is used to classify “E-S types”.
How to cite this paper: Danno, M. (2019) Pilot Test for the Relationship between Drivers’ Hazard Perception Ability and Cog-nitive Traits of Empathizing-Systemizing. Journal of Behavioral and Brain Science, 9, 351-361.
https://doi.org/10.4236/jbbs.2019.910026
Received: September 1, 2019 Accepted: October 9, 2019 Published: October 12, 2019
Copyright © 2019 by author(s) and Scientific Research Publishing Inc. This work is licensed under the Creative Commons Attribution International License (CC BY 4.0).
DOI: 10.4236/jbbs.2019.910026 352 Journal of Behavioral and Brain Science
Keywords
Hazard Perception, Empathizing-Systemizing, Gaze Response Speed, Traffic Accident, Near-Miss Incident
1. Introduction
Personality traits of high-risk or “accident-prone” drivers have been described in many researches. However, as McCrae & Costa (1995) showed, personality traits in relation to accident involvement and risky driving behavior have only an in-direct effect to an individual’s perception and environmental appraisal, which are thought to affect his subsequent driving behavior [3]. Safe car driving is main-tained by detecting other road users or any structures in sufficient time, then ex-ercising proper judgment and driving skill to avoid a collision. The hazard per-ception of a driver determines the ability to detect a potential collision.
Danno & Taniguchi (2015) showed that near-miss incident experience was basically reduced by the Empathy Quotient and was disturbed by the Systemiz-ing Quotient when the Empathy Quotient was low [1], based on Wakabayashi et al. [4]. They also showed that a D score (difference between Systemizing Quo-tient standard score and Empathy QuoQuo-tient standard score), which is used to classify the term “E-S types” into five cognitive types using a two-dimensional coordinate (Empathy Quotient and Systemizing Quotient), relates to dangerous experience. Dangerous experience during driving is caused by a drivers’ failure of perceiving a hazard while driving, such as reading a sign or recognizing a ha-zard (oversight). They are due not only to their weak target detection ability, but also to their slow eye movement.
Mihal & Barrett (1976) reported that both perceptual styles (an individual’s ability to extract salient information from a complex background) and selective attention are related to accidents [5]. Elander, West, & French (1993) found that slower detection of hazards was associated with higher crash rates independent of age and mileage [6], and Green, Kremar, Walters, Rubin, & Hale (2000) found that more general ability to detect visual targets embedded in a complex back-ground, and ability to switch attention rapidly, also appear to be associated with lower crash risk [7]. Underwood, Grundall, & Chapman (2011) argued that us-ing simulated hazards, attention appears to be captured on the approach to the hazard (when the source of the hazard might be visible, though the hazard has not yet triggered) while saccade amplitude and the spread of search are signifi-cantly increased [8].
DOI: 10.4236/jbbs.2019.910026 353 Journal of Behavioral and Brain Science
2. Method
Experiment design. The aim of this research was to explore the possible ten-dency of the relationship between EQ and SQ scores and visual attention capa-bility, so the visual attention capability of a few participants with different EQ and SQ scores was measured by rUFOV (Real-time Useful Field of View) me-thod in the driving simulator. The basic design of the experiment was seven par-ticipants (who have different EQ and SQ scores) x two driving conditions (nor-mal and hasty driving). We assumed that, under hasty driving, a driver decreases the size of UFOV with the high frequent eye movement to find out many poten-tial risks (the traffic objects hidden in shape) quickly, and, under normal driving, a driver increases the size of UFOV with smaller moving distance and less fre-quent eye movement due to a narrower angles and a less potential risk. Thus, an increase in mental load was reported to adversely affect the range of vision range (i.e., to make it more narrow) and to cause the driver’s gaze direction to concen-trate more on the vehicle’s direction of movement [9]. To make the hasty driving situation, the participants were directed to drive faster than the normal driving, and the safety actions were passed on to the driver.
EQ, SQ, D and E-S type. In order to measure a person’s cognitive style, the short forms of the Empathy Quotient (EQ) and the Systemizing Quotient (SQ) [4] were used. It consisted of 22 items for empathizing and 25 items for syste-mizing. Participants were classified into five E-S types based on their EQ and SQ. The procedure to decide participants’ brain type is described as follows. The raw EQ and SQ scores from each participant were standardized in order to adjust their dispersion and translated into T scores (T = 10z + 50) to produce EQ (T) and SQ (T) scores. Then the difference score
(
SQ( )
T −EQ( )
T)
were obtained as “D” score. A high D score in the positive direction can be attained by a high SQ (T) score with a low EQ (T) score, and a high D score in the nega-tive direction can be attained by a low SQ (T) score with a high EQ (T) score. A low D score means the difference between EQ (T) and SQ (T) scores is small. The greater the D score in a positive direction, the stronger is one’s systemizing, and the greater the D score in a negative direction, the stronger is one’s empa-thizing. D < −20 is extreme E type (EE), −10 > D > −20 is E type (E), −10 < D < 10 is balanced type (B), 10 < D < 20 is S type (S), and 20 < D is extreme S type (SS).DOI: 10.4236/jbbs.2019.910026 354 Journal of Behavioral and Brain Science Measurement of driver’s visual attention ability (gaze movement). In or-der to assess the degree of a driver’s cognition error in actual normal driving, we focused on the function of peripheral vision that is used to detect information (road signs, potential hazards, and changes in traffic flow) as fast as possible. Af-ter detecting and noticing something important with peripheral vision, a driver will first normally move their eyes in the direction of the event of interest, fol-lowed by the head and the finest spatial detail that can be perceived with his central vision (the macula of the retina normally corresponds to the central 13˚ of the visual field). We proposed a new real-time method to measure the driver’s useful field of view (UFOV) while driving a car in ordinary traffic situations in an urban environment (Figure 1, Figure 3). This is called the real-time useful field of view (rUFOV) method [2].
[image:4.595.204.542.414.710.2]This real-time useful field of view (rUFOV) method [2] measures the time difference between the appearance time of those objects in a driver’s peripheral vision and the time the driver perceives it at the central vision, and its viewing angle degree differences. In other words, the time at which objects appeared in the driver’s peripheral region and the time at which the driver looked at objects within their central vision are extracted from the driver’s yaw angle data. Then, we can obtain the visual gaze response time: T [second], moved angles (yaw an-gle): Φ [degree], and the visual gaze response speed: S [degree/second] by the following formula.
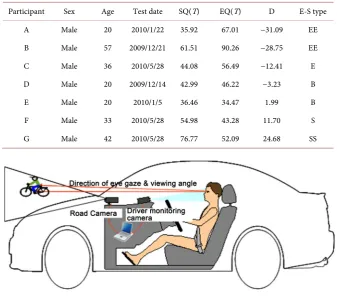
Table 1. Each participant’s basic traits and E-S indexes.
Participant Sex Age Test date SQ(T) EQ(T) D E-S type
A Male 20 2010/1/22 35.92 67.01 −31.09 EE
B Male 57 2009/12/21 61.51 90.26 −28.75 EE
C Male 36 2010/5/28 44.08 56.49 −12.41 E
D Male 20 2009/12/14 42.99 46.22 −3.23 B
E Male 20 2010/1/5 36.46 34.47 1.99 B
F Male 33 2010/5/28 54.98 43.28 11.70 S
[image:4.595.206.541.416.717.2]G Male 42 2010/5/28 76.77 52.09 24.68 SS
DOI: 10.4236/jbbs.2019.910026 355 Journal of Behavioral and Brain Science T Tb Ta= − (1)
b a
Φ = Φ − Φ
(2) S= Φ T (3) Driving simulator. The driving simulator was equipped with a stereo camera based visual tracking system (the faceLAB system created by Seeing Machines) with a 60 Hz frame rate and an information processing system shown in Figure 2. The driving simulator was equipped with left and right wing mirrors and a rear-view mirror in the same way as in a test vehicle (Figure 1). The faceLAB camera was fitted at the top of the dashboard to analyze the driver’s gaze informa-tion. A projector was installed on the ceiling of the driving simulator to project the driving course onto a screen. Participants were instructed to drive this course after an announcement. [image:5.595.245.501.347.524.2]
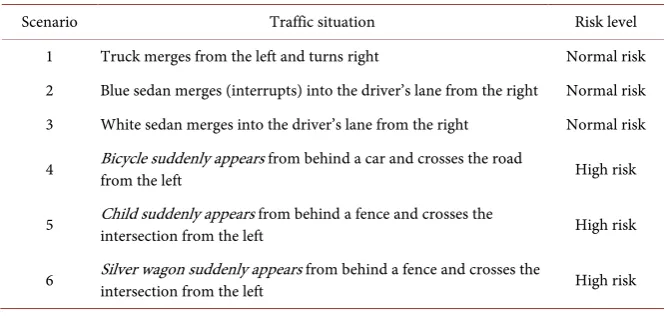
This driving simulator included six near-miss crash scenarios classified with two potential risk levels (Table 2). Those risk levels were assessed by experi-menters depending on the time a driver has for recognizing hazardous objects. “High risk” means a driver has almost no time because of sudden appearance, “normal risk” means a little time. As the results of experiments, under high risk
Figure 2. Driving simulator system.
Table 2. Traffic scenarios and potential risk level.
Scenario Traffic situation Risk level
1 Truck merges from the left and turns right Normal risk
2 Blue sedan merges (interrupts) into the driver’s lane from the right Normal risk
3 White sedan merges into the driver’s lane from the right Normal risk
4 Bicycle suddenly appears from behind a car and crosses the road from the left High risk
5 Child suddenly appears from behind a fence and crosses the intersection from the left High risk
[image:5.595.206.540.571.737.2]DOI: 10.4236/jbbs.2019.910026 356 Journal of Behavioral and Brain Science traffic scenarios different from normal risk traffic scenarios that hazardous ob-ject is suddenly appears from behind a car or a fence and cross the road from the left, a driver perceives it at the central vision suddenly without appearing in a driver’s peripheral vision at the extreme case. There was a tendency in many cases of high risk traffic scenarios of a driver’s to gaze direction that are closer to the front direction than in normal risk traffic scenarios due to the difference in the appearance time of those objects in a driver’s peripheral vision. The mea-surement examples of both normal risk traffic scenario and high risk scenario are shown in Figure 3 and Figure 5. The same driving course (route, appearance of objects, traffic signals, and the like) was used for all the scenarios.
Other information obtained included data from the faceLAB system (head po-sition, head orientation angle, head position tracking quality, eye popo-sition, and gaze direction), heart rate (at repose and during driving) and driving time.
Procedure. Table 3 shows the time schedule of the experiment. Test driving with six near-miss crash scenarios was conducted continuously in normal and hasty driving conditions respectively. To create the hasty driving situation, the participants were directed to drive faster than normal driving. The questionnaire was given to the participants just after completing each driving test to obtain a subjective assessment of the degree of haste and impatience on five levels from 1 (lowest) to 5 (highest).
3. Results
The data of the first normal driving condition was not analyzed because the par-ticipants were still habituating themselves to the experimental situation and sta-bilizing their mental state. The second normal driving and the hasty driving
[image:6.595.224.526.460.563.2]Figure 3. Measurement results of rUFOV (Normal risk traffic scenario 1). The traced propagation path of the object was shown by a dotted (green) line in each frame. The gaze area of 13˚ in the larger (red) box and the face direction in the small (blue) box located in the same position of the larger (red) box in this figure were measured from driver’s yaw angle.
Table 3. Time schedule of the driving simulation experiment.
Start →
Calibration for visual measurement
Practice driving Reset
The first normal driving Reset
The second normal
driving Reset Hasty driving Reset
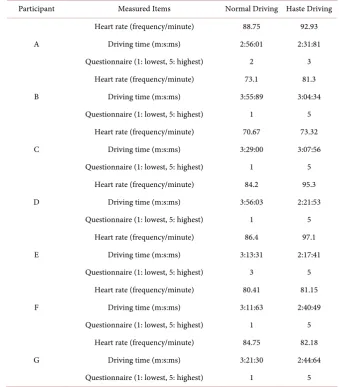
DOI: 10.4236/jbbs.2019.910026 357 Journal of Behavioral and Brain Science conditions were analyzed. The relationships among different SQ and EQ scores, UFOV and driving conditions were not found in the high risk level scenarios. Therefore, this article describes only the result obtained with the scenario of normal risk level. As shown in Table 4, all the participants’ driving time in the hasty driving condition was shorter than that in the ordinary driving condition. They experienced a higher heart rate during the hasty driving than during the normal driving except participant G, and they all answered on the questionnaire that they felt haste and impatience during the hasty driving comparing the nor-mal driving, although the amount of each participant’s difference varied. Thus, it can be concluded that the hasty driving condition actually generated hasty beha-vior, physiological change, and subjective feelings of haste.
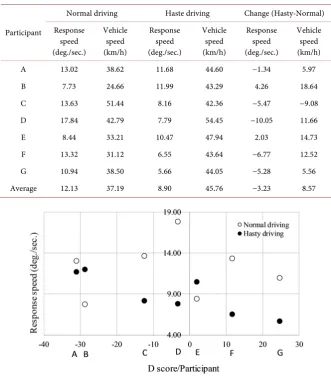
[image:7.595.200.540.323.711.2]Table 5 reveals the result of visual gaze response speeds and their driving speed of vehicles in normal driving and hasty driving condition, and their amount of change between those two conditions. The average visual gaze response speed in the hasty drive condition decreased 3.23 deg./sec. than the normal driving condition,
Table 4. Results of heart rate, driving time, and questionnaire of each participant.
Participant Measured Items Normal Driving Haste Driving
Heart rate (frequency/minute) 88.75 92.93
A Driving time (m:s:ms) 2:56:01 2:31:81
Questionnaire (1: lowest, 5: highest) 2 3
Heart rate (frequency/minute) 73.1 81.3
B Driving time (m:s:ms) 3:55:89 3:04:34
Questionnaire (1: lowest, 5: highest) 1 5
Heart rate (frequency/minute) 70.67 73.32
C Driving time (m:s:ms) 3:29:00 3:07:56
Questionnaire (1: lowest, 5: highest) 1 5
Heart rate (frequency/minute) 84.2 95.3
D Driving time (m:s:ms) 3:56:03 2:21:53
Questionnaire (1: lowest, 5: highest) 1 5
Heart rate (frequency/minute) 86.4 97.1
E Driving time (m:s:ms) 3:13:31 2:17:41
Questionnaire (1: lowest, 5: highest) 3 5
Heart rate (frequency/minute) 80.41 81.15
F Driving time (m:s:ms) 3:11:63 2:40:49
Questionnaire (1: lowest, 5: highest) 1 5
Heart rate (frequency/minute) 84.75 82.18
G Driving time (m:s:ms) 3:21:30 2:44:64
Questionnaire (1: lowest, 5: highest) 1 5
DOI: 10.4236/jbbs.2019.910026 358 Journal of Behavioral and Brain Science and the average vehicle speeds increased 8.57 km/h than the normal driving condition. The visual gaze response speed, which is the size of UFOV, decreased in many cases when the mental workload increased from normal driving to has-ty driving.
Figure 4 shows the scatter gram which reveals the relation between visual gaze response speeds and D score (the classifier of the E-S type) of seven participants in the normal and hasty driving conditions. The response speed declines corres-ponding to the increase of D score in the hasty driving condition, although the tendency is not shown in the normal condition. This result means that a partici-pant with a lower D score has more visual attention capability and is able to re-spond faster to hazards than a participant with a larger D score. In order to con-firm the effect of interaction with a D score, the simple regression analysis was conducted with a D score as the independent variable on the dependent variable of visual gaze response speed (b = −0.106, t = −3.929, p < 0.05, R2 = 0.755).
Table 5. Each participant’s visual gaze response speed and vehicle speed during normal and hasty driving and the change between them.
Participant
Normal driving Haste driving Change (Hasty-Normal)
Response speed (deg./sec.)
Vehicle speed (km/h)
Response speed (deg./sec.)
Vehicle speed (km/h)
Response speed (deg./sec.)
Vehicle speed (km/h)
A 13.02 38.62 11.68 44.60 −1.34 5.97
B 7.73 24.66 11.99 43.29 4.26 18.64
C 13.63 51.44 8.16 42.36 −5.47 −9.08
D 17.84 42.79 7.79 54.45 −10.05 11.66
E 8.44 33.21 10.47 47.94 2.03 14.73
F 13.32 31.12 6.55 43.64 −6.77 12.52
G 10.94 38.50 5.66 44.05 −5.28 5.56
[image:8.595.208.538.323.691.2]Average 12.13 37.19 8.90 45.76 −3.23 8.57
DOI: 10.4236/jbbs.2019.910026 359 Journal of Behavioral and Brain Science It should be noted that the visual gaze response speed of a driver with a large D score in the positive direction was slower than that of a driver with a large D score in the negative direction especially when the mental workload increased (as in hasty driving).
4. Discussion
It is suggested that a driver’s ability of hazard perception should be lowered in the hasty driving condition based on the result the visual gaze response speed fell down. This confirms that a driver should maintain a stable mental situation evading a stressful mental workload as hasty driving. Furthermore, this research predicted the relationship between the hazard perception in traffic situations and individual cognitive traits of Empathizing and Systemizing and confirmed the relationship between its level of hazard sensitivity and E-S type by directly mea-suring the ability of hazard perception through the rUFOV method. The lower D score drivers’ decreasing vision angle and increasing visual gaze response speed might mean that they had a higher level of hazard sensitivity and they could be regarded as safe drivers. On the contrary, the larger D score drivers could be unsafe drivers since the larger D score drivers have less visual attention capabili-ty and are able to respond slower to hazards than the lower D score drivers. This does not contradict the results of the web survey findings [1].
However, it should be noted that the relationship between the D scores and a driver’s visual attention ability was revealed in the hasty driving condition but not in the normal driving condition. Furthermore, it should be noted as well that the relationship was not found in the high risk of near-miss crash traffic situa-tions. A driver might have had almost no time to move his gaze to recognize ha-zardous objects because of their sudden appearance in the high risk situations so that the effect of D score could not occur. Only the normal risk situations were relevant for the effect of D score to occur. In the high risk traffic scenario 4 that bicycle is suddenly appears from behind a car and cross the road from the left, the result for the UFOV of participant B is shown in Figure 5. There was a ten-dency in many cases of hasty driving of a driver’s to gaze direction to turn to objects that are closer to the driver than in normal driving due to the difference in driving speeds. In this case, participant B’s vision range (UFOV) seems to be-come narrower in the hasty run. In fact, participant B was not intentionally turning his gaze to the bicycle when the bicycle suddenly turned around in his gaze. As a result, the bicycle seemed to appear directly in front of the vehicle in the intersection, resulting in a collision happened. Furthermore, under no risk traffic situations such that a driver might not have needed to move his gaze to those objects even in the hasty driving condition because he might have recog-nized those objects as not dangerous, the effect of D score might not occur.
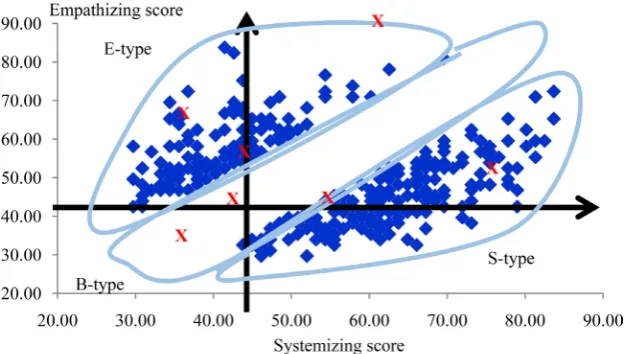
DOI: 10.4236/jbbs.2019.910026 360 Journal of Behavioral and Brain Science above might possibly exist although the number of participants is not enough to make a final conclusion and further experiments with more participants were necessary. However, it should be noted that the “x” marks indicate the locations of the corresponding each Empathizing and Systemizing score of seven partici-pants (from A to G) discussed in this paper. Those positions are well-balanced and almost equally distributed along the range of two dimensional coordinate of both Empathizing and Systemizing scores obtained from the Web survey data (N = 811) [1] shown in Figure 6.
5. Conclusions
Thus, in conclusion, it is expected to elaborate the functional relationship be-tween physical attention mechanism in terms of a driver’s visual attention capa-bility (gaze movement or saccade amplitude) and hazard perception capacapa-bility as a cognitive trait by reflecting knowledge of similar studies as well in the next step.
[image:10.595.224.526.356.456.2]This knowledge can contribute to finding an actual method for driver educa-tion. With E-S model, there is a possibility of identifying drivers who have weak cognitive ability and determining its extent of the potential of hazard sensitivity
Figure 5. Measurement result for participant B for high risk traffic scenario 4. The traced propagation path of the object was shown by a dotted (green) line in each frame. The gaze area of 13˚ in the larger (red) box and the face direction in the small (blue) box located in the right of the larger (red) box in this figure were measured from driver’s yaw angle.
[image:10.595.217.530.524.701.2]DOI: 10.4236/jbbs.2019.910026 361 Journal of Behavioral and Brain Science in advance of driving. It would be very useful to have a driving support system with an rUFOV system which grasps the situation in advance, and then prevents traffic accidents by providing the driver with appropriate feedback to stimulate careful driving. If any reduction of UFOV value can be found in comparison with past (standardized) values, the rUFOV system would warn the driver ac-cording to the driver’s D scores based on E-S model.
Conflicts of Interest
The author declares no conflicts of interest regarding the publication of this pa-per.
References
[1] Danno, M. and Taniguchi, S. (2015) The Analysis of Drivers’ Hazard Detecting Ability Using Empathizing-Systemizing Model. Transportation Research Part F, 33, 106-116. https://doi.org/10.1016/j.trf.2015.07.003
[2] Danno, M., Kutila, M. and Kortelainen, J. (2011) Measurement of Driver’s Visual Attention Abilities Using Real-Time UFOV Method. International Journal of Intel-ligent Transportation Systems Research, 9, 115-127.
https://doi.org/10.1007/s13177-011-0033-1
[3] McCrae, R.R. and Costa, P.T. (1995) Trait Explanations in Personality Psychology. European Journal of Personality, 9, 231-252.
https://doi.org/10.1002/per.2410090402
[4] Wakabayashi, A., Baron-Cohen, S., Wheelwright, S., Goldenfeld, N., Delaney, J., Fine, D.F., Smith, R. and Weil, L. (2006) Development of Short Forms of the Em-pathy Quotient (EQ-Short) and the Systemizing Quotient (SQ-Short). Personality and Individual Differences, 41, 929-940. https://doi.org/10.1016/j.paid.2006.03.017 [5] Mihal, W.L. and Barrett, G.V. (1976) Individual Differences in Perceptual
Informa-tion Processing and Their RelaInforma-tion to Automobile Accident Involvement. Journal of Applied Psychology, 61, 229-233. https://doi.org/10.1037/0021-9010.61.2.229 [6] Elander, J., West, R. and French, D. (1993) Behavioral Correlates of Individual
Dif-ferences in Road-Traffic Crash Risk: An Examination of Methods and Findings. Psychosomatic Bulletin, 113, 279-294. https://doi.org/10.1037/0033-2909.113.2.279 [7] Green, K., Kremar, M., Walters, L.H., Rubin, D.L. and Hale, J.L. (2000) Targeting
Adolescent Risk-Takers: The Contribution of Egocentrism and Sensation-Seeking. Journal of Adolescence, 23, 439-461. https://doi.org/10.1006/jado.2000.0330 [8] Underwood, G., Grundall, D. and Chapman, P. (2011) Driving Simulator
Valida-tion with Hazard PercepValida-tion. Transportation Research Part F, 14, 435-446. https://doi.org/10.1016/j.trf.2011.04.008