Variability in the CO ro-vibrational lines from HD163296
Rosina P. Hein Bertelsen,
1‹I. Kamp,
1‹G. van der Plas,
2M. E. van den Ancker,
3L. B. F. M. Waters,
4,5W.-F. Thi
6and P. Woitke
71Kapteyn Astronomical Institute, Rijks-universiteit Groningen (RuG), Landleven 12, NL-9747 Groningen, the Netherlands 2Departamento de Astronom´ıa, Universidad de Chile, Casilla 36-D, Santiago, Chile
3European Southern Observatory, Karl-Schwarzschild-Str.2, D-85748 Garching bei M¨unchen, Germany
4Anton Pannekoek Astronomical Institute, University of Amsterdam, PO Box 94249, NL-1090 GE Amsterdam, the Netherlands 5SRON Netherlands Institute for Space Research, Sorbonnelaan 2, NL-3584 CA Utrecht, the Netherlands
6Max-Planck-Institut f¨ur extraterrestrische Physik, Giessenbachstrasse 1, D-85748 Garching, Germany 7SUPA, School of Physics & Astronomy, University of St. Andrews, North Haugh, St. Andrews KY16 9SS, UK
Accepted 2016 January 3. Received 2015 December 21; in original form 2015 September 24
A B S T R A C T
We present for the first time a direct comparison of multi-epoch (2001–2002 and 2012) CO ro-vibrational emission lines from HD 163296. We find that both the line shapes and the FWHM (full width at half-maximum) differ between these two epochs. The FWHM of the median observed line profiles are 10–25 km s−1 larger in the earlier epoch, and confirmed
double peaks are only present in highJlines from 2001 to 2002. The line wings of individual transitions are similar in the two epochs making an additional central component in the later epoch a likely explanation for the single peaks and the lower FWHM. Variations in near-infrared brightness have been reported and could be linked to the observed variations. Additionally, we use the thermo-chemical disc codePRODIMOto compare for the first time the
line shapes, peak separations, FWHM, and line fluxes, to those observed. ThePRODIMOmodel
reproduces the peak separations, and low and midJline fluxes well. The FWHM however, are overpredicted and highJline fluxes are underpredicted. We propose that a variable non-Keplerian component of the CO ro-vibrational emission, such as a disc wind or an episodic accretion funnel, is causing the difference between the two data sets collected at different epochs, and between model and observations. Additional CO ro-vibrational line detections (with cryogenic high-resolution infrared echelle spectrograph/Very Large Telescope (VLT) or Near InfraRed SPECtrometer/Keck) or [Ne II] line observations with VLT Imager and
Spectrometer for mid Infrared/VLT could help to clarify the cause of the variability.
Key words: line: profiles – protoplanetary discs – circumstellar matter – stars: variables: T Tauri, Herbig Ae/Be – infrared: ISM.
1 I N T R O D U C T I O N
Herbig Ae/Be (HAeBe) stars are intermediate mass pre-main-sequence stars that are surrounded by discs. CO ro-vibrational emis-sion is frequently observed from these discs (Blake & Boogert2004; Brittain et al.2007; Brittain, Najita & Carr2009; van der Plas et al.
2015) and traces the inner regions close to the star, where planet formation is expected to occur.
HD 163296 is a well-studied Herbig Ae star of spectral type A3Ve (Gray & Corbally1998) located at a distance of 118.6 pc (Hipparcos). It has been labeled a group II source (flat disc) by Meeus et al. (2001) and the stellar mass of the system has been es-timated toM∗∼2.3 M(Montesinos et al.2009). Using spatially
E-mail:[email protected](RPHB);[email protected](IK)
resolved sub-mm data, the inclination of the disc has been estimated to 46◦±4◦and the position angle to 128◦±4◦(Isella et al.2007). The disc has been studied through interferometric observations of both continuum and CO emission lines (0.87–7.0 mm; Isella et al.2007). From the line emission the authors found the12CO and13CO to be optically thick and derive an outer radius of 550±50 au. The con-tinuum dust emission implies an outer radius of 200±15 au. Thus, a sharp drop in continuum emission of a factor>30 at a radius of 200 au, was invoked to explain the lack of continuum emission from radii larger than 200 au (Isella et al.2007). Meanwhile, from a non-detection of the red-shifted jet beyond 500 au radius (Grady et al.
2000) and the extent of the scattered light emission (Wisniewski et al.2008) the radius of the dust disc can be estimated to 500 au.
Tilling et al. (2012) presented Herschel/PACS observations of the disc, and used the line detections from this data set together with additional line and continuum data to fit aPRODIMO(Woitke, Kamp
at University of St Andrews on May 6, 2016
http://mnras.oxfordjournals.org/
& Thi2009) model, in an attempt to determine disc properties. A continuous disc with inner and outer radii of 0.45 and 700 au provided a reasonable fit to the optical to millimetre continuum spectral energy distribution (SED), the low an midJCO line inten-sities, and the spectral profiles from ground-based interferometric observations. ALMA observations (band 7,∼850µm) have put the outer dust disc radius at 240 au and the CO outer radius at 575 au (de Gregorio-Monsalvo et al.2013; Rosenfeld et al.2013). A well resolved dusty disc was seen with no indications of gaps or holes beyond 25 au. de Gregorio-Monsalvo et al. (2013) conclude that a standard tapered-edge model with one unique density profile cannot match both data sets at once. The CO channel maps require a thicker gas disc, while the mid- and far-infrared SED require a flatter dust disc than presented in Tilling et al. (2012).
CO ro-vibrational v = 1–0 emission lines from this disc have been studied on several occasions (Blake & Boogert2004; Brittain et al.2007; Salyk et al.2011, Bertelsen et al. submitted, from hereon B15). In Salyk et al. (2011), using Near InfraRed SPEC-trometer (NIRSPEC) data from the Keck telescope, the authors identified double peaked profiles and full width at half-maximum (FWHM)∼83 km s−1 (for J> 25) indicating that the origin of the emission is close to the star. Assuming Keplerian rotation, the peak separation measured from the highJprofiles would suggest an outer radius for the emission of 2–3 au. Recently, we have col-lected spectra containing CO ro-vibrational emission lines with cryogenic high-resolution infrared echelle spectrograph (CRIRES) at the Very Large Telescope (VLT), and found single peaked profiles for lowJlines while highJlines displayed asymmetric flat topped profiles (B15).
In coronagraphic images a bipolar jet (HH 409) has been seen (Grady et al.2000), with radial velocities for the gas in the jet of 200–300 km s−1. HD 163296 has shown variations in NIR (near-infrared) brightness (over 30 per cent inJband, 20 per cent atH band, and 15 per cent atKband; de Winter et al. 2001) on time-scales of years (Sitko et al.2008). This was seen as an outburst in the 1–5µm wavelength region during 2002. This wavelength region corresponds to a bump frequently seen in SEDs of many HAeBes and is thought to be related to the inner wall of the dust disc (Natta et al.2001; Dominik et al.2003). Variability in this region could be related to an increase of the surface area of the inner wall (puffed up inner wall; Sitko et al.2008). Sitko et al. (2008) found no SED model (based on data from one epoch) that could explain the full nature of this source.
Ellerbroek et al. (2014) matched transient optical fading with the enhanced NIR excess (also noticed by Sitko et al.2008) and relate these to the jet (HH 409). The authors suggest a scenario where dust clouds, that are launched above the disc plane to heights where they cross the observers line of sight to the star, are responsible for the optical and NIR variability. Ellerbroek et al. (2014) derive a period of 16.0±0.7 yr for the increased outflow activity from the jet. Due to epoch-sparsity of the photometric data, it could not be confirmed whether the jet period matches the NIR and optical variations, and thereby that a single mechanism is in fact responsible for both jet and photometric variability. Klaassen et al. (2013) reported the detection of a rotating molecular disc wind that extends to more than 10 arcsec, seen from ALMA observations of the COJ=2–1 andJ=3–2 lines.
Using high spectral resolution (R∼12 000) VLTI-AMBER ob-servations Garcia Lopez et al. (2015) studied the Brγ line of HD 163296 and attempted to constrain the physical origin of this line. They compared the observations to predictions from a line ra-diative transfer disc wind model and found that the observations and
the modelling both suggest that the Brγemission in this disc comes from a disc wind with launching radii from∼0.02 to∼0.04 au, while the entire disc wind emitting region stretches out to∼0.16 au.
In this paper, we will study the variability in the CO ro-vibrational lines over a period of 10 yr (2001–2002 to 2012) and investigate the connection with variability observed in the optical and NIR continuum. First, we present the three sets of observational data, and the line profiles and FWHM derived from them in a homoge-neous way (Sections 2 and 3). Hereafter, we compare with modelled CO ro-vibrational lines produced using a previously published disc structure (Tilling et al.2012), in order to understand the observed CO ro-vibrational line emission (Section 4). This also tests the pre-dicting power of the model, keeping in mind that it has been fitted to a wide variety of observational data, but never before to the CO ro-vibrational lines themselves. We finish the paper with a discus-sion of how the line variability can be interpreted in the context of both model and observations (Section 5) and present the final conclusions in Section 6.
2 O B S E RVAT I O N A L DATA
We use high resolution spectra (R∼100 000) of HD 163296 col-lected in 2012 March with the VLT CRIRES (Kaeufl et al.2004). From hereon we refer to this data set as C12. These observations cover a wavelength range from 4.5 to 5µm with six different grating settings (4.6575, 4.7363, 4.9948, 4.6376, 4.8219, and 5.0087µm). The details of the data reduction and flux calibration can be found in B15. From C12, we include lines fromJ=0 up toJ=36.
For comparison we use high-resolution spectra (R∼ 25 000) of HD 163296 collected with NIRSPEC (McLean et al.1998) on the Keck II telescope. These observations are collected during the period 2001–2002. The spectra from different epochs were com-bined, resulting in one single spectrum per wavelength region. This stacking of the lines is necessary in order to improve the S/N on the line profiles. Furthermore, there is no sign of variability between epochs beyond the noise in the spectra (Salyk, private communica-tion), hence the combining of the spectra is justified. From hereon we refer to this data set as N01/02. Due to low transmission (60– 80 per cent) certain regions were left out of this final spectrum, causing several transitions to have gaps in the centre of their line profiles (see middle frame of Fig.1). The observations span a wave-length range from∼4.65 to 5.15µm and include lines fromJ=1 up toJ=37. Details on data acquisition and reduction for N01/02 can be found in Salyk et al. (2011,2009) and Blake & Boogert (2004). We also included additional spectra from NIRSPEC on the Keck II telescope, obtained in 2002 March. From hereon we refer to this data set as N02b. The observations span a wavelength region from∼4.64 to 5.02µm and include lines fromJ= 1 up toJ= 33. However, this data set has several lines distorted by telluric overcorrection, due to variable telluric water lines during the night of observations. The data reduction for N02b can be found in Brittain et al. (2007).
For C12, we found a continuum flux at 4.770µm of 16.3 Jy (B15). For typical CRIRES spectra, we can expect the accuracy of the flux calibration to be around ∼30 per cent (Brown et al.
2013), due to differences in width of the point spread function for the science versus the telluric standard spectra (these differences are expected to be due to variations in the performance of the AO system). From the N01/02 spectrum a continuum flux at 4.770µm of 12.1 Jy was found. An error of 10–20 per cent is expected. The continuum fluxes measured for C12 and N01/02 are consistent
at University of St Andrews on May 6, 2016
http://mnras.oxfordjournals.org/
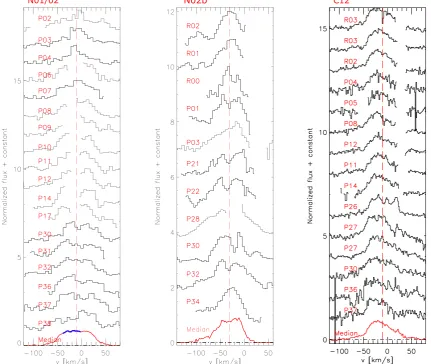
Figure 1. Individual line profiles and the median at the bottom from all three data sets. Left: line profiles from N01/02. Middle: line profiles from N02b. Right: line profiles from C12. Line identifications are indicated on the plots. Several lines from the N01/02 data set have ‘gaps’ at the line centres, thus the region marked in blue on the N01/02 median, corresponding to these missing regions, should be deemed less reliable. Some lines in the C12 data set are detected twice due to overlapping wavelength settings.
within the uncertainties. For BN02b, we do not have flux calibrated spectra.
3 O B S E RVAT I O N A L R E S U LT S A N D A N A LY S I S
The individual lines collected from the three observational data sets are shown in Fig.1. For the CRIRES data the spectral resolution is R=100 000, corresponding tov=3 km s−1, while for NIRSPEC it is R = 25 000, corresponding to v = 12 km s−1. The lines displayed in Fig.1have smaller spacing between velocity channels than thev=3 km s−1andv=12 km s−1mentioned above (the C12 data has ∼1.5 km s−1, the N01/02 data has ∼4 km s−1, and the N02b data has∼5 km s−1) due to fine sampling of the spectral resolution. In Fig. 2, we show normalized line profiles compiled from co-adding either all lines, all lowJlines (J<10), all midJ lines (10<J<20), or all highJlines (J>20), in separate medians for C12, N01/02 and N02b.
The C12 spectrum shows single peaked emission lines for low and midJvalues while flat topped asymmetric profiles with shoulders seem to be present at higherJ. The N01/02 spectrum shows single peaked emission lines for lowJ, while mid and highJlines show either double peaked or flat topped profiles. However, the central
dips in the double peaked profiles are comparable to the noise, and many double peaked profiles have central gaps in the spectra, where low transmission regions due to strong telluric absorption occurred (Fig.1). Even line profiles that display what looks like the normal central dip of a Keplerian profile could in fact be affected by telluric residuals that mimic the typical shape. Hence, the double peaked nature is uncertain for low and midJlines. HighJlines however, are unlikely to be affected heavily by telluric absorption (lines ofJ∼25–30 or higher show no significant telluric absorption, see e.g. the C12 spectra), and are therefore more reliable. The N02b spectrum shows a general mix between single peaked and double peaked emission lines with no clear connection with high or lowJ. Also, several lines suffer from telluric overcorrection giving irregular lines. Again, the central dip is mostly comparable to the noise and a single peaked nature cannot be ruled out from this data set either. CRIRES has higher spectral resolution than NIRSPEC, and the C12 data have many high signal-to-noise lines. Hence, if present at the time of observation, the double peak should have been visible in this spectrum.
However, the C12 data set has been collected a decade later than the other two data sets, thus it is possible that the variability noted for this source in the NIR continuum and in the optical (Sitko et al.2008;
at University of St Andrews on May 6, 2016
http://mnras.oxfordjournals.org/
Figure 2. Comparison of the median line profiles from the C12 data (blue), the N01/02 data (red), and the N02b data (black). Ranges ofJ-levels used for the medians (co-addition) are indicated on the plots.
Ellerbroek et al.2014) plays a role. For these studies observations collected at several different epochs were used dating from 1979 until 2012. During this time, the NIR brightness was increased by more than 10 per cent (inH,K,L, andMband) in three epochs: 1986, 2001–2002, and 2011–2012. Each of the CO ro-vibrational data sets are collected during or shortly after one of these epochs (N01/02 in 2001–2002, N02b in 2002, and C12 in 2012). Hence the observed variations of the CO ro-vibrational line profiles are not directly linked to the increased NIR brightness epochs. Meanwhile, this does not exclude that one underlying mechanism could in fact be driving both the NIR variability and the CO ro-vibrational variability in different ways.
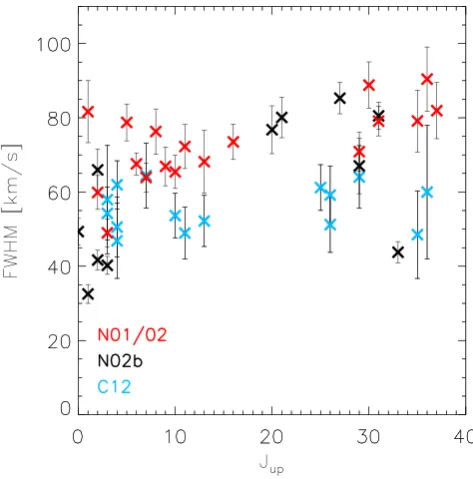
From all three data sets, we find broad emission lines (FWHM∼ 50–80 km s−1) suggesting that the CO ro-vibrational lines are emitted from the inner radius of the disc. However, the FWHM measured from the three sets are not in agreement. In Fig.3, we show the FWHM versusJupfor lines collected from all three data sets in the same manner. The FWHM variations can also be seen from the medians collected for high, mid, and lowJseparately, displayed in Fig.2and listed with FWHM in Table1. We see that lines from N01/02 are overall wider than those from C12. LowJ lines from N02b are narrower than both N01/02b and C12, but high Jlines from N02b are comparable in FWHM to N01/02. As dis-cussed above, the N02b data set has several irregular lines, which may be due to imperfect telluric corrections. Thus, for the further comparison we focus on the C12 and N01/02 data sets.
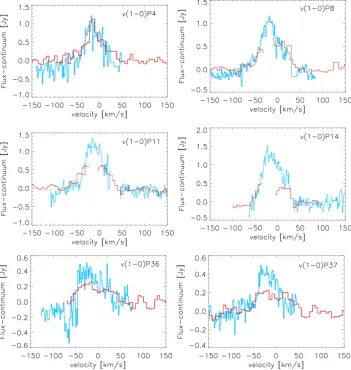
To explore in more details the differences between C12 and N01/02, we also compare flux calibrated line profiles for individual transitions that were present in both data sets (Fig.4). This shows that the general width and line wings of the individual line profiles are the same in the two data sets, while (in the case of high and mediumJlines) the intensity and the shape of the central part of the lines differ. For lowJ(the P4 line) the shape is well matched in the two data sets. An interpretation could be that the single peaked line profiles (i.e. lines from the CRIRES data and lowJlines from the NIRSPEC data) are composites of multiple emitting regions, where the main (Keplerian) components are the same in the two epochs and the additional component, present in lines from C12
Figure 3. FWHM versusJupfor all three samples. Lines collected from C12 are shown in blue, lines collected from N01/02 are shown in red, and lines from N02b are shown in black.
and in lowJlines from N01/02, could be related to the NIR vari-ability. This additional component would then ‘drive’ the FWHM in C12 to lower values, since the half-maximum location is shifted upwards.
4 C O M PA R I S O N W I T H A D I S C M O D E L
We use a previously published disc structure for HD 163296 pro-duced withPRODIMO(Model 3 from Tilling et al.2012), to model for the first time a sample of CO ro-vibrational lines. In the following sections (Sections 4.1 and 4.2), we first describe the model and then present how the model results compare to the observed lines.
at University of St Andrews on May 6, 2016
http://mnras.oxfordjournals.org/
[image:4.595.309.546.317.557.2]Table 1. Observing details, FWHM and errors from Gaussian fits. N01/02= NIRSPEC 2001/2002 (Salyk et al.2011), N02b=NIRSPEC 2002 (Brittain et al.2007), C12=CRIRES 2012 (B15).
Data set N01/02 N02b C12
Instrument NIRSPEC NIRSPEC CRIRES
Observing dates 06-08-2001 23-03-2002 06-03-2012 08-08-2001
21-04-2002 22-07-2002
R 25.000 25.000 100.000
Fcontat 4.770µm 12.1 Jy – 16.3 Jy
Observed lines J=1–37 J=1–33 J=0–36
FWHM [km s−1] [km s−1] [km s−1]
allJ 73.9±1.4 60.0±1.4 55.0±2.5
J<10 66.9±1.8 45.8±1.6 54.5±3.9
10<J<20 74.3±3.8 – 50.9±4.9
J>20 85.0±2.8 78.9±2.2 59.2±4.3
4.1 Model description
PRODIMO is a radiation thermo-chemical disc code (Woitke et al.
2009; Kamp et al. 2010), which solves the radiative transfer, the chemical network and the gas heating/cooling balance. The
Tilling et al. (2012) model assumes a parametrized disc structure using power laws for the surface density and the gas scaleheight. Level populations are calculated from statistical equilibrium and detailed line transfer calculations are performed to predict emis-sion lines. In order to model CO ro-vibrational emisemis-sion lines, we use the large CO ro-vibrational model described in Thi et al. (2013). We include fluorescence pumping to theA1 electronic level and use 40 rotational levels within seven vibrational levels of both the ground electronic state X1+ and the excited state A1.
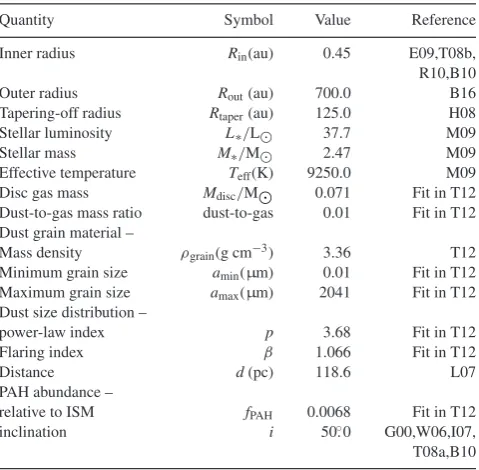
[image:5.595.119.471.334.705.2]The Tilling et al. (2012) model has been computed using a Monte Carlo evolutionaryχ2-minimization strategy (Woitke et al.2011), varying 11 parameters to find the best fit to observed emission lines (not including the CO ro-vibrational lines) and the dust SED, from HD 163296, simultaneously. The spatial CO interferometric data were not used as a constraint for the modelling, however, the extracted line profiles for the pure rotational CO lines (Isella et al. 2007) were used as a constraint for the radial extent and tapered edge. Key parameters used in the model are displayed in Table2. The gas volume density distribution, the gas temperature and the CO abundance are shown in Fig.5. In Table3, emission line predictions from the model are compared to the observed lines from the literature. Even though this model has not been made to fit CO ro-vibrational observations, we use it here to investigate the
Figure 4. Individual line profile comparisons of flux calibrated lines, that were present in both the C12 data (blue) and the N01/02 data (red). Line identifications are noted on the plots. A wide plotting range is chosen to show the typical noise on the continuum.
at University of St Andrews on May 6, 2016
http://mnras.oxfordjournals.org/
Table 2. Key model parameters adapted or fitted in T12 or adapted from other work: B10=Benisty et al. (2010), B16=this work, E09=Eisner et al. (2009), G00=Grady et al. (2000), H08=Hughes et al. (2008), I07= Isella et al. (2007), L07=van Leeuwen (2007), M09=Montesinos et al. (2009), R10=Renard et al. (2010), T08a=Tannirkulam et al. (2008b), T08b=Tannirkulam et al. (2008a), T12=Tilling et al. (2012), W06= Wassell et al. (2006). For more details see T12.
Quantity Symbol Value Reference
Inner radius Rin(au) 0.45 E09,T08b,
R10,B10
Outer radius Rout(au) 700.0 B16
Tapering-off radius Rtaper(au) 125.0 H08
Stellar luminosity L∗/L 37.7 M09
Stellar mass M∗/M 2.47 M09
Effective temperature Teff(K) 9250.0 M09
Disc gas mass Mdisc/M 0.071 Fit in T12
Dust-to-gas mass ratio dust-to-gas 0.01 Fit in T12 Dust grain material –
Mass density ρgrain(g cm−3) 3.36 T12
Minimum grain size amin(µm) 0.01 Fit in T12 Maximum grain size amax(µm) 2041 Fit in T12 Dust size distribution –
power-law index p 3.68 Fit in T12
Flaring index β 1.066 Fit in T12
Distance d(pc) 118.6 L07
PAH abundance –
relative to ISM fPAH 0.0068 Fit in T12
inclination i 50◦.0 G00,W06,I07,
T08a,B10
emitting region of CO ro-vibrational transitions and to compare with observations.
4.2 Line profile comparison
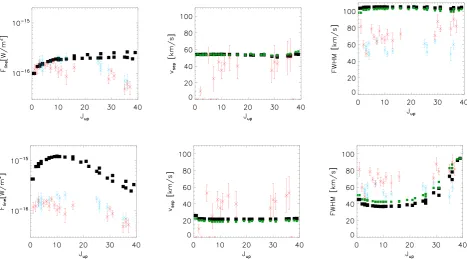
[image:6.595.47.287.131.366.2]We derive line flux, FWHM and peak separation from the modelled CO ro-vibrational line profiles. Line shapes in the disc model do not vary strongly withJ. The peak separations in the modelled lines are∼50 km s−1, and the NIRSPEC resolution could thus be good enough to separate the peaks, depending however on the size of the depression between the peaks. In the upper panels of Fig.6, the peak separation, the FWHM, and the line fluxes are shown
Table 3. CO line fluxes. The model line fluxes are computed from escape probability and highJrotational lines were observed with Herschel/PACS (Tilling et al.2012), lowJrotational lines were observed from the ground (Isella et al.2007), and the observed ro-vibrational line fluxes are from Salyk et al. (2011).
Mol. λ Obs. Model
(µm) (10−18W m−2) (10−18W m−2)
13COJ=1–0 2720.41 0.0124 0.0105
COJ=2–1 1300.4 0.379 0.40
COJ=3–2 866.96 1.65 1.21
COJ=18–17 144.78 <13.1 2.69
COJ=29–28 90.16 <11.1 0.624
COv=1–0 P37 5.053 60.3 122.
COv=1–0 P14 4.793 86.5. 71.3
COv=1–0 P4 4.700 158 70.8
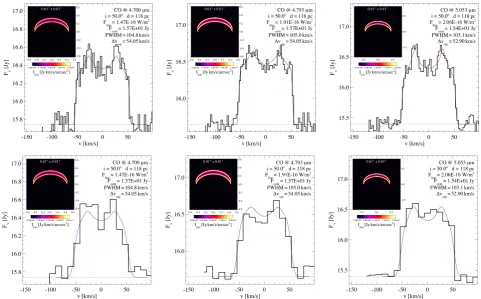
for selected line transitions (the observed line sample and a few extra lines to fill in gaps inJcoverage) from the model. The lower panels show these same plots with all transitions calculated in local thermodynamic equilibrium (LTE). For comparison we also show the observed peak separations, FWHM, and line flux. To obtain a more realistic comparison between model and observation, we add appropriate noise (S/N∼100 on the continuum) and convolve the model line profiles with the spectral resolution of the relevant instruments (CRIRES: 3 km s−1, NIRSPEC: 12 km s−1) to create simulated CRIRES and NIRSPEC line profiles from the modelled lines. The simulated line profiles made for three representative CO ro-vibrational transitions, v(1–0) P04, v(1–0) P14, and v(1–0) P37, are shown together with the original model line profiles in Fig.7. These three lines are chosen since they exemplify a lowJ, a midJ, and a highJline, and since they are detected in both observational data sets, N01/02 and C12.
The simulated CRIRES and NIRSPEC line profiles from the mod-els have full width at zero intensity (FWZI) around 110–120 km s−1 (measured by eye), similar to the observed FWZI (The FWZI of the lines is determined by the inner radius of the disc. In the model that is set to 0.45 au, while values derived from observations lie in the range 0.2–0.55 au (Tannirkulam et al.2008b; Eisner et al.2009; Benisty et al.2010; Renard et al.2010).). The FWHM values pre-dicted by the model are a factor 1.3 too wide compared to observed
Figure 5. Left-hand panel: gas volume density, together with contours showingAv=1.0 andAv=10.0 (dashed white lines), Av,rad=0.1, and Av,rad=1.0 (dashed red lines). Middle panel: gas temperature, together with contours showingAv=1.0 andAv=10.0 (white dashed lines), and gas temperature contours at 20, 40, 100, 300, and 1000 K (black dashed lines). Right-hand panel: CO abundance, together with contours showingAv=1.0 andAv=10.0 (dashed white lines) and log(χ/n)= −3 (dashed blue line).
at University of St Andrews on May 6, 2016
http://mnras.oxfordjournals.org/
[image:6.595.57.544.530.685.2]Figure 6. Upper panels: the line fluxes (left), the peak separations (middle), and the FWHM (right), as a function ofJupfor the modelled sample of CO fundamental ro-vibrational (black squares). The green squares are the model convolved with the NIRSPEC resolution (the model convolved with the CRIRES resolution corresponds very closely to the un-convolved model and is therefore not shown). Observations are shown for comparison as blue crosses (C12) and red crosses (N01/02). In addition to the displayed error bars for the observed lines, there is also an additional systematic error of 50 per cent for the C12 data and 20 per cent for the N01/02 data. This error has a similar effect on all lines, and thus do not affect line ratios. Bottom panels: the same plots with the lines calculated in LTE.
lines from N01/02 (Fig.6). The line fluxes predicted by the model match the observed lowJline fluxes (N01/02 and C12) but the high Jline fluxes are up to a factor 4 too faint and the overall shape of the line flux versusJcurve is different than what is observed. The LTE model captures the line flux versusJcurve shape much better but the line fluxes are almost a factor 10 too high.
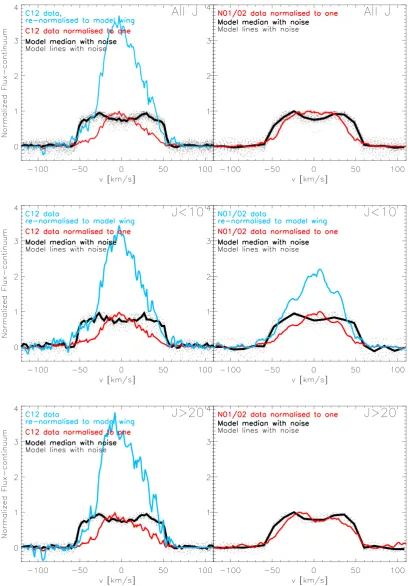
The model predicts clear double peaks for all lines (significant central depression between peaks), which is not seen for all lines in the observations. Since the CO ro-vibrational lines are not spa-tially resolved in observations the observed single peaks cannot be caused by emission at larger radii in the disc. Thus, the observed single peaks in both the CRIRES lines and the lowJNIRSPEC lines could indicate that lines from both N01/02 and C12 have a second non-Keplerian component, although much weaker in N01/02 than in C12. We do see indications of double peaks present in some observed lines (mostly high and midJlines from N01/02) and the peak separations measured from these are similar to the modelled lines. However, the absence of a strong double peak could also be due to many lines in the N01/02 sample suffering from low trans-mission at the centre of the line, due to strong telluric absorption lines (see Section 3). The highJtransitions are less likely to be sig-nificantly affected by telluric absorption and lend themselves better for a comparison to the models. In Fig.8, we show flux normalized medians from the simulated CRIRES line profiles and NIRSPEC line profiles from the model together with the corresponding ob-served (N01/02, C12) median line profiles. We show both medians made from allJtransitions and medians made from only high or lowJlines in the sample. We can confirm that the highJmedian from the N01/02 sample compares well to the model. Looking in particular at the line wings, the median created from all lines from N01/02 and the median created from highJlines from N01/02 look
similar. However, comparison of the medians from C12 and the low Jmedians from N01/02 reveals significant differences in the line wings. In these cases, the line profiles might be multiple component profiles with a non-Keplerian, central component. Thus, the direct comparison of medians from model and from observations, both normalized to unity, can be misleading, since the model contains only a disc component. We can obtain a match between the line wings of the observed C12 lines and the line wings of the simu-lated CRIRES line profiles from the model by re-normalizing the C12 median line profile to the wings of the model (multiplying the normalized C12, lowJmedian by 3.5, shown in blue). A similar match could also be achieved for the lowJmedian from N01/02 (multiplying the normalized N01/02 median by 2.2, shown in blue). The shape of a line profile is determined by how the flux builds up as a function of radius. In Fig.9, we show a radial profile of the cumulative line flux from the model. From the peak separa-tion of the highJlines from N01/02, we infer an outer radius for the emitting region of ∼2.1 ± 2.0 au, using the assumption of Keplerian rotation. In the model, 85 per cent of the emission builds up within∼1.5 au. Thus, the model provides a good prediction of the emitting region. In summary, provided there is a non-Keplerian additional component causing a central peak in the lines from C12 and in the lowJlines from N01/02, the model compares well to the observed CO ro-vibrational lines of HD 163296.
5 D I S C U S S I O N
5.1 Observed line profile comparison
N01/02 and C12 show clear differences in the line profile shapes that instrumental differences alone cannot explain. The single peaked
at University of St Andrews on May 6, 2016
http://mnras.oxfordjournals.org/
Figure 7. Modelled line profiles with and without convolution and noise. From left to right: v(1–0)P04, v(1–0)P14, and v(1–0)P37. The black lines in the upper three panels show the model line profiles convolved with the CRIRES resolution (R=100 000) and an applied signal-to-noise ratio of 100 on the continuum, while the un-convolved model line profiles are shown in red. The black lines in the lower three panels show the model line profiles convolved with the NIRSPEC resolution (R=25 000) and an applied signal-to-noise ratio of 100 on the continuum. The line wavelength, flux, FWHM, and peak separation of the (un-convolved) model are reported on the plot.
nature of the C12 lines points at variability in the lines as an expla-nation. Furthermore, a detailed thermo-chemical disc model pre-dicts double peaked line profiles which are only seen for highJ line profiles from N01/02. A possible explanation for single peaks could be that an additional non-Keplerian CO ro-vibrational emis-sion component is present in both N01/02 and C12, but that this component is weaker in N01/02, and hence mainly affecting lowJ lines here. The observed CO ro-vibrational emission is not spatially extended, hence, a Keplerian emission component from large radii in the disc cannot be invoked to explain the single peaked profiles. Comparing line fluxes, the overall shape or curvature in line flux versusJdiagram agrees well between N01/02 and C12, and the line flux values are also similar. Hence, the line fluxes alone do not indicate any kind of variability in the lines. However, the flux calibration, is rather uncertain, around 30 per cent for C12 and 20 per cent for N01/02, and thus the similarity in line fluxes does not necessarily exclude variability.
Spectra from multiple epochs were combined to obtain the N01/02 data set since no indication of variability between line profiles was detected beyond the noise. No independent flux cali-bration exists between the multiple epochs; the N01/02 data were neither obtained nor analysed with the intention to study vari-ability. The same is true for the C12 data. Hence, there is now a clear need for new systematically collected data to better un-derstand the variability of this source (we discuss this further in Section 5.3).
5.2 Model comparison
Considering the fact that this model was not set up to fit the CO ro-vibrational lines initially, this comparison provides a strong test. For highJlines from N01/02, the peak separations compare well and the FWHM are near the observed values. If all other observed lines are in fact affected by the presence of an additional non-Keplerian component (that is not included in the model), the FWHM or peak separation of the remaining observed lines cannot be expected to match the Keplerian lines of the model.
The individual line fluxes predicted by the model are similar to the observed values up toJ∼26. The modelled highJlines fluxes deviate by up to a factor 4 from the observed ones. The overall shape of the flux versusJdiagram is not well fitted by the model. The modelled lines calculated in LTE give a much better shape predic-tion for the flux versusJdiagram, but the line fluxes are in this case almost a factor of 10 too high, a difference that cannot be explained by flux calibration uncertainties (C12, 30 per cent systematic flux calibration uncertainty, N01/02, 20 per cent systematic flux cali-bration uncertainty). The difference in line strength between the (non-LTE) model and observations may point to a different vertical structure in the inner disc model and/or the excitation of the lines (thermal and fluorescent). However, the difference in flux versusJ curvature could arise from an additional non-Keplerian component that is more pronounced at lowJcompared to highJlines (also responsible for the single peak/flat topped difference between high and lowJlines); this is not captured in the current model.
at University of St Andrews on May 6, 2016
http://mnras.oxfordjournals.org/
Figure 8. Upper panels: individual normalized modelled line profiles (dotted black lines) and their medians (thick black) with an applied signal-to-noise ratio of 100 (on the continuum) and the spectral resolution of CRIRES (left) or NIRSPEC (right). For comparison, the observed line profile median is overplotted in thick red (left: C12, right: N01/02). Medians created using only the lowJlines (J<10) shown in the middle panels, and medians created using only the high Jlines (J>20) shown in the lower panels. For the C12 medians and the lowJN01/02 median, we additionally overplot the observed medians re-normalized instead to the line wings of the model median (thick blue) to evaluate the presence of an additional non-Keplerian component causing the central peaks.
at University of St Andrews on May 6, 2016
http://mnras.oxfordjournals.org/
Figure 9. Line and continuum optical depth, the cumulative line flux, and the CO density, as a function of radius, for the three modelled lines v(1–0)P04, v(1–0)P14, and v(1–0)P37. The line wavelengths and fluxes from simple vertical escape probability are indicated on the plot. Vertical dashed lines indicate the radii within which 15 per cent and 85 per cent of the total flux is emitted, the black box indicates the radial and vertical region from which 50 per cent of the flux originates, and the red contour lines represent gas temperatures of 100 and 300 K.
5.3 Variability of the CO ro-vibrational lines
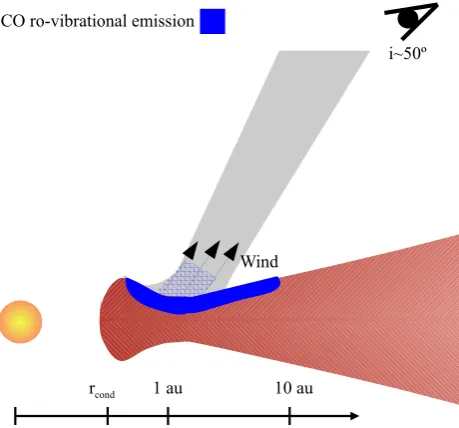
The variability of HD 163296 is documented in the literature (Sitko et al.2008; Ellerbroek et al.2014). Ellerbroek et al. (2014) suggest a scenario where dust clouds are launched above the disc plane and cross the observers line of sight. Klaassen et al. (2013) detected a rotating molecular disc wind from HD 163296 using ALMA. The authors interpret this as a low velocity wind (<25 km s−1) launched at a few au. Bast et al. (2011) find that broad single peaked CO ro-vibrational profiles observed towards T Tauri stars can be ex-plained by the presence of a wind. Hence, this disc wind detected from HD 163296 could be responsible for the non-Keplerian com-ponent that we suggest (velocities±30 km s−1). I.e. a low velocity molecular outflow containing CO, could emit CO ro-vibrational emission as it is launched above the usual disc emitting region, similar to what Garcia Lopez et al. (2015) suggested for the Brγ line. Instabilities in the inner disc could lead to episodic disc winds of varying strength resulting in e.g. stronger non-Keplerian com-ponents present in the C12 data compared to the N01/02 data. A wind component to the lines would be expected to show blue shifted profiles (e.g. Alexander2008; Pascucci & Sterzik2009; Pascucci et al.2014), consistent with the blue-shifted peak that we see in most of the velocity profiles from C12 (see Fig.1). Fig.10shows a schematic view of the combined geometry of the disc, the wind and the CO ro-vibrational emission. Pontoppidan, Blake & Smette (2011) showed with their wind model that if the line of sight falls close to the angle of the wind column, self-absorption can occur in the line profile. The fact that no CO ro-vibrational self-absorption is detected in lines from either N01/02 or C12, puts strong constraints on the wind model. With the disc inclination of 50◦the wind column has to be launched at minimum 60◦–70◦(with respect to the disc plane), almost vertically from the disc. Pontoppidan et al. (2011) showed with his wind model that if the disc wind is viewed close to face on, no self-absorption will be seen (fig. 12 in Pontoppidan et al.2011). If the wind column is at lower inclinations, crossing the line of sight of the observer, the CO gas has to have either no sharp temperature gradient (colder gas would cause absorption), or the CO would have to dissociate before it can significantly cool.
New observations of the CO ro-vibrational lines from HD 163296 collected with either NIRSPEC/Keck or CRIRES/VLT, that con-tribute additional epochs to the line profile comparisons, are
neces-Figure 10. Sketch of the geometry of HD 163296 and the disc wind and how this could relate to the variability of the CO ro-vibrational lines (in-spired by Ellerbroek et al.2014). The blue areas indicate the possible CO vibrational emission regions. The hatched blue area indicates CO ro-vibrational emission from the wind just above the disc.
sary in order to clarify the cause for variability. New observations from one of these instruments would also allow a cleaner line pro-file comparison of lines from only one instrument, removing all instrumental differences leaving just the differences caused by true variability. Since the comparison of the four separate data sets used in Salyk et al. (2011) does not suggest any significant variations within a year, a preferred follow up programme would be a long term monitoring collecting CO ro-vibrational data from HD163296 e.g. once per year. It would furthermore be crucial to have simul-taneously collected continuum data, in order to match possible CO ro-vibrational line variations to continuum variations, and better understand the physical connection between gas and dust. Given the difficulties with the NIR observational window, observations of Neon fine structure lines ([Ne II] at 12.81 µm and [Ne III]
at University of St Andrews on May 6, 2016
http://mnras.oxfordjournals.org/
[image:10.595.314.544.294.508.2]at 15.55 µm) could be an alternative. Baldovin-Saavedra et al. (2012) detected and spectrally resolved the [NeII] in seven stars using VLT/VLT Imager and Spectrometer for mid Infrared (VISIR), where one was the first detection of [NeII] from a HAeBe star (V892 Tau). The [NeII] lines are complementary to the CO ro-vibrational lines since they probe vertical heights above the molecular layer over a range of radial distances (out to 10–15 au; Glassgold, Najita & Igea2007). Hence, if a molecular outflow is causing variable non-Keplerian CO ro-vibrational emission components, the variability could also be detectable in the [NeII] line.
TheM-band magnitude for HD163296 seen in the N01/02 data is close to the brightest state reported (de Winter et al. 2001), while that seen in the C12 data is∼0.4 mag brighter than the brightest state. In theLband the amplitude of the variability does not exceed 0.2–0.3 mag (Ellerbroek et al.2014). Hence, a 0.4 mag increase in theM band, compared to the brightest state is unlikely and it is more likely that the flux calibration of C12 is inaccurate (uncertainty closer to 50 per cent). With this, one could envision an alternative scenario for the line profile variability where the continuum flux from the N01/02 data is stronger than that from the C12 data. In that case the peak line flux from the two data sets might match, and the line variability would be caused by a broad wing component dominant in the N01/02 data, in particular for high and mediumJlines. Such an additional component could be caused by episodic accretion on to the disc (seen in the case of T Tauri stars). The enhanced accretion creates funnel flows seen as broad double peaked lines (Najita, Carr & Mathieu2003).
Variable accretion has in fact been noted by Mendigut´ıa et al. (2013) for HD 163296. From their comparison with previous results they found that the accretion rate of HD 163296 is more or less constant on time-scales of days to months. However, the accretion rate derived using data from 2011 to 2012, was found to have increased by more than 1 dex over a timespan of 15 yr. Thus, the C12 data set was collected during a high accretion rate period, and should thereby be displaying this additional line wing component. Yet, opposite to what we would expect from the high accretion rate, the lines from the C12 data are narrower than lines from the earlier epoch, N01/02. Hence, an additional line component due to episodic accretion does not offer a meaningful explanation to the observed line variability.
6 C O N C L U S I O N S
We compared for the first time CO ro-vibrational lines from high-resolution NIR spectra for HD 163296, collected at different epochs (2002, 2012) with different instruments (NIRSPEC/Keck, CRIRES/VLT), separated by∼10 yr. We find significant differences in line shapes. In particular, double peaks are only present in one epoch, and mainly in highJtransitions. FWHM measurements are significantly wider in the 2002 epoch. Comparison of flux calibrated lines indicates that line wings could be similar at the two epochs and an additional component at lower velocities likely causes the FWHM difference and the peak differences. However, the reliabil-ity of the flux calibration is limited (errors of∼50 per cent for C12 and∼20 per cent for N01/02).
We use an existing disc model (Tilling et al.2012) to derive mod-elled CO ro-vibrational lines for HD 163296. The model provides good predictions of the peak separation of the high Jlines from N01/02, and good predictions for the line fluxes of the low and mid Jlines (from both N01/02 and C12). For all observed lines from C12 and the lowerJlines from N01/02, the peak separation (predicted by the model) is not seen (single peaks or ambiguous flat tops), and
the modelled FWHM are a factor 1.7 larger than in C12 and a factor 1.3 larger than in N01/02.
We propose that an additional non-Keplerian component of the CO ro-vibrational emission is present in the C12 data set. In the epoch of the N01/02 lines, the non-Keplerian component is also present, but significantly weaker. The line flux contribution of the proposed non-Keplerian component decreases withJfor both data sets, and is thus only detectable for lowJlines in the N01/02 data set. This would explain why the model underestimates FWHM, and peak separation, for low and midJlines. The suggested non-Keplerian component in the observed lines, seem to be present at similar velocities in all cases (±30) and not detectable at highJin N01/02. We suggest that this non-Keplerian component could be due to the molecular disc wind detected by Klaassen et al. (2013). Further observations are necessary to confirm the nature of the vari-ability seen for these lines (with CRIRES/VLT or NIRSPEC/Keck) and the presence of a variable disc wind component. The latter could be done with or VISIR/VLT observations of the [NeII] line.
AC K N OW L E D G E M E N T S
The present paper is completed based on observations made with ESO Telescopes at the La Silla Paranal Observatory under pro-gramme ID 088.C-0898A. The authors thank S. Brittain and C. Salyk, for providing the additional CO ro-vibrational data sets used in this paper and for helpful comments and suggestions. IK, WFT, and PW acknowledge funding from the EU FP7-2011 under Grant Agreement no. 284405.
R E F E R E N C E S
Alexander R. D., 2008, MNRAS, 391, L64
Baldovin-Saavedra C., Audard M., Carmona A., G¨udel M., Briggs K., Rebull L. M., Skinner S. L., Ercolano B., 2012, A&A, 543, A30
Bast J. E., Brown J. M., Herczeg G. J., van Dishoeck E. F., Pontoppidan K. M., 2011, A&A, 527, A119
Benisty M., Tatulli E., M´enard F., Swain M. R., 2010, A&A, 511, A75 Blake G. A., Boogert A. C. A., 2004, ApJ, 606, L73
Brittain S. D., Simon T., Najita J. R., Rettig T. W., 2007, ApJ, 659, 685 Brittain S. D., Najita J. R., Carr J. S., 2009, ApJ, 702, 85
Brown J. M., Pontoppidan K. M., van Dishoeck E. F., Herczeg G. J., Blake G. A., Smette A., 2013, ApJ, 770, 94
de Gregorio-Monsalvo I. et al., 2013, A&A, 557, A133
Dominik C., Dullemond C. P., Waters L. B. F. M., Walch S., 2003, A&A, 398, 607
Eisner J. A., Graham J. R., Akeson R. L., Najita J., 2009, ApJ, 692, 309 Ellerbroek L. E. et al., 2014, A&A, 563, A87
Garcia Lopez R., Tambovtseva L. V., Schertl D., Grinin V. P., Hofmann K.-H., Weigelt G., Caratti o Garatti A., 2015, A&A, 576, A84 Glassgold A. E., Najita J. R., Igea J., 2007, ApJ, 656, 515 Grady C. A. et al., 2000, ApJ, 544, 895
Gray R. O., Corbally C. J., 1998, AJ, 116, 2530
Hughes A. M., Wilner D. J., Qi C., Hogerheijde M. R., 2008, ApJ, 678, 1119 Isella A., Testi L., Natta A., Neri R., Wilner D., Qi C., 2007, A&A, 469, 213 Kaeufl H.-U. et al., 2004, in Moorwood A. F. M., Iye M., eds, Proc. SPIE Conf. Ser. Vol. 5492, Ground-based Instrumentation for Astronomy. SPIE, Bellingham, p. 1218
Kamp I., Tilling I., Woitke P., Thi W., Hogerheijde M., 2010, A&A, 510, A260000
Klaassen P. D. et al., 2013, A&A, 555, A73
McLean I. S. et al., 1998, in Fowler A. M., ed., Proc. SPIE Conf. Ser. Vol. 3354, Infrared Astronomical Instrumentation. SPIE, Bellingham, p. 566
Meeus G., Waters L. B. F. M., Bouwman J., van den Ancker M. E., Waelkens C., Malfait K., 2001, A&A, 365, 476
at University of St Andrews on May 6, 2016
http://mnras.oxfordjournals.org/
Mendigut´ıa I. et al., 2013, ApJ, 776, 44
Montesinos B., Eiroa C., Mora A., Mer´ın B., 2009, A&A, 495, 901 Najita J., Carr J. S., Mathieu R. D., 2003, ApJ, 589, 931
Natta A., Prusti T., Neri R., Wooden D., Grinin V. P., Mannings V., 2001, A&A, 371, 186
Pascucci I., Sterzik M., 2009, ApJ, 702, 724
Pascucci I., Ricci L., Gorti U., Hollenbach D., Hendler N. P., Brooks K. J., Contreras Y., 2014, ApJ, 795, 1
Pontoppidan K. M., Blake G. A., Smette A., 2011, ApJ, 733, 84
Renard S., Malbet F., Benisty M., Thi´ebaut E., Berger J.-P., 2010, A&A, 519, A26
Rosenfeld K. A., Andrews S. M., Wilner D. J., Kastner J. H., McClure M. K., 2013, ApJ, 775, 136
Salyk C., Blake G. A., Boogert A. C. A., Brown J. M., 2009, ApJ, 699, 330 Salyk C., Blake G. A., Boogert A. C. A., Brown J. M., 2011, ApJ, 743, 112 Sitko M. L. et al., 2008, ApJ, 678, 1070
Tannirkulam A. et al., 2008a, ApJ, 677, L51 Tannirkulam A. et al., 2008b, ApJ, 689, 513
Thi W. F., Kamp I., Woitke P., van der Plas G., Bertelsen R., Wiesenfeld L., 2013, A&A, 551, A49
Tilling I. et al., 2012, A&A, 538, A20
van der Plas G., van den Ancker M. E., Waters L. B. F. M., Dominik C., 2015, A&A, 574, A75
van Leeuwen F., 2007, A&A, 474, 653
Wassell E. J., Grady C. A., Woodgate B., Kimble R. A., Bruhweiler F. C., 2006, ApJ, 650, 985
Wisniewski J. P., Clampin M., Grady C. A., Ardila D. R., Ford H. C., Golimowski D. A., Illingworth G. D., Krist J. E., 2008, ApJ, 682, 548 Woitke P., Kamp I., Thi W.-F., 2009, A&A, 501, 383
Woitke P. et al., 2011, A&A, 534, A44
This paper has been typeset from a TEX/LATEX file prepared by the author.
at University of St Andrews on May 6, 2016
http://mnras.oxfordjournals.org/