A COMPARATIVE STUDY TO ANALYZE THE EFFECT OF BODY WEIGHT SUPPORT TREADMILL
TRAINING VERSUS WITHOUT BODY WEIGHT SUPPORT TREADMILL TRAINING FOR
GAIT IN POST STROKE PATIENTS
*Dr. Preet Thakor
Shree B G Patel College of Physiotherapy
ARTICLE INFO ABSTRACT
Background:
provides the opportunity to complete more walking practice than would be possible using assisted over ground walking. Body weight support treadmill training (BWSTT) “uses ov
system and harness to support a percentage of the patient’s body weight as the patient walks on a treadmill”, thereby removing weight symmetrically from the lower extremities.20 The performance of complete gait movements on a treadmill wi
approach could restore the gait of non therapists.
index.
(experimental group) (n=15), Group B (control group) (n=15). Study duration 3 times per week for 4 weeks.
Copyright©2019, Preet Thakor and Manoj Kumar. This unrestricted use, distribution, and reproduction in any medium,
INTRODUCTION
Stroke is defined by WHO as rapidly developing clinical signs of focal or global disturbances of cerebral function, with symptoms lasting more than 24 hours or leading to death with no apparent non-vascular cause (Ashrafian
acute onset of neurological dysfunction due to an abnormality in cerebral circulation with resultant signs and symptoms that correspond to involvement of focal areas of brain
1996). Clinically a variety of deficits are possible, including changes in the level of consciousness, and impairments of sensory, motor, cognitive, perceptual, and language functions. Motor deficits are characterized by paralysis (hemiplegia) or weakness (hemiparesis), typically on the side of the body opposite the side of the lesion. The term Hemiplegia is often used generically to refer to the wide variety of problems that result from stroke (Margit, 2011). Stroke is the third major leading cause of death & disability in many countries of the world4. Mortality due to stroke is 5.5 million in the world and those who survive stroke each year worldwide is est
be 15 million4,5. Stoke is a major health problem in india
(Cardiovascular diseases, 2003). Hemiparetic gait is
characterized by slow and asymmetric steps with poor selective motor control, delayed and disrupted equilibrium reactions and reduced weight bearing on the paretic limb. Smooth and symmetric forward progression of the body is impaired with a large variation in gait patterns related to the
ISSN: 0975-833X
Article History:
Received 12th June, 2019
Received in revised form
18th July, 2019
Accepted 16th August, 2019
Published online 30st September, 2019
Citation: Dr. Preet Thakor and Dr. Manoj Kumar, 2019.
body weight support treadmill training for improving gait in post stroke
Key Word:
There was significant Improvement seen in Group A.
*Corresponding author: Dr. Preet Thakor
RESEARCH ARTICLE
A COMPARATIVE STUDY TO ANALYZE THE EFFECT OF BODY WEIGHT SUPPORT TREADMILL
TRAINING VERSUS WITHOUT BODY WEIGHT SUPPORT TREADMILL TRAINING FOR
GAIT IN POST STROKE PATIENTS
Dr. Preet Thakor and Dr. Manoj Kumar
Shree B G Patel College of Physiotherapy, Sardar Patel university, Anand
ABSTRACT
Background: For non-ambulatory stroke patients, treadmill walking with partial weight support provides the opportunity to complete more walking practice than would be possible using assisted over ground walking. Body weight support treadmill training (BWSTT) “uses ov
system and harness to support a percentage of the patient’s body weight as the patient walks on a treadmill”, thereby removing weight symmetrically from the lower extremities.20 The performance of complete gait movements on a treadmill with partial body weight support as a task
approach could restore the gait of non-ambulatory patients faster and with less effort for the therapists. Outcome measure: Step length, stride length, cadence, 10 meter walk test, dynamic gait index. Method: SUBJECTS: 30 diagnosed with stroke and divided in two groups: Group A (experimental group) (n=15), Group B (control group) (n=15). Study duration 3 times per week for 4 weeks. Results: Results showed that Group A showed more significant improvement than
This is an open access article distributed under the Creative Commons medium, provided the original work is properly cited.
Stroke is defined by WHO as rapidly developing clinical signs or global disturbances of cerebral function, with symptoms lasting more than 24 hours or leading to death with Ashrafian, 2010). It is an acute onset of neurological dysfunction due to an abnormality with resultant signs and symptoms that correspond to involvement of focal areas of brain (Thompson, Clinically a variety of deficits are possible, including changes in the level of consciousness, and impairments of tual, and language functions. Motor deficits are characterized by paralysis (hemiplegia) or weakness (hemiparesis), typically on the side of the body opposite the side of the lesion. The term Hemiplegia is often y of problems that Stroke is the third major leading cause of death & disability in many countries of the . Mortality due to stroke is 5.5 million in the world and those who survive stroke each year worldwide is estimated to . Stoke is a major health problem in india Hemiparetic gait is characterized by slow and asymmetric steps with poor selective motor control, delayed and disrupted equilibrium weight bearing on the paretic limb. Smooth and symmetric forward progression of the body is impaired with a large variation in gait patterns related to the
degree of recovery. Well-controlled intra coordination is replaced by mass
(synergies) on the paretic side requiring compensatory adjustments of the pelvis and non
yavuza, 2006). Stretch, stroking superficial and deep pressure and weight bearing with approximation can a
therapy to increase sensory output. motor imagery, use of a
mirror, mental practice, electromyographic (EMG)
biofeedback, robot-assisted therapy, functional vibratory stimulation, acupuncture and electrical stimulation techniques are used for muscle re-education and facilitation to re
voluntary control of body positions and movements after stroke (Melek junes yavuza, 2006).
emphasis on functional/task specific training using intense practice of functional tasks along with behavioural shaping and environmental enrichment locomotor training using body weight support and treadmill training [BWSTT])
2007). Compensatory training strategies are also used in some circumstances to promote resumptio
involved extremities. These are indicated for patients who demonstrate severe motor impairment and limited recovery. Motor learning strategies provide a common base for all functional training (Susan B.
treadmill training (BWSTT) “uses overhead suspension system and harness to support a percentage of the patient’s body weight as the patient walks on a treadmill”, thereby removing
International Journal of Current Research Vol. 11, Issue, 09, pp.6805-6813, September, 2019
DOI: https://doi.org/10.24941/ijcr.36338.09.2019
2019. “A comparative study to analyze the effect of body weight support treadmill training versus without
body weight support treadmill training for improving gait in post stroke patients”, International Journal of Current Research
A COMPARATIVE STUDY TO ANALYZE THE EFFECT OF BODY WEIGHT SUPPORT TREADMILL
TRAINING VERSUS WITHOUT BODY WEIGHT SUPPORT TREADMILL TRAINING FOR IMPROVING
Anand,
Gujarat, India
ambulatory stroke patients, treadmill walking with partial weight support provides the opportunity to complete more walking practice than would be possible using assisted over ground walking. Body weight support treadmill training (BWSTT) “uses overhead suspension system and harness to support a percentage of the patient’s body weight as the patient walks on a treadmill”, thereby removing weight symmetrically from the lower extremities.20 The performance th partial body weight support as a task-oriented ambulatory patients faster and with less effort for the Step length, stride length, cadence, 10 meter walk test, dynamic gait SUBJECTS: 30 diagnosed with stroke and divided in two groups: Group A (experimental group) (n=15), Group B (control group) (n=15). Study duration 3 times per week for 4 Results showed that Group A showed more significant improvement than Group B.
Commons Attribution License, which permits
controlled intra-limb and inter-limb coordination is replaced by mass limb movement patterns (synergies) on the paretic side requiring compensatory adjustments of the pelvis and non-paretic side (Melek junes Stretch, stroking superficial and deep pressure and weight bearing with approximation can all be used during therapy to increase sensory output. motor imagery, use of a
mirror, mental practice, electromyographic (EMG)
assisted therapy, functional vibratory stimulation, acupuncture and electrical stimulation techniques education and facilitation to re-establish voluntary control of body positions and movements after , 2006). Currently there is increased emphasis on functional/task specific training using intense onal tasks along with behavioural shaping and environmental enrichment locomotor training using body weight support and treadmill training [BWSTT]), (Susan B., Compensatory training strategies are also used in some circumstances to promote resumption of function using the less involved extremities. These are indicated for patients who demonstrate severe motor impairment and limited recovery. Motor learning strategies provide a common base for all Susan B., 2007). Body weight support treadmill training (BWSTT) “uses overhead suspension system and harness to support a percentage of the patient’s body weight as the patient walks on a treadmill”, thereby removing
INTERNATIONAL JOURNAL OF CURRENT RESEARCH
A comparative study to analyze the effect of body weight support treadmill training versus without
weight symmetrically from the lower extremities (Lisa Taipalus, 2011)
The advantages to using BWSTT
It is a dynamic task specific repetitive activity5,6,
incorporating weight bearing, stepping and balance.
It allows for early ambulation1 and can discourage
compensatory gait patterns from developing.
Practice gait as a whole task.
Can be used for cardiovascular training, as the
harness provides a safety measure for fall risk (Lisa Taipalus, 2011)
Study
To compare treadmill training with partial body weight support to without body weight support treadmill training for improving gait in post-stroke patients.
Objectives of the study
1. To measure the effect of treadmill training with partial body weight support to without body weight support treadmill training on step length in post-stroke patients.
2. To measure the effect of treadmill training with partial body weight support to without body weight support treadmill training on stride length in post-stroke patients.
3. To measure the effect of treadmill training with partial body weight support to without body weight support treadmill training on cadence in post-stroke patients. 4. To measure the effect of treadmill training with partial
body weight support to without body weight support treadmill training on parameters of 10meter walk test in post-stroke patients.
5. To measure the effect of treadmill training with partial body weight support to without body weight support treadmill training on parameters of dynamic gait index in post-stroke patients.
Proposed Hypothesis
Null hypothesis (Ho): There will not be significant effect of
treadmill training with partial body weight support to without body weight support treadmill training for improving gait in post-stroke patients.
Alternate hypothesis (Ha): There will be significant effect of
treadmill training with partial body weight support to without body weight support treadmill training for improving gait in post-stroke patients.
Review of Literature
Toshifumi Takao et al. (2015) conducted a study to
improvement of gait ability with a short-term intensive gait rehabilitation program using body weight support treadmill training in community dwelling chronic post stroke survivors. Eighteen subjects participated in this study. The treatment group was composed of 10 subjects (2 women; 8 men; mean age, 59.1 ± 12.5 years; time since stroke onset, 35.3 ± 33.2 months), whereas the control group was made up of 8 subjects (3 women; 5 men; mean age, 59.8 ± 6.3 years; time since
stroke onset, 39.3 ± 27.3 months). The treatment group received BWSTT 3 times a week for 4 weeks (a total of 12 times), with each session lasting 20 minutes. These results suggested that short-term intensive gait rehabilitation using BWSTT was useful for improving gait ability among community dwelling post stroke subjects (Toshifumi Takao,
2015). Jan Mehrholz et al. (2014) conducted study Treadmill
training and body weight support for walking after stroke. They reported that people after stroke can perform up to 1000 steps in a 20-minute treadmill training session, compared with only 50 to 100 steps during a 20-minute session of conventional physiotherapy (neurophysiological approach). The speed of the treadmill, the amount of body weight support and the amount of assistance provided by the physiotherapist can all be adjusted in order to provide a sufficient training intensity. The results of this review were conclusive in part. Overall, people after stroke who receive treadmill training with or without body weight support are not more likely to improve their ability to walk independently, but their speed of walking and their walking capacity may improve. More specifically, people after stroke who are able to walk independently (but not those who are unable to walk independently) seem to benefit from this type of intervention (Jan Mehrholz, 2014). Klaske Van Kammen et al. (2014) conducted study The Combined Effects of Body Weight Support and Gait Speed on Gait Related Muscle Activity: A Comparison between Walking in the Lokomat Exoskeleton and Regular Treadmill Walking. Ten healthy participants walked on a treadmill and in the Lokomat, with varying levels of BWS (0% and 50% of the participants’ body weight) and gait speed (0.8, 1.8, and 2.8 km/h), while temporal step characteristics and muscle activity from Erector Spinae, Gluteus Medius, Vastus Lateralis, Biceps Femoris, Gastrocnemius Medialis, and Tibialis Anterior muscles were recorded. The temporal structure of the stepping pattern was altered when participants walked in the Lokomat or when BWS was provided (i.e. the relative duration of the double support phase was reduced, and the single support phase prolonged), but these differences normalized as gait speed increased (Klaske Van Kammen, 2014)
Diana Veneri (2012) conducted study Does Combining Body Weight Support Treadmill Training with Thera-Band Improve Hemiparetic Gait? The purpose of this case was to explore the use of Thera-Band Elastic Band in combination with body weight support treadmill training during locomotor training of a person with chronic stroke. The locomotor training protocol consisted of thirty minutes of training at ten-minute intervals with five-minute rest periods in between, three times per week for a total of ten weeks. Outcome measures included fast gait speed, spatiotemporal variables of gait, endurance and strength of ankle eversion. All 90 training trials were completed. GAITRite data demonstrated a more symmetrical gait pattern, with a more equal step length and stance time when comparing the left and right limbs, and an increased stride length bilaterally (Veneri, 2012).
Pamela W. Duncan et al. (2011) conducted a study
sessions of 90 minutes each for 12 to 16 weeks. Results shown that all groups had similar improvements in walking speed,
motor recovery, balance, functional status, and quality of life.13
MATERIAL AND METHODS
Study setting- The subjects are taken from Shree B. G. Patel
college of physiotherapy, Anand.
Method of collection data
Sampling method Convenience sampling
Type of the study Pre and post experimental study
Proposed sample size 30 (15 in each group)
Inclusion criteria
Age between 50 and 85 years of age.
Are diagnosed clinically with hemiparesis or
hemiplegia.
Are non-ambulatory defined as scoring 0 or 1 on the
Motor Assessment Scale for stroke.
It had been their first stroke.
More than 6 months had passed since the stroke onset.
They had slight-to-moderate motor deficits (stages III
to V of the Brunnstrom recovery stages (i.e., BRS).
They could walk with or without walking aids
(ambulation score of functional independence measure (i.e., FIM > 4).
Exclusion Criteria
Walked with a normal gait pattern
Severe cardiac problems
Treadmill training contraindicated because of existing
comorbid condition Cerebellar, bilateral, or brain stem CVA
Unable to understand simple commands because of
language, cognitive, behavioral, or psychiatric disorder
Readmitted during study period
Not ambulating before stroke
Have severe cognitive and/or language deficits which
preclude them from following instructions in training sessions
Have unstable cardiac status which would preclude participation in a rehabilitation program.
Have any pre-morbid history of orthopaedic
conditions of the lower limbs which would preclude them from.
Have clinically evident brainstem signs.
A higher brain function disorder or cognitive deficit
affecting their ability to understand and describe symptoms (< 24 on Mini-Mental State Examination).
A severe heart disorder affecting gait movement
intensity, or
A severe bone and joint disease affecting gait
movement.
Materials Used in Study
Assessment charts
Pencil
Papers
Full body weight harness
Treadmill
Traction
Measure tape
Weighing machine
Outcome Measures
10-meter walk
Dynamic gait index
Step length
Stride length and Cadence
Procedure
15 subjects diagnosed with stroke on the basis of clinical examination and referred from neurophysician OPD, and 15 diagnosed with stroke was recruited for the study. Subjects was select on the basis of inclusion and exclusion criteria. Detailed assessment of patients with diagnostic tests for stroke was taken. All subjects were provided written informed consent. Demographic data, including age, time since onset of stroke, affected side, and paralysis grade of the lower extremity according to BRS, was collect for all subjects (Visintin, 1998). The experimental group received gait training on a treadmill while an overhead harness supported a percentage of their body weight. The control group received gait training on treadmill without overhead harness while bearing full weight on their lower extremities (Visintin, 1998). The harness vertically supports the subject over the treadmill and is attached to a suspension system with a force transducer that signals the amount of body weight support will be given by the traction (Visintin, 1998). Individuals in the BWS group was provide up to 40% BWS at the beginning of training, and the percentage of BWS was progressively decrease as the subject’s gait pattern and ability to walk improve (Visintin, 1998). Individuals in the BWS group was provide percentage of BWS is depend on the individuals’ capacity it varies with the individuals (Visintin, 1998). Both groups received gait training for 4 weeks at a frequency of three times per week.
During each session the patients will allow to walk for a maximum of three trials and for a total duration not exceeding 15 minutes (Toshifumi Takao, 2015). The main outcome measures were Step length, Stride length, Cadence. The time in a 10-meter Walk on the floor at maximum effort was record for assessment of gait speed. And Dynamic Gait Index for the measured the function of an individuals. The outcome measures was taken before start the study and after completion of 4 weeks (Toshifumi Takao, 2015). The subject’s pulse rate, blood pressure and respiratory rate was monitored before initiation of each session and again after each trial to ensure that it not surpass a baseline established by the physician (Toshifumi Takao, 2015). The main outcome measures were Step length, Stride length, Cadence. The time in a 10-meter Walk on the floor at maximum effort was record for assessment of gait speed. And Dynamic Gait Index for the measured the function of an individuals. The outcome measures was taken before start the study and after completion of 4 weeks (Toshifumi Takao, 2015).
Data Analysis: This study was aimed to compare treadmill
weight support treadmill training for improving gait in post-stroke patients. Paired t-test was used to compare pre and post data of experimental group (within group). Paired t-test was used to compare pre and post data of control group (within group). Unpaired t-test was used for between group comparisons. Each calculated P value was compared with table value to test hypothesis at 0.05(5%) level of significance.
RESULTS
[image:4.595.314.552.86.147.2]Here paired t-test was used. Mean value of pre (RT) and (LT) step length for Group A was 28.33 and 30 respectively, and post value of (RT) and (LT) step length for Group A was 40.46 and 41.46 respectively. And SD of pre value of (RT) and (LT) step length for Group A was 5.1 and 5.27, and post value of (RT) and (LT) step length for Group A was 3.98 and 3.68 respectively. And t-value for (RT) and (LT) was 8.5 and 6.31 respectively with p-value <0.0001.Which shows statistically extremely significant.
Table 1. Shows Group A pre and post Mean and SD of step length
Group A(Experimental group) Step length
pre post pre post t- value p-value
(RT) (RT) (LT) (LT) < 0.0001
MEAN 28.33 40.46 30 41.46 rt=8.5
[image:4.595.341.525.291.345.2]SD 5.1 3.98 5.27 3.68 lt=6.31
Table 2. Shows Group B pre and post Mean and SD of step length
Group B(Control group) Step length
pre post pre post t- value p-value
(RT) (RT) (LT) (LT) < 0.0001
MEAN 25.93 28.93 26.06 28.4 rt=9.26
SD 4.43 4.44 3.85 3.75 lt=11
[image:4.595.38.288.316.379.2]Here paired t-test was used. Mean value of pre (RT) and (LT) step length for Group B was 25.93and 26.06 respectively, and post value of (RT) and (LT) step length for Group B was 28.93 and 28.4 respectively. And SD of pre value of (RT) and (LT) step length for Group B was 4.43 and 3.85, and post value of (RT) and (LT) step length for Group B was 4.44 and 3.75 respectively. And t-value for (RT) and (LT) was 9.26 and 11 respectively with p-value <0.0001.Which shows statistically significant.
Table 3. Shows Group A pre and post Mean and SD of stride length
Group A(Experimental group) Stride length
pre post pre post t-value p-value
(RT) (RT) (LT) (LT) < 0.0001
MEAN 40.66 64.8 44.46 66.46 rt=20
SD 3.82 4.79 4.75 4.42 lt=14.61
[image:4.595.42.283.409.473.2]Here paired t-test was used. Mean value of pre (RT) and (LT) stride length for Group A was 40.66and 44.46 respectively, and post value of (RT) and (LT) stride length for Group A was 64.8 and 66.46 respectively. And SD of pre value of (RT) and (LT) stride length for Group A was 3.82 and 4.75, and post value of (RT) and (LT) stride length for Group A was 4.79 and 4.42 respectively. And t-value for (RT) and (LT) was 20 and 14.61 respectively with p-value <0.0001.Which shows statistically extremely significant.
Table 4. Shows Group B pre and post Mean and SD of stride length
Group B(Control group) Stride length
pre post pre post t-value p-value
(RT) (RT) (LT) (LT) < 0.0001
MEAN 38.6 43.13 38.86 42.6 rt=13.48
SD 4.52 3.96 3.86 3.72 lt=16.36
[image:4.595.341.526.455.507.2]Here paired t-test was used. Mean value of pre (RT) and (LT) stride length for Group B was 38.6 and 38.86 respectively, and post value of (RT) and (LT) stride length for Group B was 43.13 and 42.6 respectively. And SD of pre value of (RT) and (LT) stride length for Group B was 4.52 and 3.86, and post value of (RT) and (LT) stride length for Group B was 3.96 and 3.72 respectively. And t-value for (RT) and (LT) was 13.48 and 16.36 respectively with p-value <0.0001.Which shows statistically significant.
Table 5. Shows Group A pre and post Mean and SD of Cadence
Group A(Experimental group) Cadence
pre post t-value p-value
MEAN 40.26 63.6 13.68 < 0.0001
SD 7.8 9
Here paired t-test was used. Mean value of pre cadence for Group A was 40.26, and post value of cadence for Group A was 63.6. And SD of pre value for Group A cadence was 7.8, and post value for Group A cadence was 9. And t-value was 13.68 with p-value <0.0001.Which shows statistically extremely significant.
Table 6. Shows Group B pre and post Mean and SD of Cadence
Group B(Control group) Cadence
pre post t-value p-value
MEAN 35.86 41.46 12.02 < 0.0001
SD 6.42 6.34
Here paired t-test was used. Mean value of pre cadence for Group B was 35.86, and post value of cadence for Group B was 41.46. And SD of pre value for Group B cadence was 6.42, and post value for Group B cadence was 6.34. And t-value was 12.02 with p-t-value <0.0001.Which shows statistically significant.
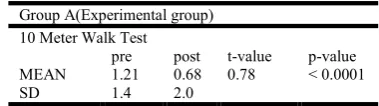
Table 7. Shows Group A pre and post Mean and SD of 10 Meter Walk Test
Group A(Experimental group) 10 Meter Walk Test
pre post t-value p-value
MEAN 1.21 0.68 0.78 < 0.0001
SD 1.4 2.0
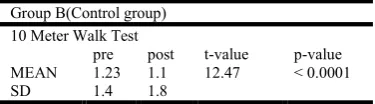
[image:4.595.40.285.624.687.2] [image:4.595.336.526.629.682.2]pre Time of 10 Meter Walk Test for Group B was 1.4, and post Time of 10 Meter Walk Test for Group B was 1.8. And t-value was 12.47 with p-value <0.0001.Which shows statistically significant.
Table 8. Shows Group B pre and post Mean and SD of 10 Meter Walk Test
Group B(Control group) 10 Meter Walk Test
pre post t-value p-value
MEAN 1.23 1.1 12.47 < 0.0001
SD 1.4 1.8
Table 9. Shows Group A pre and post Mean and SD of Dynamic gait index
Group A(Experimental group) Dynamic Gait Index
pre post t-value p-value
MEAN 4.33 5.46 3.5 0.0035
SD 0.69 0.49
[image:5.595.69.257.144.196.2]Here paired t-test was used. Mean value of pre score of Dynamic Gait Index for Group A was 4.33, and post score of Dynamic Gait Index for Group A was 5.46. And SD of pre score Dynamic Gait Index for Group A was 0.69, and post score Dynamic Gait Index for Group A was 0.49. And t-value was 3.5 with p-value 0.0035.Which shows statistically extremely significant.
Table 10. Shows Group B pre and post Mean and SD of Dynamic gait index
Group B(Control group) Dynamic Gait Index
pre post t-value p-value
MEAN 4 4.46 6.84 < 0.0001
SD 0.73 0.71
Here paired t-test was used. Mean value of pre score of Dynamic Gait Index for Group B was 4, and post score of Dynamic Gait Index for Group B was 4.46. And SD of pre score Dynamic Gait Index for Group B was 0.73, and post score Dynamic Gait Index for Group B was 0.71. And t-value was 6.84 with p-value <0.0001.Which shows statistically significant.
Table 11. Shows Group A and Group B pre and post Mean and SD of step length
Step length Group A
Group B
Group A
Group B
t-value p-value
(RT) (RT) (LT) (LT) < 0.0001
MEAN 40.46 28.93 41.46 28.4 rt=7.28
SD 3.98 4.44 3.68 3.75 lt=9.29
[image:5.595.59.266.241.292.2]Here unpaired t-test was used. Mean value of post (RT) and (LT) step length for Group A was 40.46 and 41.46 respectively , and post value of (RT) and (LT) step length for Group B was 28.93 and 28.4 respectively. And SD of post value of (RT) and (LT) step length for Group A was 3.98 and 3.68, and post value of (RT) and (LT) step length for Group B was 4.44 and 3.75 respectively. And t-value for (RT) and (LT) was 7.28 and 9.29 respectively with p-value <0.0001.Which shows statistically extremely significant.
Table 12. Shows Group A and Group B pre and post Mean and SD of stride length
Stride length Group A
Group B
Group A
Group B
t-value p-value
(RT) (RT) (LT) (LT) < 0.0001
MEAN 64.8 43.13 66.4 42.6 rt=13.04
SD 4.79 3.96 4.42 3.72 lt=15.45
[image:5.595.327.540.303.345.2]Here unpaired t-test was used. Mean value of post (RT) and (LT) stride length for Group A was 64.8 and 66.4 respectively , and post value of (RT) and (LT) stride length for Group B was 43.13 and 42.6 respectively. And SD of post value of (RT) and (LT) stride length for Group A was 4.79 and 4.42, and post value of (RT) and (LT) stride length for Group B was 3.96 and 3.72 respectively. And t-value for (RT) and (LT) was 13.04 and 15.45 respectively with p-value <0.0001.Which shows statistically extremely significant.
Table 13. Shows Group A and Group B pre and post Mean and SD of cadence
Cadence
Group A Group B t-value p-value
MEAN 63.6 41.46 7.51 < 0.0001
SD 9 6.34
Here unpaired t-test was used. Mean value of post cadence for Group A was 63.6, and post value of cadence for Group B was 41.46. And SD of post value of cadence for Group A was 9, and post value of cadence for Group B was 6.34. And t-value was 7.51 with p-value <0.0001.Which shows statistically extremely significant.
Table 14. Shows Group A and Group B pre and post Mean and SD of 10 Meter Walk Test
10 Meter Walk Test
Group A Group B t-value p-value
MEAN 0.68 1.1 3.16 0.0037
SD 2.0 1.8
Here unpaired t-test was used. Mean value of post Time of 10 Meter Walk Test for Group A was 0.68, and post Time of 10 Meter Walk Test for Group B was 1.1. And SD of post Time of 10 Meter Walk Test for Group A was 2.0, and post Time of 10 Meter Walk Test for Group B was 1.8. And t-value was 3.16 with p-value 0.0037.Which shows statistically extremely significant.
Table 15. Shows Group A and Group B pre and post Mean and SD of Dynamic gait index
Dynamic Gait Index
Group A Group B t-value p-value
MEAN 5.46 4.46 4.27 0.0002
SD 0.49 0.71
[image:5.595.60.265.426.479.2] [image:5.595.36.288.614.677.2] [image:5.595.329.535.642.685.2]Graph 2. Bar diagram shows comparison Mean and SD of Group B step length
DISCUSSION
The results showed improvement in gait speed after 12 sessions of gait rehabilitation using BWSTT. In this study protocol was 4 weeks of BWSTT at a frequency of 3 times per week, and this was a shorter period and lower frequency than those of other studies; however, the improvement in gait speed was relatively similar (Toshifumi Takao, 2015). This was an important point of the study. In a BWSTT intervention, the proportion of body weight support and the treadmill speed are selectable during each session; however, there is no standard for selection. As the duration of the sessions ranged from 20 to
40 minutes in other studies 15 minutes was selected in the present study. The proportion of body weight support varied
from 15 to 50% in previous works and Aaslund et al. 2013
argued that during treadmill walking, the choice of walking speed had a greater impact on kinematic walking
characteristics than the proportion of body weight support.14
So, the proportion of body weight support was set at individuals capacity in all sessions, and the subjects selected the treadmill speed on their own to a speed that was as fast as possible but was below their gait speed on the floor. Under the conditions, none of the subjects dropped out of the study, and they could walk safely on the treadmill (Werner, 2002).
Graph 3. Bar diagram shows comparison Mean and SD of Group A stride length
Graph 4. Bar diagram shows comparison mean and SD of Group B stride length
Graph 5. Bar diagram shows comparison mean and SD of Group A cadence
Graph 6. Bar diagram shows comparison Mean and SD of Group B cadence
Graph 7. Bar diagram shows comparison mean and SD of group A 10 Meter walk test
Graph 8. Bar diagram shows comparison mean and SD of Group B 10 Meter walk test
Graph 9. Bar diagram shows comparison Mean and SD of Group A Dynamic Gait Index
Graph 10. Bar diagram shows comparison Mean SD of Group B Dynamic Gait Index
Graph 11. Bar diagram shows Comparison Mean SD of Group B step Length
Graph 12. Bar diagram shows comparison Mean and SD of Group A and Group M stride length
Graph 13. Bar diagram shows comparison Mean and SD of Group A and Group B cadence
Graph 14. Bra diagram shows comparison Mean and SD of Group A and Group B 10 Meter walk Test
On the other hand, it is very important to gain advantageous results under the constraints of limited time (Toshifumi Takao, 2015). Individuals with stroke present limited foot rotation and lower-limb flexion during the swing period which leads to insufficient toe-clearance. Consequently, these individuals have an increased risk for stumbling and falling (Werner, 2002). Besides increasing gait speed, gait training with partial BWS during treadmill walking promoted increased toe-clearance which is an important gait requirement for safety. Increased toe-clearance resulted from increased segmental rotation of the lower limbs (Catarina, 2011). Locomotor therapy in neurological rehabilitation is dependent on activation of spinal and supraspinal locomotor pattern
generators. Besides experiments in spinalized cats, alterations of muscle activation patterns of various lower limb muscles in paraparetic and hemiparetic subjects following locomotor therapy support the assumption of neural adaptations (Klaske Van Kammen, 2014).
Graph 15. Bar diagram shows comparison mean and SD of Group A and Group B Dynamic gait index
Also, one should keep in mind that spontaneous recovery surely contributed to the observed beneficial effects within a relatively short time. The group comparison revealed that patients in group A had reached a significantly higher gait ability level as compared with patients in group B. Setting the paretic limbs and controlling the trunk movement required a considerable physical effort from the therapists, in a nonoptimal working posture (Toshifumi Takao, 2015).
Conclusion
This is pre and post experimental study comparing Body Weight Support System Treadmill Training versus Treadmill Training in post stroke patients on 30 subjects. This study concluded that Body Weight Support System Treadmill Training shows more improvement in gait of post stroke patients compare to Treadmill Training.
Limitation of the Study
The study consists of small sample size which should
be received to large sample size.
Sampling technique was not standard.
Suggestion for Future study
Study could be done with large sample size.
Comparison could be done with over ground walking.
REFERENCES
Ashrafian H. Familial stroke 2700 years ago. Stroke; a journal of cerebral circulation. 2010;41(4):e187.
Werner C. et al. 2002. Treadmill Training With Partial Body
Weight Support and an Electromechanical Gait Trainer for Restoration of Gait in Subacute Stroke Patients .A Randomized Crossover Study. (Stroke. 2002;33:2895-2901.)
Catarina O Sousa1, José A Barela2,3, Christiane L Prado-Medeiros1, Tania F Salvini1 and Ana MF Barela3* Gait training with partial body weight support during overground walking for individuals with chronic stroke: a pilot study. Sousa et al. Journal of NeuroEngineering and Rehabilitation 2011, 8:48 http://www.jneuroengrehab. com/content/8/1/48.
Catherine M. Dean et al. 2010 Show moredoi:10.1016/S1836-9553(10)70039- Treadmill walking with body weight support in subacute non-ambulatory stroke improves walking capacity more than overground walking: a randomised trial.
Combs SA, Dugan EL, Passmore M, Riesner C, Whipker D, Yingling E, Curtis AB. Balance, balance confidence, and health-related quality of life in persons with chronic stroke after body weight–supported treadmill training. Archives of Physical Medicine and Rehabilitation Volume 91, Issue 12, December 2010, Pages 1914–1919.
Jan Mehrholz1,*, Marcus Pohl2, Bernhard Elsner3 Treadmill training and body weight support for walking after stroke23 JAN 2014.
Khaw KT. Epidemiology of stroke. Journal of neurology,
neurosurgery, and psychiatry. 1996;61(4):333-8.
Klaske Van Kammen, Annemarijke Boonstra, Heleen Reinders-Messelink, Rob den The Combined Effects of Body Weight Support and Gait Speed on Gait Related Muscle Activity: A Comparison between Walking in the Lokomat Exoskeleton and Regular Treadmill Walking September 16, 2014 10.1371/journal.pone.0107323. Lisa Taipalus BScPT, NEO Regional Stroke Best Practice
Consultant for Physiotherapy, December 2009 (updated June 2011).
Louise Ada,et al. Randomized Trial of Treadmill Walking With Body Weight Support to Establish Walking in
Subacute Stroke The MOBILISE Trial (Stroke.
2010;41:1237-1242.).
Margit Alt Murphy HCP. Stoke Arm Longitudinal study at the university of Gothenberg, prospective cohort study protocol. BMC Neurology. 2011.
Melek junes yavuzar et al. walking after stroke interventions to restore normal gait pattern. -2006.
Pamela W. Duncan, P.T., Ph.D., Katherine J. Sullivan, P.T., Ph.D.Andrea L. Behrman n BODY WEIGHT SUPPORT TREADMILL TRAININGengl j med 364;21 nejm.2026 org may 26, 2011.
Susan B. O’ Sullivan. Physical rehabilitation, assessment and
treatment. 5th Edition. 2007: 709-737.
Thompson JE. The evolution of surgery for the treatment and prevention of stroke. The Willis Lecture. Stroke; a journal of cerebral circulation. 1996;27(8):1427-34.
Toshifumi Takao, RPT, PhD, Naoki Tanaka, RPT, Improvement of gait ability with a short-term intensive gait rehabilitation program using body weight support treadmill training in community dwelling chronic poststroke
survivors J. Phys. Ther. Sci. 27: 159–163, 2015.
Valerie J.et al. Gait Parameters Associated With
Responsiveness to Treadmill Training With Body-Weight Support After Stroke: An Exploratory Study.doi:
10.2522/ptj.20090141 Originally published online
December 18, 2009 PHYS THER. 2010; 90:209-223. Veneri D (2012) Does Combining Body Weight Support
Treadmill Training with Thera-Band® Improve
Hemiparetic Gait? J Nov Physiother 2:114. doi: 10.4172/2165-7025.1000114.
Visintin M, Barbeau H, Korner-Bitensky N, Mayo NE: A new approach to retrain stroke patients through body weight support and treadmill stimulation. Stroke 1998, 29:1122-1128.