A Sensor Awakening Algorithm for Wireless Multimedia
Sensor Networks Three Dimensional Target Tracking
Jing Zhao1,2, Jianchao Zeng2
1
College of Electrical and Information Engineering, Lanzhou University of Technology, Lanzhou, China
2
Complex System and Computational Intelligence Laboratory, Taiyuan University of Science and Technology, Taiyuan, China
E-mail: zhaojing_740609@163.com, zengjianchao@263.com Received May 13, 2010; revised June 22, 2010; accepted July 24, 2010
Abstract
For node awakening in wireless multi-sensor networks, an algorithm is put forward for three dimensional tar- get tracking. To monitor target dynamically in three dimensional area by controlling nodes, we constract vir- tual force between moving target and the current sense node depending on the virtual potential method, then select the next sense node with information gain function, so that when target randomly move in the specific three dimensional area, the maximum sensing ratio of motion trajectory is get with few nodes. The proposed algorithm is verified from the simulations.
Keywords: Wireless Multimedia Sensor Network, Multimedia Sensor, Sense Area, Possible Sense Area, Three Dimensional Target Tracking, Information Gain, Virtual Potential
1. Introduction
Wireless sensor networks (WSNs) have drawn a more attention in the last few years [1], including traditional wireless sensor networks and wireless multimedia sensor networks(WMSNs). Since the traditional wireless sensor networks only provide simple sensing data such as temp- erature, humidity and so on [2], so not as to meet the re- quirement of more complicated and precise data applica-tions. WMSNs differ from the traditional wireless sensor networks due to their characteristic of directivity and are more interest in intensive information data (e.g. video, image) [3].
The theory of the virtual force is often used to solve coverage problem in WSNs. It was first proposed in the research of the mobile robotics route plan and obstacle avoidance by Khatib [4]. Howard et al [5] applied it to the coverage problem of WSNs, then the technique was proved to be useful for such problem in [6,7], the virtual potential field could cause the repel force between sen-sors. The force that repelled each other made sensor spread from dense to sparse area. Tao et al. and Zhao et al. [8,9] present a virtual potential field based coverage-en- hancing algorithm for directional sensor networks, where overlap is reduced and the ratio of coverage is enhanced by forcing sensors to the most beneficial orientation un-der repel force in terms of the Euclidean distance
be-tween ‘centroid’.
There are many target tracking algorithms for traditional wireless sensor networks, such as following[10]: K Mec- hitov et al [11] provide an cooperative tracking with bi-nary-detection algorithm; In [12], based on signal inten-sity a distributed algorithm about decentralized source localization and tracking is put forward by Rabbat and Nowak; Based on clusering, Friedlander D. et al. pro-vides Dynamic space-time algorithms[13]; A Adaptive target tracking algorithms is given by Xingbo Yu et al. by considering tracking efficiency and nodes energy con-sumption[14]; Gordon [15] uses particle filter algorithm and so on, but most of them focus on the research of tar-get location and data processing. The coverage is a fun-damental problem in the networks [16]. Perfected cov-erage is important to sense target area and collect useful data. After node freedom deployment, it is a hot problem needed to be urgently solved that how control sensors to cover motion trajectory efficiently and wholly [17] espe-cially for three dimensional target tracking.
in-formation gain function so that as few nodes as possible are used to get the maximum probability of motion tra-jectory sensing when target randomly move in the spe-cific three dimensional area.
2. Sensing Model
2.1. Concepts
Prior to build sensing model of WMSNs, some definiti- ons are given below:
● Sense Cone.
Sensing cone is the three dimensional area being sensed by multimedia sensor in three dimensional target area, shown with shadow area in Figure 1.
● Possible Sense Area.
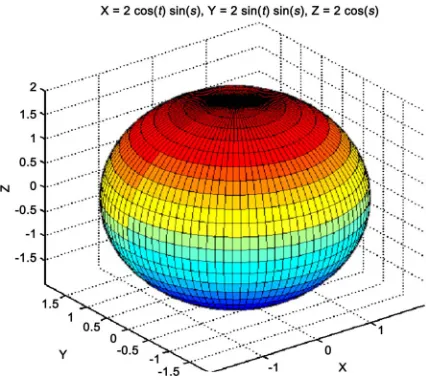
Possible sense area is a sphere being sensed by multi-media sensor rotation in three dimensional target area, shown with all sphere in Figure 2.
● Sense Direction.
In three dimensional target area, three dimensional coordinate axis is built through sensor position, sense direction, that is , are expressed by (,,) those respectively are vidicon’s offset angles to the X, Y AND Z coordinate planes.
● Neighboring Sensor.
The neighboring sensors are the sensors whose dis- tances are less than 2R, where the R is the radius of Pos-sible Sense Area.
● Neighboring Area and Neighboring Sensor of Inter-section.
The neighboring area of intersection is the circle area whose radius to intersection is less than R and the sen-sors in this circle are neighboring sensor of intersection.
● Warning Round.
[image:2.595.316.529.77.268.2]The warning round is the circle whose radius is less than R, when target arrive at warning circle, sense node
Figure 1. Sensing cone of a sensor.
Figure 2. Possible sensing area of a sensor.
will warn other neighboring sensors of this intersection and the next sense node begin to be selected.
● Intersection.
The intersection is the join point of warning round and target motion trajectory and target will continue moving with direction at this point.
● Centroid.
The “centroid” point denotes center of the mass in ph- ysics. Here, the “centroid” is defined as the center of sen- se cone, so the sector’s turning around the location is vie- wed as the centroid’s rotation. The “centroid” point of sense cone is at the symmetric axis and its distance to sensor location is 2Rsin()/3.
● Coverage Leak.
The coverage leak is the uncovered motion trajectory of target.
● Coverage Ratio of Target.
That is ratio of motion trajectory length covered by all sense nodes’ possible sense area to whole motion trajec-tory length.
2.2. Sensing Models
Unlike an isotropic sensor, a multimedia sensor has a co- ne sensing area shown in Figure 1 and aimed at maxim-
izing covered motion trajectory with a minimum number of sensors, it is assumed not to move and only to rotate ar- ound sensor position after randomly deployed, so forms sphere possible sensing area, as shown in Figure 2.
Considering sense cone and possible sense sphere ,we define sensing model with 5-tuple, shown as follows:
) , , , ,
[image:2.595.58.286.533.703.2]3. A Sensor Awakening Algorithm for
Wireless Multimedia Sensor
Networks Three Dimensional
Target Tracking (SATTT)
3.1. Problem Definition
We shall study the problem of node scheduling in wire-less sensor networks. To begin with, some necessary ass- umptions have to be made: 1) the localization informa-tion of moving target can be achieved with certain eq- uipments built in sensors such as radar, infrared aids, and angle measuring device; 2) the exact sensing angle and position of sensor can be gained by itself; 3) all nodes in network are homogeneous, whose sensing angle and ra-dius are same as each other; and 4) all sensor nodes are deployed randomly.
In real monitor applications, the target randomly enter the specific three dimensional area and randomly move in this area till it leaves the area. Then the controlling of sensing nodes, i.e., awaking as less nodes as possible to monitor the target gets inevitable. Aiming at the surveill- ance for target randomly moving in the specific area, this paper develops a node controlling algorithm for three di- mensional target sensing with randomly deployed nodes in wireless multimedia sensor network.
3.2. Idea of Algorithm
Entering the specific three dimensional area, the target will be sensed by the one node, so others sensors turn to be asleep. Then the virtual gravitational force between target and sensing node can be calculated based on virt- ual potential theory and used to control the node turned around following with the moving target. When the targ- et moves at the warning around of the node possible sen- sing sphere, the intersection is formed. According to the moving angle of target at the intersection, the area of in- formation gain is set to calculate the gain values of the neighbor nodes of the intersection. The node having the maximum gain value will be selected to be the next sense node. At the same time, the current sensing node is tur- ned to be asleep. The above process repeats until the tar-get goes away the specific area.
3.3. Sensor Rotation Way
Entering the specific three dimensional area, the target will be sensed by one nodes. Then the virtual force betw- een target and sensing node can be calculated based on virtual potential theory and used to control the node to rotate following with the target movement.
i i
i r
r k
F 1 12 0 (1)
where k1 is density of field; r0i is a vector of unit
length and describes the direction of force from “cen-troid” point of node i to target location; ri describes
distance between “centroid” point of node i and target location. When target is sensed by sensor i, sensor i will rotate following with target moving under virtual force coming from target, so sensor rotational speed is decided by the target moving speed.
3.4. Selection of Sensor Node
When target moves at the boundary of the sense node, selecting the next effective sense node is very important to target tracking.
● Formation of Intersection.
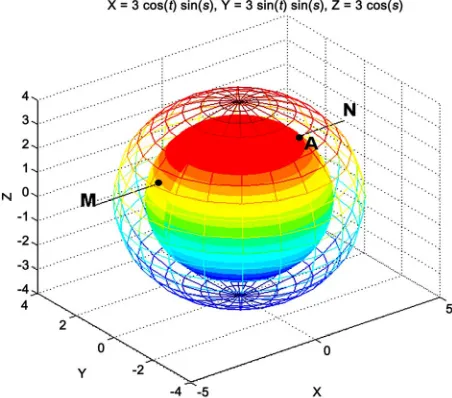
When the target moves at the warning round of the sense node, the intersection point of warning round and motion trajectory forms the intersection of sense node, as shown in Figure 3. Where, the bigger sphere shown with
mesh grid describes possible sense round of sensor i, the smaller solid sphere is warning round, black line MN describes target motion trajectory, A is the intersection of sense node i.
● Setting area of Information Gain.
In this paper, information is the covered length of mo-tion trajectory that is uncovered before, gain is increasing and describes information increasing, so the area of in-formation gain is the area where uncovered motion tra-jectory is covered by next sense node, that is explained in
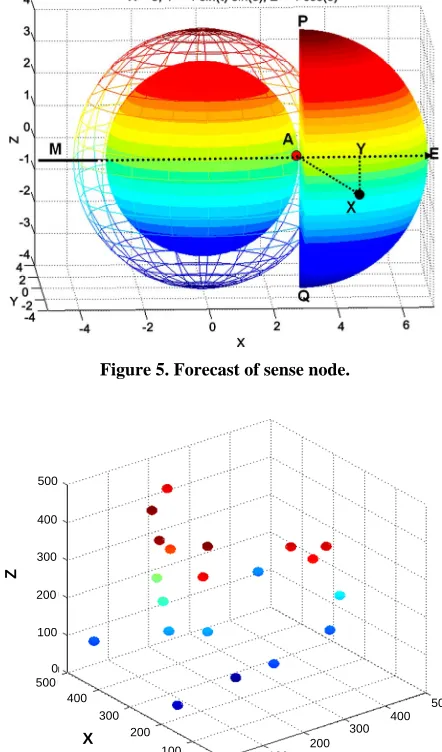
[image:3.595.309.535.499.698.2]Figure 4, where MA is the target moving direction at
Figure 4. Information gain area.
intersection A, PQ is vertical plane of MA and through intersection A, neighboring area of intersection A is di-vided equally, the half sphere POQ pointed at by MA is the area of information gain. The area is a estimation area where the sensor the most likely covers coming mo-tion trajectory.
● Calculation of Information Gain and Selection of Next Sense Node.
In real monitor applications, the scheduling of sensing nodes, i.e., awaking as less nodes as possible to monitor the target gets inevitable, so for getting the maximum information gain , the next sense node is so far so good from point A and the distance from the next sense node to Linear AE is as close as possible, that is explained with ichnography in Figure 5, where X is random sensor
in information gain half sphere, XY describes the dis-tance from X to Linear AE, AX is the disdis-tance from X to intersection A, information gain is determined by AX and XY, shown as follows:
2
AX inf
XY k
(2)
4. Simulation Results
The Simulation Results of controlling algorithm and the effect of sensor parameters on coverage ratio is given in this section.
4.1. Simulation Results of the SATTT
To simulate the algorithm, 20 isomorphic sensors with sensing radius 60 m and separation angle 45 of sens-
ing cone are deployed randomly in a region of 500 × 500
3
500 m
[image:4.595.70.271.76.245.2] [image:4.595.315.531.305.482.2] . Entering this specific three dimensional area randomly, the target will move randomly till living it. The simulation results are shown in Figures 6-7, where,
Figure 6 shows the initial sensors deployment in the
region and little spheres show location of sensors; Fig.7 shows the coverage ratio of target motion trajectory, where the target enter the area from A and leaves from B after randomly moving in the three dimensional area, and spheres show awaked sensors for sensing target, the red line with stare dots is target motion trajectory whose coverage ratio is 32.26%.
When 200 isomorphic sensors are deployed randomly, the simulation results are shown in Figures 8-9,
cover-age ratio is 100 . %
4.2. Effects of Sensor Number on Coverage Ratio
To simulate the effect of sensor number on coverage ratio, sensors with sensing radius 60m and separation angle 45 of sensing sector are deployed randomly in a
Figure 5. Forecast of sense node.
X
Y
Z
X
Y
Z
400
300
200
100
0
Y
Z
500
500 400
400 300
300 200
200 100 500
0 0 100
[image:4.595.311.532.312.688.2]X
X Y Z A B X Y Z X Y Z A B 500 400 300 200 100 0 X Y Z 500 500 400 400 300 300 200 200
100 100
[image:5.595.62.281.83.261.2]0 0
Figure 7. Node scheduling of 20 sensors, p = 32.26\%.
X Y Z X Y Z 500 400 300 200 100 0 X Y Z
0 0
100 100
[image:5.595.63.281.289.464.2]200 200 300 300 400 400 500 500
Figure 8. Initial deployment of 200 sensors.
X Y Z A B X Y Z A B 500 400 300 200 100 100 200 300 400 500 0 0 0 X Y Z 100 200 300 400 500
Figure 9. Node scheduling of 200 sensors, p = 100\%.
region of 500 × 500 × 500 m3. We provide the mean
re-sults of many simulations with 50, 100, 150 and 200 sen-sors in Figure 10. It shows that as the number of nodes
increases, the coverage ratio of motion trajectory in-crease too.
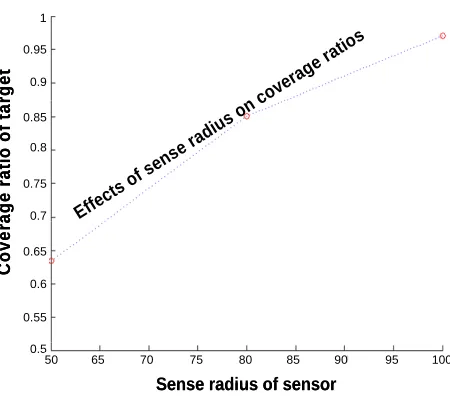
4.3. Effects of Sense Radius on Coverage Ratios
To simulate the effect of sense radius on coverage ratios, 200 sensors with separation angle 45 of sensing sector
are deployed randomly in a region of 500 × 500 × 500 m3.
We provide the mean results of simulations with sensing radius 60 m, 80 m and 100 m in Figure 11. It shows that
the coverage ratio of motion trajectory increases follow-ing with increasfollow-ing of nodes sensfollow-ing radius and nearly reaches p = 100% when radius is 100.
Effects of sensor
number on cove
rage ratio
Effects of sensor
number on cove
rage ratio
1 0.9 0.8 0.7 0.6 0.5 0.4 0.3 C o ver a ge r a tio of tar g et C o ver a ge r a tio of tar g et
50 100 150 200
Number of sensor Number of sensor
Figure 10. Effects of sensor number on coverage ratio.
Effec ts of
sens e rad
ius on cove
rage ratio
s
Effec ts of
sens e rad
ius on cove rage ratio s C o ver a ge r a ti o of t a rg e t C o ver a ge r a ti o of t a rg e t
Sense radius of sensor Sense radius of sensor
1 0.95 0.8 0.7 0.6 0.5
50 65 70 75 80 85 90 95 100 0.9
0.85
0.75
0.65
[image:5.595.310.538.295.465.2]0.55
[image:5.595.312.537.501.699.2] [image:5.595.67.272.510.695.2]5. Conclusions
Concentrating on node controlling, the authors put for-ward an algorithm for three dimensional target tracking in wireless multi-sensor networks. The corresponding al- gorithm working depends on the virtual potential method. To monitor target dynamically by controlling nodes, we structure virtual force between moving target and the current sense node, then select the next sense node with information gain function so that as few nodes as possi-ble are used to get the maximum probability of motion trajectory sensing when target randomly move in the spe- cific three dimensional area till target living it. The pro-posed algorithm is verified from the simulations.
6. References
[1] I. F. Akyildiz, T. Melodia and K. R. Chowdhury, “A Survey on Wireless Multimedia Sensor Networks,” Com- puter Networks, Vol. 51, No. 4, March 2007, pp. 921- 960.
[2] I. Akyildiz, W. Su, Y. Sankarasubramaniam and E. Cay- irci, “Wireless Sensor Networks: A Survey,” Computer Networks, Vol. 38, No. 4, 2002, pp. 393-422.
[3] H. Ma and D. Tao, “Multimedia Sensor Network and its Research Progresses,” Journal of Software, Vol. 17, No. 9, 2006, pp. 2013-2028.
[4] O. Khatib, “Real-Time Obstacle Avoidance for Manipu- lators and Mobile Robots,” The International Journal of Robotics Research, Vol. 5, No. 1, 1986, pp. 90-98. [5] A. Howard, M. Mataric and G. Sukhatme, “Mobile Sensor
Network Deployment Using Potential Fields: A Distri- buted, Scalable Solution to the Areacoverage Problem,” Proceedings of 6th International Symposium on Distri- buted Autonomous Robotic Systems, Fukuoka, Vol. 5, 25- 27 June 2002, pp. 299-308.
[6] X. Wang, S. Wang and J. Ma, “An Improved Co-Evo- lutionary Particle Swarm Optimization for Wireless Sensor Networks with Dynamic Deployment,” Sensors, Vol. 7, No. 3, 2007, pp. 354-370.
[7] Y. Zou and K. Chakrabarty, “Sensor Deployment and Target Localization Based on Virtual Forces,” Proceed- ings of 22nd Annual Joint Conference of the IEEE
Computer and Communications Societies, San Francisco, Vol. 2, 30 March-3 April 2003, pp. 1293-1303.
[8] D. Tao, H. Ma and L. Liu, “A Virtual Potential Field Based Coverage-Enhancing Algorithm for Directional Sensor Networks,” Journal of Software, Vol. 18, No. 5, 2007, pp. 1152-1163.
[9] J. Zhao and J.-C. Zeng, “A Virtual Potential Field Based Coverage Algorithm for Directional Networks,” Chinese Control and Decision Conference, Guilin, 17-19 June 2009, pp. 4605-4610.
[10] J. Tang, H.-S. Shi and Z.-X. Han, “An Target Tracking Algorithm for Wireless Sensor Networks,” Journal of Air Force Engneering University (Natural Science Edition), Vol. 7, No. 5, October 2006, pp. 25-29.
[11] K. Mechitov, S. Sundresh, Y. Kwon, et al., “Agha Co- operative Tarcking with Binary-Detection Sensor Net- works,” Proceedings of the 1st Intemational Conference on Embedded Networked Sensor Systems, Los Angeles, 5-7 November 2003, pp. 332-333.
[12] M. G. Rabbat and R. D. Nowak, “Decentralized Source Localization and Tracking,” Proceedings of the IEEE Intemational Conference on Acoustics, Speech and Signal Processing, Montreal, 17-21 May 2004, pp. 921-924. [13] D. Friedlander, C. Griffin, N. Jacobson, et al., “Dynamic
Agent Classification and Tracking Using an Ad Hoc Mobile Acoustic Sensor Network,” EURASIP Joumal on Applied Signal Processing, Vol. 2003, No. 4, 2003, pp. 371-377.
[14] X. B. Yu, K. Niyogi, S. Mehrotra and N. Venkatasubra- manian, “Adaptive Target Tracking in Sensor Networks,” Communication Networks and Distributed Systems Mode- ling and Simulation Conference, San Diego, 18-21 Januray 2004, pp. 253-258.
[15] N. J. Gordon, D. J. Salmond and A. F. M. Smith, “Novel Approach to Nonlinear/Non-Gaussian Bayesian State Esti- mation,” IEE Proceedings of Radar and Signal Process- ing, Vol. 140, No. 2, 1993, pp. 107-113.
[16] J. Ai and A. Abouzeid, “Coverage by Directional Sensors in Randomly Deployed Wireless Sensor Networks,” Journal of Combinatorial Optimization, Vol. 11, No. 1, 2006, pp. 21-41.