Original Article
Impedance differences between chronic
obstructive pulmonary disease and Asthma
patients with the same airflow limitation severities
Guang-Sheng Qi, Hao Wu, Hua Yang, Ya-Ping Yuan, Feng Xi, Wen-Chao Gu
Department of Respiratory Medicine, Shanghai Pudong New Area People’ s Hospital, No. 490, South Chuanhuan Road, Pudong New Area, Shanghai, China
Received February 17, 2016, Accepted May 15, 2016; Epub July 15, 2016; Published July 30, 2016
Abstract: Objective: Chronic obstructive pulmonary (COPD) disease and asthma are both chronic lung diseases
that limit airflow. The aim of this study was to compare IOS parameters of COPD and asthma patients with the same airflow limitation levels. Then evaluate the application value of IOS parameters to identify these two diseases. Methods: A total of 155 patients, including 35 normal subjects, 60 COPD patients, and 60 asthma patients, were enrolled in this study. The COPD and asthma patients were divided into three subgroups according to their airflow limitation stages. Each subgroup contained 20 subjects. We compared the IOS parameters of the normal subjects, COPD patients, and asthma patients. The IOS parameters in each paired COPD and asthma subgroup with the same airflow limitations were also compared. ROC and discriminant analysis were used to evaluate the power of IOS parameters to differentiate between asthma and COPD patients. Results: The IOS parameters including Z5, R5, R20 and R5-20 of both the COPD and asthma patients were greater than those of the normal subjects. The above
IOS parameters were greater in the asthma patients than the COPD patients, although the FEV1 values were not
significantly different. When the IOS parameters were compared between the paired asthma and COPD subgroups, the results were the same as those for the whole COPD and asthma groups. ROC analysis showed Z5, R5, R20 alone
were valuable to distinguish with COPD and asthma with the same airflow limitation, whose AUCs were all greater than 0.7. Discriminant analysis showed that more than 75% patients can be correctly classified when combining spirometry and IOS parameters. Conclusion: The respiratory impedance indices of asthma patients are greater than those of COPD patients, although the airflow limitations of these patients are similar. These differences may provide
help to distinguish with COPD and asthma patients.
Keywords: Impedance, impulse oscillometry, asthma, chronic obstructive pulmonary disease, lung function
Introduction
Chronic obstructive pulmonary disease (COPD) and asthma are very common chronic airway diseases [1]. During the exacerbation of these conditions, airflow limitations can be detected
in both COPD and asthma patients [2, 3]. The forced expiratory volume in 1 second (FEV1) is
the most important index of the severity of air
-flow limitation and is measured by spirometry
[4]. However, when performing spirometry, the
subjects are required to have to breathe in a
hard manner. Currently, many lung function
tests [4] that can reflect other pathological aspects of diseases [5, 6] are widely used in clinical practice [7], whereas the conventional
pulmonary function test (cPFT) is not. Some of
these lung function tests do not require hard
breathing, and the breathing patterns during
the measurements are similar to those of daily life [5, 6]. The parameters of these tests reflect
pathological changes in tidal breathing [8] and
may differ between COPD and asthma patients who endure the same level of airflow
limitation.
Impulse oscillometry (IOS) was introduced by
Dubois [9] and is considered to be a forced oscillation technique (FOT) in which only normal breathing is required [10]. IOS allows for the collection of respiratory impedance indices
including the respiratory impedance at 5 Hz
resist-ance at 20 Hz (R20), the difference in resistanc -es at 5 Hz and 20 Hz (R5-20), and the reactance at 5 Hz (X5) [11]. Based on these indices, we know that respiratory resistance and reactance
are located in different parts of the airway [12].
Since IOS was introduced, many studies have revealed that some respiratory resistance is well correlated with FEV1 in both COPD and asthma patients [11, 13-17]. Furthermore, IOS
has been confirmed to possess the ability to detect the airflow limitation stage in obstruc -tive lung disease [6, 18-20]. Moreover, in
con-trast to spirometry measurements, the perfor
-mance of IOS does not require hard respiration.
When the measurements are initiated, the sub-ject’s breathing pattern is similar to the breath
pattern of daily life. So the parameters from IOS can reflect respiratory resistance in tidal
breathing [21-23]. Therefore, although COPD
and asthma patients occasionally endure the
same levels of airflow limitation, the imped
-ance indices from IOS in these patients may differ.
In the present study, sixty COPD patients and sixty asthma patients were selected. We com-pared their respiratory impedances in each
air-flow limitation stage to observe the impedance differences between the COPD and asthma
patients. Further more, we observed the power
of IOS parameters to differentiate COPD and
asthma.
Materials and methods
Study design
Healthy volunteers, COPD patients and asthma
patients were selected if they met the inclusion
criteria. Each enrolled subject was taught to
correctly perform IOS and spirometry. IOS was tested first to the collect the respiratory imped -ance indices. Subsequently, spirometry was
tested to detect the airflow limitation level. IOS was always performed before spirometry. Finally, the collected data were used for the
analyses.
Ethics statement
The Ethics Committee of the Shanghai Pudong
New Area People’s Hospital approved the study
protocol, and informed consent was obtained from each participant.
Subjects
Thirty-five healthy volunteers, sixty asthma
patients and sixty COPD patients were enrolled in this study. All subjects were selected accord-ing to the inclusion and exclusion criteria detailed below.
The healthy volunteers were selected from among subjects with normal lung function and without histories of smoking, recent respiratory
tract diseases, or cardiopulmonary disease.
COPD was diagnosed according to the Global
Initiative for Obstructive Lung Disease criteria
[2], and asthma was diagnosed according to
the Global Initiative for Asthma criteria [1]. The
patients did not use long-acting
bronchodila-tors for at least twenty-four hours prior to the test and abstained from short-acting broncho
-dilators for at least six hours before the test.
The exclusion criteria included other diseases that affect lung function and comparable disa -bilities. Patients with FEV1s < 35% Pred were not included.
The COPD patients were divided into the follow -ing 3 groups: a mild COPD group (FEV1 ≥ 60%
predicted [Pred], n = 20), a moderate COPD
group (50% Pred ≤ FEV1 < 60% Pred, n = 20),
and a severe COPD group (35% Pred ≤ FEV1 <
50% Pred, n = 20). The asthma patients were
also divided into 3 groups: a mild asthma group (FEV1 ≥ 60% Pred, n = 20), a moderate asthma group (50% Pred ≤ FEV1 < 60% Pred, n = 20),
and a severe asthma group (35% Pred ≤ FEV1 <
50% Pred, n = 20). These classifications were performed according to the ATS/ERS-2005
guidelines [24]. In this study, the mild and
mod-erate stages according to the ATS/ERS-2005 guidelines were combined to form the mild asthma group and the mild COPD group. The
moderate COPD group and moderate asthma group were in the moderate-severe stages
according to the ATS/ERS-2005 guidelines. The
severe COPD group and severe asthma group
were in the severe stages according to the ATS/
ERS-2005 guidelines.
Impedance measurement
In the present study, the impedance indices
System (Erich Jaeger GmbH, Hoechberg,
Germany). The system was calibrated using a 3-L syringe for volume calibrations and a refer
-ence resistance of 0.2 KPa/L·(s-1) for the pres -sure calibrations. Body temperature and satu-rated gas pressure calibrations were also
per-formed. When performing IOS, all subjects wore
a nose clip, and they were seated in an upright
position. The patients breathed spontaneously through a mouthpiece. The subjects supported
their cheeks and chins with their hands to
decrease the shunt compliance of the cheeks. The impulse was applied for 30 seconds in each IOS test. We excluded artefacts which
were caused by coughing, swallowing and breath-holding.
Airflow limitation measurement
The airflow limitations were measured using a
computerised spirometer (Erich Jaeger GmbH,
Hoechberg, Germany). Calibration for the
body temperature and the saturated gas
pressure and volume were performed. Each subject was coached how to performe standard forced expiratory manoeuvres. The indices of
airflow limitation included the FEV1 and FEV1/ FVC.
Data analysis
The data were analysed with SPSS version 17.0 (SPSS Inc., Chicago, IL, USA). The indices of the
COPD, asthma and healthy groups were
com-pared with 1-way analysis of variance (ANOVA), and LCD tests were performed to compare the differences between pairs of groups. Some of
these indices were compared by their
logarith-mic transformations because of the heteroge
-neity of variance. Because the impedance indi -ces in the COPD and asthma subgroups were not normally distributed, we also compared
them with independent t-tests following loga
-rithmic transformations. The gender distribu -tions were compared with Chi-square analyses. Receiver Operating Characteristic curve was
used to analysis the power of IOS parameters to differentiate COPD from asthma patients.
At last, we used discriminant analysis to obtain
the correct classification of COPD and asthma
[image:3.612.94.523.96.336.2]patients using spirometary and IOS para- meters.
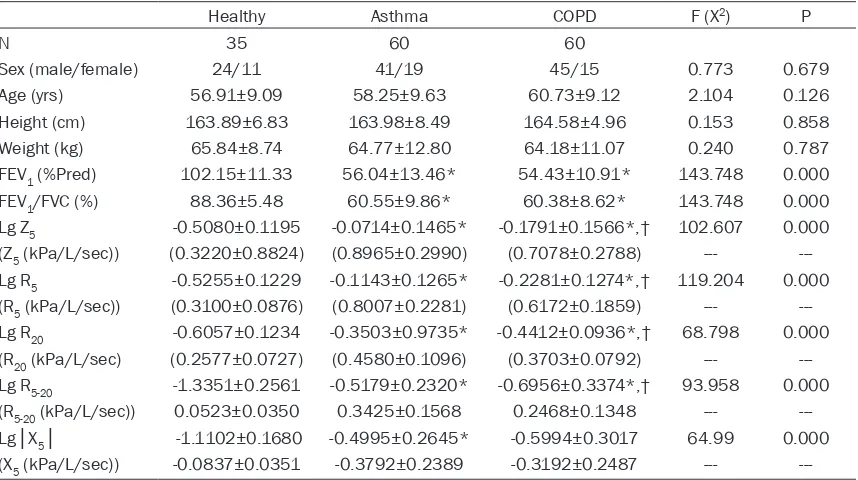
Table 1. Comparison of the baseline characteristics and spirometry parameters and IOS parameters
between the COPD, asthma, and healthy groups
Healthy Asthma COPD F (X2) P
N 35 60 60
Sex (male/female) 24/11 41/19 45/15 0.773 0.679
Age (yrs) 56.91±9.09 58.25±9.63 60.73±9.12 2.104 0.126
Height (cm) 163.89±6.83 163.98±8.49 164.58±4.96 0.153 0.858
Weight (kg) 65.84±8.74 64.77±12.80 64.18±11.07 0.240 0.787
FEV1 (%Pred) 102.15±11.33 56.04±13.46* 54.43±10.91* 143.748 0.000
FEV1/FVC (%) 88.36±5.48 60.55±9.86* 60.38±8.62* 143.748 0.000
Lg Z5 -0.5080±0.1195 -0.0714±0.1465* -0.1791±0.1566*,† 102.607 0.000
(Z5 (kPa/L/sec)) (0.3220±0.8824) (0.8965±0.2990) (0.7078±0.2788) ---
---Lg R5 -0.5255±0.1229 -0.1143±0.1265* -0.2281±0.1274*,† 119.204 0.000
(R5 (kPa/L/sec)) (0.3100±0.0876) (0.8007±0.2281) (0.6172±0.1859) ---
---Lg R20 -0.6057±0.1234 -0.3503±0.9735* -0.4412±0.0936*,† 68.798 0.000
(R20 (kPa/L/sec) (0.2577±0.0727) (0.4580±0.1096) (0.3703±0.0792) ---
---Lg R5-20 -1.3351±0.2561 -0.5179±0.2320* -0.6956±0.3374*,† 93.958 0.000
(R5-20 (kPa/L/sec)) 0.0523±0.0350 0.3425±0.1568 0.2468±0.1348 ---
---Lg│X5│ -1.1102±0.1680 -0.4995±0.2645* -0.5994±0.3017 64.99 0.000
(X5 (kPa/L/sec)) -0.0837±0.0351 -0.3792±0.2389 -0.3192±0.2487 ---
Results
Comparisons of the base-line characteristics, FEV1s and FEV1/FVCs between the COPD, asthma, and hHealthy groups
There were no differences in
sex, age, weight, or height between the COPD, asthma, and healthy groups. Mean- while, the FEV1 and FEV1/FVC
values exhibited no differenc -es between the COPD and asthma groups, though they were both decreased com-pared with health group (Table 1). In the asthma group, the impedance
indi-ces, including Z5, R5, R20, and
R5-20 which were compared by
their logarithmic transforma
-tions, were significantly great -er than those in the COPD group (P < 0.05).
Comparison of the imped-ance indices between the COPD and asthma subgroups
at each airflow limitation level
The sex, age, weight, height,
FEV1, and FEV1/FVC values
did not differ significantly
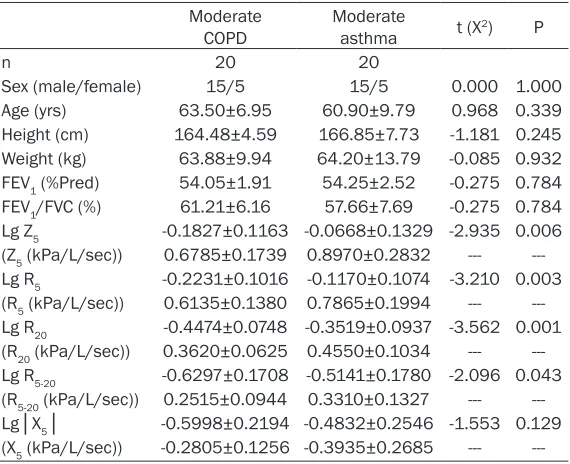
between the mild COPD and mild asthma subgroups.
However, the Z5, R5, R20, and R5-20 values in the mild asth-ma subgroup were greater
than those of the mild COPD
subgroup (Table 2).
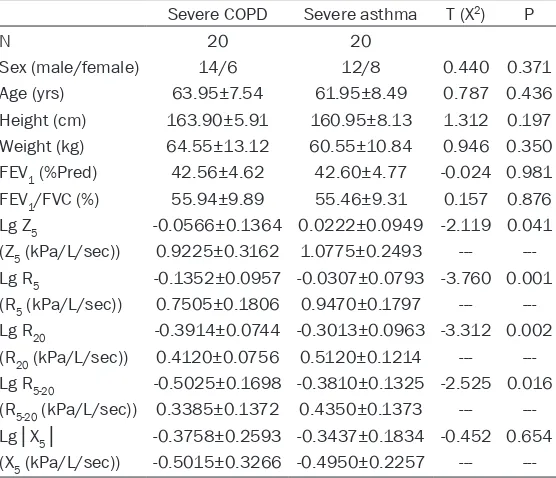
Similar to the above results, the sex, age, weight, height, FEV1, and FEV1/FVC values
also exhibited no significant differences between the mod -erate subgroups or the be- tween the severe subgroups.
[image:4.612.91.375.107.328.2]However, the Z5, R5, R20, and R5-20 in values of the moder -ate and severe asthma sub-groups were greater than Table 2. Comparison of the baseline characteristics and spirom
-etry parameters and IOS parameters between the mild COPD and mild asthma subgroups
Mild COPD Mild asthma t (X2) P
n 20 20
Sex (male/female) 16/4 14/6 0.533 0.358
Age (yrs) 54.75±9.81 51.90±7.46 1.034 0.308
Height (cm) 165.35±4.39 164.15±8.93 0.539 0.593
Weight (kg) 64.10±10.67 69.15±12.86 -1.362 0.181
FEV1 (%Pred) 66.68±6.17 71.29±9.74 -1.786 0.082
FEV1/FVC (%) 64.00±7.72 68.53±7.28 -1.908 0.064
Lg Z5 -0.2979±0.1157 -0.1694±0.1435 -3.116 0.003
(Z5 (kPa/L/sec)) 0.5225±0.1597 0.7150±0.2570 ---
---Lg R5 -0.3260±0.1084 -0.1951±0.1329 -3.413 0.002
(R5 (kPa/L/sec)) 0.4875±0.1389 0.6685±0.2200 ---
---Lg R20 -0.4847±0.1070 -0.3976±0.0805 -2.910 0.006
(R20 (kPa/L/sec)) 0.3370±0.0824 0.4070±0.0776 ---
---Lg R5-20 -0.8994±0.3568 -0.6595±0.2776 -2.350 0.024
(R5-20 (kPa/L/sec)) 0.1505±0.1004 0.2615±0.1543 ---
---Lg│X5│ -0.8225±0.2497 -0.6715±0.2486 -1.916 0.063
(X5 (kPa/L/sec)) -0.1755±0.1066 -0.2490±0.1486 ---
---Z5, respiratory impedance at 5 Hz; R5, respiratory resistance at 5 Hz; R20, respira-tory resistance at 20 Hz; R5-20, difference in resistance between 5 Hz and 20 Hz; X5, reactance at 5 Hz; FEV1, forced expiratory volume in 1 s; FVC, forced expiratory volume; Pred, predicted; yrs, years; cm, centimetres; kg, kilogram; kPa, kilopascal; L, litre; sec, seconds.
Table 3. Comparison of the baseline characteristics and spirom -etry parameters and IOS parameters between the moderate COPD and moderate asthma subgroups
Moderate
COPD Moderate asthma t (X2) P
n 20 20
Sex (male/female) 15/5 15/5 0.000 1.000
Age (yrs) 63.50±6.95 60.90±9.79 0.968 0.339
Height (cm) 164.48±4.59 166.85±7.73 -1.181 0.245
Weight (kg) 63.88±9.94 64.20±13.79 -0.085 0.932
FEV1 (%Pred) 54.05±1.91 54.25±2.52 -0.275 0.784
FEV1/FVC (%) 61.21±6.16 57.66±7.69 -0.275 0.784
Lg Z5 -0.1827±0.1163 -0.0668±0.1329 -2.935 0.006
(Z5 (kPa/L/sec)) 0.6785±0.1739 0.8970±0.2832 ---
---Lg R5 -0.2231±0.1016 -0.1170±0.1074 -3.210 0.003
(R5 (kPa/L/sec)) 0.6135±0.1380 0.7865±0.1994 ---
---Lg R20 -0.4474±0.0748 -0.3519±0.0937 -3.562 0.001
(R20 (kPa/L/sec)) 0.3620±0.0625 0.4550±0.1034 ---
---Lg R5-20 -0.6297±0.1708 -0.5141±0.1780 -2.096 0.043
(R5-20 (kPa/L/sec)) 0.2515±0.0944 0.3310±0.1327 ---
---Lg│X5│ -0.5998±0.2194 -0.4832±0.2546 -1.553 0.129
(X5 (kPa/L/sec)) -0.2805±0.1256 -0.3935±0.2685 --- ---Z5, respiratory impedance at 5 Hz; R5, respiratory resistance at 5 Hz; R20, respiratory resistance at 20 Hz; R5-20, difference in resistance between 5
Hz and 20 Hz; X5, reactance at 5 Hz; FEV1, forced expiratory volume in 1 s; FVC, forced expiratory volume; Pred, predicted; yrs, years; cm, centime
[image:4.612.92.377.437.669.2]those of the moderate and severe COPD sub -groups (Tables 3 and 4).
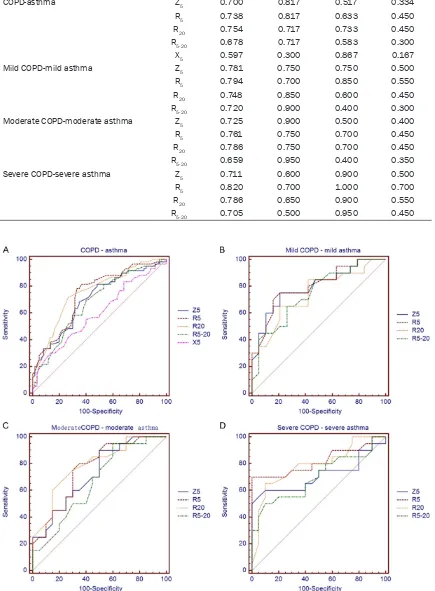
ROC curve analysis between COPD and asth -ma patients
ROC curve analysis showed that AUC of most
IOS parameters except R5-20 and X5 were higher than 0.7 between each paired COPD and
asth-ma group. Their sensitivity and specificity were
shown in Table 5 (Table 5 and Figure 1).
Correct classification between COPD and asth -ma patients using FEV1, FEV1/FVC together with Z5, R5 and R20 through discriminant analy-sis
Combining FEV1, FEV1/FVC and IOS parame-ters including Z5, R5 and R20 eighty to ninety percent COPD patients can be correctly
classi-fied. However, the correct classification ratio of asthma patients was not so high. The whole classification ratio was more than seventy-five
percent (Table 6).
Discussion
Many studies have utilised IOS
values in investigations of
asthma and COPD patients [25, 26]. As previously report-ed, IOS parameters can be
used to detect expiratory flow
limitations [15, 19, 27, 28], and some IOS parameters
have also been confirmed to
be well correlated with the FEV1 and to be even more sen-sitive in some conditions [27-29]. However, few articles have reported on the differ -ences in impedance measured with IOS between asthma and COPD patients with the same
airflow limitation levels. In clinical practice, these differ -ences may help us to distin-guish between COPD and asthma to some extent.
In the present study, we first
compared the impedance indi-ces between the whole COPD
[image:5.612.93.371.109.348.2]and asthma groups and found
Table 4. Comparison of the baseline characteristics and spirom -etry parameters and IOS parameters between the severe COPD and severe asthma subgroups
Severe COPD Severe asthma T (X2) P
N 20 20
Sex (male/female) 14/6 12/8 0.440 0.371
Age (yrs) 63.95±7.54 61.95±8.49 0.787 0.436
Height (cm) 163.90±5.91 160.95±8.13 1.312 0.197
Weight (kg) 64.55±13.12 60.55±10.84 0.946 0.350
FEV1 (%Pred) 42.56±4.62 42.60±4.77 -0.024 0.981
FEV1/FVC (%) 55.94±9.89 55.46±9.31 0.157 0.876
Lg Z5 -0.0566±0.1364 0.0222±0.0949 -2.119 0.041
(Z5 (kPa/L/sec)) 0.9225±0.3162 1.0775±0.2493 ---
---Lg R5 -0.1352±0.0957 -0.0307±0.0793 -3.760 0.001
(R5 (kPa/L/sec)) 0.7505±0.1806 0.9470±0.1797 ---
---Lg R20 -0.3914±0.0744 -0.3013±0.0963 -3.312 0.002
(R20 (kPa/L/sec)) 0.4120±0.0756 0.5120±0.1214 ---
---Lg R5-20 -0.5025±0.1698 -0.3810±0.1325 -2.525 0.016 (R5-20 (kPa/L/sec)) 0.3385±0.1372 0.4350±0.1373 ---
---Lg│X5│ -0.3758±0.2593 -0.3437±0.1834 -0.452 0.654
(X5 (kPa/L/sec)) -0.5015±0.3266 -0.4950±0.2257 ---
---Z5, respiratory impedance at 5 Hz; R5, respiratory resistance at 5 Hz; R20, respira-tory resistance at 20 Hz; R5-20, difference in resistance between 5 Hz and 20 Hz; X5, reactance at 5 Hz; FEV1, forced expiratory volume in 1 s; FVC, forced expiratory volume; Pred, predicted; yrs, years; cm, centimetres; kg, kilogram; kPa, kilopascal; L, litre; sec, seconds.
that the impedance values (Z5, R5, R20, and R5-20) were significantly greater in the asthma
patients than the COPD patients. In 2010,
Shintarou Kandal et al. ever compared the impedances of asthma patients, COPD patients and healthy volunteers and found that the, FEV1
% Pred in the COPD group (55.3±2.3) was
smaller than that of the asthma group (79.5±2.9). However, the Z5 and R5 have not previously been observed to be greater in COPD
patients than in asthma patients. The R20 value
has been found to be higher in asthma patients
[30]. According to the results of these authors,
the impedance in asthma patients should be greater than that in COPD patients at the same
levels of airflow limitation. Our results con
-firmed this hypothesis. There are two main fac -tors leading to this phenomenon. As we know,
indices of airflow limitation including FEV1 and FEV1/FVC are measured in a forced way.
However, subjects should only breathe
normal-ly when performing IOS. The different measur
-ing way may cause different IOS parameters’
Table 5. ROC curve analysis using IOS parameters in each paired COPD and asthma groups
Groups IOS AUC Sensitivity Specificity Youden index
COPD-asthma Z5 0.700 0.817 0.517 0.334
R5 0.738 0.817 0.633 0.450
R20 0.754 0.717 0.733 0.450
R5-20 0.678 0.717 0.583 0.300
X5 0.597 0.300 0.867 0.167
Mild COPD-mild asthma Z5 0.781 0.750 0.750 0.500
R5 0.794 0.700 0.850 0.550
R20 0.748 0.850 0.600 0.450
R5-20 0.720 0.900 0.400 0.300
Moderate COPD-moderate asthma Z5 0.725 0.900 0.500 0.400
R5 0.761 0.750 0.700 0.450
R20 0.786 0.750 0.700 0.450
R5-20 0.659 0.950 0.400 0.350
Severe COPD-severe asthma Z5 0.711 0.600 0.900 0.500
R5 0.820 0.700 1.000 0.700
R20 0.786 0.650 0.900 0.550
R5-20 0.705 0.500 0.950 0.450
[image:6.612.90.525.103.694.2]although they share the same level of airflow
limitation. On the other hand, no matter
IOS parameters or limitation indices are influ
-enced by more than one kind of pathological
changes. Meanwhile, COPD and asthma patients not only share some common
patho-logical changes, they also have lots of different changes. This factor can also lead to the results
in our study.
To examine the differences of IOS parameters between asthma and COPD patients with differ
-ent levels of airflow limitations, we divided the
asthma and COPD patients into three
sub-groups. The baseline characteristics and air
-flow limitations of the COPD and asthma sub
-groups exhibited no significant differences, but the above IOS parameters’ values of the asth
-ma patients were greater than those of the COPD patients at each airflow limitation severi
-ty level, and these findings were consistent with results from the overall COPD and asthma groups. These results suggest that the imped
-ances of asthma patients are greater than those of COPD patients at each airflow limita -tion level.
The differences make it possible to differenti -ate COPD and asthma patients by IOS
meas-urement. Through ROC analysis, we found that Z5, R5 and R20 were valuable to distinguish
COPD and asthma patients in each airflow limi
-tation level, with all of their their AUCs greater than 0.7. Therefore, IOS parameters may pro
-vide help to identify these two obstructive lung
diseases when spirometry cannot be
per-formed in some patients. When combining
spirometry and IOS parameters, more than 75
percent patients were correctly classified
through discriminant analysis. And in severe patients, the percentage was as high as 85%,
which suggested that the combination of IOS
and spirometry have power to distinguish COPD
and asthma patients with the same airflow limi -tation level.
The shortcoming of our study is that a relatively small number of patients were enrolled.
Additional research involving larger samples
should be performed for further analysis.
Moreover, because IOS is applied extensively in
clinical practice, changes of respiratory imped -ance should be observed with measures other
than airflow limitation indices because these other measures may aid the elucidation of pathological aspects of diseases.
Conclusions
Although COPD and asthma are both obstruc-tive lung diseases, these conditions exhibited
differences in many aspects including aspects of lung function. The measurements of respira -tory impedances require only normal breathing,
and the results of such measurements were
greater in the asthma patients than the COPD
patients after controlling for the level of airflow limitation. The differences may provide help to differentiate between COPD and asthma
patients.
Acknowledgements
This work was funded by the Outstanding Young Medical Talents Training Program of Pudong Health Bureau of Shanghai (Grant No.
PWRq2013-07), Science and technology
devel-opment fund of Pudong Health Bureau of Shanghai (PW2015B-14), and Key Discipline Construction Project of the Pudong Health Bureau of Shanghai (Grant No. PWZx2014-12). We thank Shanshan Li, Linxuan Wang, Zhijun Tang, Guoping Deng, Xiaolong Gu, Xuanbo
Chen, Xiaochi Wu, Huili Feng, Fang Fang, and
Yuhong Yin for subject recruitment.
Disclosure of conflict of interest
None.
Address correspondence to: Wen-Chao Gu, De-
[image:7.612.85.522.98.173.2]partment of Respiratory Medicine, Shanghai Pudong Table 6. The correct classification between COPD and asthma using spirometary and IOS parameters
through discriminant analysis
Predicted Initial
COPD/Asthma (Correct
classification)
Mild COPD/Mild asthma (Correct
classification)
Moderate COPD/ Moderate asthma
(Correct classification)
Severe COPD/ Severe asthma
(Correct classification)
COPD 50/10 (83.3%) 18/2 (90.0%) 17/3 (85.0%) 18/2 (90.0%)
Asthma 19/41 (68.3%) 8/12 (60.0%) 6/14 (70.0%) 4/16 (80.0%)
New Area People’ s Hospital, No. 490, South Chuanhuan Road, Pudong New Area, Shanghai,
China. Tel: 58981990; Fax:
+86-21-58902950; E-mail: [email protected]
References
[1] Global Initiative for Asthma. Global strategy for
asthma management and prevention 2014 (revision) 2014. [accessed on May 14 2014]. Available at http://www.ginasthma.org/docu-ments/4.
[2] Global Initiative for Chronic Obstructive Lung Disease (GOLD). Global Strategy for the Diagnosis, Management, and Prevention of
Chronic Obstructive Pulmonary Disease. 2015.
Updated 2015. http://www.goldcopd.org/up
-loads/users/files/GOLD_Report_2015.pdf
[accessed 13.02.15].
[3] Porsbjerg C, Lange P, Ulrik CS. Lung function impairment increases with age of diagnosis in
adult onset asthma. Respir Med 2015; 109: 821-827.
[4] Gube M, Brand P, Conventz A, Ebel J, Goeen T, Holzinger K, Müller-Lux A, Reisgen U, Schettgen T, Kraus T. Spirometry, impulse oscillometry
and capnovolumetry in welders and healthy male subjects. Respir Med 2009; 103: 1350-1357.
[5] Qi GS, Gu WC, Yang WL, Xi F, Wu H, Liu JM. The ability of volumetric capnography to distin -guish between chronic obstructive pulmonary
disease patients and normal subjects. Lung
2014; 192: 661-668.
[6] Qi GS, Zhou ZC, Gu WC, Xi F, Wu H, Yang WL, Liu JM. Detection of the airway obstruction
stage in asthma using impulse oscillometry system. J Asthma 2013; 50: 45-51.
[7] Brashier B, Salvi S. Measuring lung function using sound waves: role of the forced oscilla -tion technique and impulse oscillometry sys-tem. Breathe 2015; 11: 57-65.
[8] Meraz EG, Nazeran H, Ramos CD, Nava P, Diong B, Goldman MD, Goldman CA. Analysis
of impulse oscillometric measures of lung function and respiratory system model param -eters in small airway-impaired and healthy chil-dren over a 2-year period. Biomed Eng Online 2011; 10: 21.
[9] Dubois AB, Brody AW, Lewis DH, Burgess BF Jr. Oscillation mechanics of lungs and chest in
man. J Appl Physiol 1956; 8: 587-594. [10] Hellinckx J, Cauberghs M, De Boeck K,
Demedts M. Evaluation of impulse oscillation system: comparison with forced oscillation
technique and body plethysmography. Eur Respir J 2001; 18: 564-570.
[11] Schulz H, Flexeder C, Behr J, Heier M, Holle R, Huber RM, Jörres RA, Nowak D, Peters A,
Wichmann HE, Heinrich J, Karrasch S; KORA Study Group. Reference values of impulse os
-cillometric lung function indices in adults of advanced age. PLoS One 2013; 8: e63366.
[12] Al-Mutairi SS, Sharma PN, Al-Alawi A, Al-Deen JS. Impulse oscillometry: an alternative
modal-ity to the conventional pulmonary function test
to categorise obstructive pulmonary disorders. Clin Exp Med 2007; 7: 56-64.
[13] Anderson WJ, Lipworth BJ. Relationships be -tween impulse oscillometry, spirometry and dyspnoea in COPD. J R Coll Phys Edinb 2012; 42: 111-115.
[14] Kolsum U, Borrill Z, Roy K, Starkey C, Vestbo J,
Houghton C, Singh D. Impulse oscillometry in
COPD: identification of measurements related
to airway obstruction, airway conductance and lung volumes. Respir Med 2009; 103: 136-143.
[15] Komarow HD, Skinner J, Young M, Gaskins D, Nelson C, Gergen PJ, Metcalfe DD. A study of the use of impulse oscillometry in the evalua
-tion of children with asthma: analysis of lung parameters, order effect, and utility compared
with spirometry. Pediatr Pulmonol 2012; 47: 18-26.
[16] Shi Y, Aledia AS, Tatavoosian AV, Vijayalakshmi
S, Galant SP, George SC. Relating small air-ways to asthma control by using impulse oscil-lometry in children. J Allergy Clin Immunol 2012; 129: 671-678.
[17] Song TW, Kim KW, Kim ES, Kim KE, Sohn MH.
Correlation between spirometry and impulse oscillometry in children with asthma. Acta Paediatr 2008; 97: 51-54.
[18] Cavalcanti JV, Lopes AJ, Jansen JM, Melo PL. Detection of changes in respiratory mechanics due to increasing degrees of airway obstruc
-tion in asthma by the forced oscilla-tion tech -nique. Respir Med 2006; 100: 2207-2219. [19] Dellacà RL, Santus P, Aliverti A, Stevenson N,
Centanni S, Macklem PT, Pedotti A, Calverley PM. Detection of expiratory flow limitation in COPD using the forced oscillation technique.
Eur Respir J 2004; 23: 232-240.
[20] Di Mango AM, Lopes AJ, Jansen JM, Melo PL.
Changes in respiratory mechanics with
in-creasing degrees of airway obstruction in COPD: detection by forced oscillation tech -nique. Respir Med 2006; 100: 399-410. [21] Evans TM, Rundell KW, Beck KC, Levine AM,
Baumann JM. Airway narrowing measured by
spirometry and impulse oscillometry following
room temperature and cold temperature exer-cise. Chest 2005; 128: 2412-2419.
[22] Lee JH, Lee YW, Shin YS, Jung YH, Hong CS,
[23] Vink GR, Arets HG, van der Laag J, van der Ent CK. Impulse oscillometry: a measure for airway
obstruction. Pediatr Pulmonol 2003; 35: 214-219.
[24] Pellegrino R, Viegi G, Brusasco V, Crapo RO, Burgos F, Casaburi R, Coates A, van der Grinten
CP, Gustafsson P, Hankinson J, Jensen R, Johnson DC, MacIntyre N, McKay R, Miller
MR, Navajas D, Pedersen OF, Wanger J.
Interpretative strategies for lung function tests.
Eur Respir J 2005; 26: 948-968.
[25] Kim CW, Kim JS, Park JW, Hong CS. Clinical ap
-plications of forced oscillation techniques (FOT) in patients with bronchial asthma. Korean J Intern Med 2001; 16: 80-86.
[26] Horsman TA, Duke RK, Davenport PW. Airway
response to mannitol challenge in asthmatic children using impulse oscillometry. J Asthma 2009; 46: 600-603.
[27] Evans TM, Rundell KW, Beck KC, Levine AM,
Baumann JM. Impulse oscillometry is sensitive
to bronchoconstriction after eucapnic volun -tary hyperventilation or exercise. J Asthma 2006; 43: 49-55.
[28] Frantz S, Nihlén U, Dencker M, Engström G, Löfdahl CG, Wollmer P. Impulse oscillometry may be of value in detecting early manifesta
-tions of COPD. Respir Med 2012; 106:
1116-1123.
[29] Guan WJ, Zheng JP, Gao Y, Jiang CY, Shi X, Xie YQ, Liu QX, Jiang M, An JY, Yu XX, Liu WT, Zhong LP, Wu ZP, Zhong NS. Impulse Oscillometry for Leukotriene D4 Inhalation Challenge in
Asthma. Respir Care 2013; 58: 2120-2126. [30] Kanda S, Fujimoto K, Komatsu Y, Yasuo M,
Hanaoka M, Kubo K. Evaluation of respiratory