What is the impact of raw MT on Japanese users of Word: preliminary
results of a usability study using eye-tracking
Ana Guerberof
ADAPT/SALIS
Dublin City University
ana.guerberof@dcu.ie
Joss Moorkens
ADAPT/SALIS
Dublin City University
joss.moorkens@dcu.ie
Sharon O’Brien
ADAPT/SALIS
Dublin City University
sharon.obrien@dcu.ie
Abstract
This paper presents preliminary results of a study of Japanese native speakers working with the Microsoft Word application in two modalities: the released Japanese version and a machine translated (MT) version (the raw MT strings incorporated into the MS Word interface). To explore the effect of translation modality on task completion, time and satisfaction, an experiment using an eye-tracker was set up with a group of 42 users: 22 native Japanese and 20 native English speakers. The results suggest that Japanese-native speakers have higher completion scores and are more efficient when working with the released versions of the product than with the MT version, but these differences are not significant. Their self-reported satisfaction, however, is significantly higher when working with the released product as opposed to the raw MT version.
1
Introduction
In the commercial arena, the software and localization industries face long-term business challenges. There is an increase in the volume of software to localize, and this software needs to run on several platforms. Moreover, the software is delivered to the user in a rapid cycle, with daily, weekly, and quarterly updates and releases. In parallel, there are continuous advances in machine translation (MT) technology with the full implementation of statistical engines and rapid advances in neural MT solutions. Therefore, it is only logical to marry the use of new technology with localization of software products with the aid
© 2019 The authors. This article is licensed under a Creative Commons 4.0 licence, no derivative works, attribution, CCBY-ND.
of automation where possible, as long as this can be achieved without hindering the user experience and, hence, the commercial viability of that product. Large software corporations have, in fact, implemented MT and post-editing (PE) cycles as part of their localization processes for some time now. However, as MT technology advances, several questions come to mind: is it possible to apply raw (i.e. unedited) MT to certain components of the user interface without hindering the user experience? Where raw MT is employed, how does linguistic quality impact the user experience?
Preliminary results are presented here from a usability experiment involving Japanese and English native speakers using an eye-tracker. The Japanese participants were presented with two Microsoft Word applications: one was the Japanese-released version (referred as HT hereafter), and the other one was a version translated from English into Japanese with MT specifically for this experiment (referred as MT hereafter). English speakers were presented with one Word application (to act as the control group). The different versions (HT, MT and English) are referred as scenarios. Both groups had to perform the same six tasks.
2
Related work
Logically, there has been an increase in academic and commercial research to find out more about aspects related to MTPE activity with the translator as the central figure of studies (i.e., De Almeida and O’Brien, 2010; Guerberof, 2012; Moorkens et al., 2015; O’Brien, 2006; Plitt and Masselot, 2010). However, less attention has been paid to end user reception of products processed using MT. In many cases, translators’ evaluation of MT output has been considered equivalent to end users’ opinions of MT.
Some research has tried to fill this gap by analysing the usability aspect of MT in different products. Experiments have been designed to ascertain whether users understood instructions translated using MT in comparison to those using either the original text or MTPE (Castilho et al., 2014; Doherty and O’Brien, 2012, 2014; O’Brien and Castilho, 2016). The results show that usability is increased when users read either the original text or text that has been post-edited, even with minimal changes (light post-editing), when compared to raw MT output. However, users could complete most tasks by using the latter even if this activity took longer or if the experience was less satisfactory. Results, however, were not equal for all languages tested.
Bowker (2015) studied the difference in user experience when reading text on websites and translatability rules were applied (a set of guidelines applied to the source to improve MT). She found that the user experience of source-language readers decreases when these rules are applied, while that of the target-language readers (Spanish, in this case) increases. As a follow up to this research, Bowker and Buitrago Ciro (2018) replicated this experiment with more participants (Spanish, French Canadian and Italian) with similar findings. When the text was post-edited, however, readers preferred the texts that had been translated without translatability rules applied to the source.
The most extensive research on measuring acceptability of machine translated enterprise content by users was carried out by Castilho as part of her doctoral study (2016). In this work, Castilho shows that the PE quality level has a significant effect on acceptability by German, Chinese and Japanese users of enterprise content. She also highlights, however, that the raw MT versions were usable, and participants were still able to perform the assigned tasks with these instructions. Because of its relevant content (Microsoft Excel) and design, this research draws heavily on Castilho’s work.
Castilho and Guerberof (2018) explored reading comprehension for Spanish and Chinese users when using SMT and NMT engines to translate an IELTs (International English Language Testing System) test. The authors found that users from the target languages completed more tasks in less time with a higher level of satisfaction when using translations from the NMT system.
Using a questionnaire, Van Edgom and Pluymaekers (2019) examined how different degrees of PE (minimal, light, moderate, and full) impact the user who read two different types of texts (informative and instructive texts) that had been post-edited. They concluded that different degrees of PE “make a difference” (idem., 168). However, the distinctions between, for example moderate and full PE, was not obvious to the users.
Screen (2019) looked at the English and Welsh language pair. He used an eye-tracker to measure fixations while participants read a post-edited text and a translated text. After this task, the participants rated the texts according to readability and comprehensibility. He found no statistical differences between the two groups.
Although this research feeds from the existing literature, it introduces some novel changes: participants are instructed to complete tasks in a software application in which raw MT is used for the user interface rather than testing the instructions to complete those tasks or the understanding of a “regular” text. Participants are not only queried about their satisfaction and eye-tracked, a retrospective think aloud protocol is put in place after task completion to understand what the participants thought, felt, and did when working with the three scenarios (HT, MT and English).
3
Methodology
To explore the topic of usability and translation modality further, a within-subject experiment was designed to compare MS Word translated from English using raw Japanese MT (MT) and a released version of that same product (HT).
Since the number of participants that were available to participate was limited due to the location and the time available, a within-subject experiment was the best option to have enough participants for a statistical analysis.
3.1 Research questions
RQ1: Will users perform the same number of successful tasks regardless of the scenario used (English original version, MT, or HT)?
RQ2: Will there be differences in time when participants perform the tasks in the different scenarios (English, MT or HT)?
RQ3: Will the participants be equally satisfied when using the English, MT or HT scenario?
RQ4: Will participants expend different amounts of cognitive effort when performing the tasks in different scenarios?
3.2 Measuring usability
Following specific studies on usability mentioned in this paper (Castilho et al., 2014; Castilho, 2016; Doherty and O’Brien, 2012, 2014), usability was defined as per the ISO/TR 16982 guidelines: “the extent to which a product can be used by specified users to achieve specified goals with effectiveness, efficiency, and satisfaction in a specified content of use” (ISO 2002).2
Effectiveness was measured through task completion. Users were presented with tasks to complete through interaction with different components of the user interfaces. The more tasks the user completed following specific instructions, the higher the effectiveness score was (from 0 to 100). The following formula was used to calculate the Effectiveness score:
# 𝑡𝑎𝑠𝑘𝑠 𝑐𝑜𝑚𝑝𝑙𝑒𝑡𝑒𝑑 𝑠𝑢𝑐𝑐𝑒𝑠𝑠𝑓𝑢𝑙𝑙𝑦
𝑡𝑜𝑡𝑎𝑙 # 𝑡𝑎𝑠𝑘𝑠 𝑥 100 = 𝑒𝑓𝑓𝑒𝑐𝑡𝑖𝑣𝑒𝑛𝑒𝑠𝑠
Efficiency was measured considering the tasks that were completed in relation to the time it took to complete those tasks. If less time was invested to complete a task, then the efficiency score was higher, and vice versa. The following formula was used to calculate the efficiency rate:
∑ 𝑎𝑐𝑐𝑢𝑟𝑎𝑐𝑦
𝑡𝑜𝑡𝑎𝑙 𝑡𝑎𝑠𝑘 𝑡𝑖𝑚𝑒 𝑖𝑛 𝑠𝑒𝑐𝑠× 100
𝑤ℎ𝑒𝑟𝑒 𝑡𝑎𝑠𝑘 𝑠𝑢𝑐𝑐𝑒𝑠𝑠𝑒𝑠
𝑡𝑜𝑡𝑎𝑙 𝑡𝑎𝑠𝑘𝑠 × 100 = 𝑎𝑐𝑐𝑢𝑟𝑎𝑐𝑦
Efficiency was also measured in terms of cognitive effort using an eye-tracking device. Fixation duration (total length of fixation in an area of interest or AOI), fixation count (total number of fixations within an AOI) were measured. Eye-tracking has been established as an adequate tool to measure cognitive effort in MT
2 International Organization for Standardization. 2002.
ISO/TR 16982: Ergonomics of human-system interaction – Usability methods supporting human centered design.
studies (Doherty and O’Brien, 2009; Doherty et al., 2010).
Satisfaction was measured through an IBM After-Scenario Questionnaire (Lewis, 1995) containing a series of statements that users rated. This questionnaire was chosen instead of other frequently used questionnaires such as SUS (Software Usability Scale) or Post-Study System Usability Questionnaire (PSSUQ) because, in this project, two set of tasks (1, 2, 3 and 4, 5, 6) were assessed while the other questionnaires are better suited to rate an entire system. The ASQ has three questions to rate on a 7-point Likert-type scale. This test was modified to address the language factor in two questions to differentiate between the quality in the instructions and in the Word as follows:
1. Overall, I am satisfied with the ease of completing the tasks in this scenario.
2. Overall, I am satisfied with the time it took to complete the tasks in this scenario.
3. Overall, I am satisfied with the instructions given for completing the tasks.
4. Overall, I am satisfied with the language used in the Word menus, dialog boxes and buttons. The participants could rate between 1 (Strongly agree) to 7 (Strongly disagree). Question 3 was added, even if it does not refer to MS Word specifically, because participants always worked with the Instruction windows visible.
3.3 Content and Design
In collaboration with Microsoft Ireland, the business partner for this research project, the different applications that form part of the Office suite were analyzed. Finally, Word was chosen as the optimal application for the experiment. This was firstly because the study sought to reach as many participants as possible and Word is the most popular application in the suite, and secondly, because it was important to measure the impact of translation modality as opposed to the users’ skills or knowledge when using an application, and Word is a relatively easy application to use.
The set of languages analyzed here were English, and Japanese. English was chosen to be used as the control group and Japanese was chosen because it is a language traditionally considered to be difficult for MT.
Available on-line
The software version used was Microsoft Word 2016 MSO (16.0.9126.2315) 32-bit in English and in Japanese. The providers’ translation cycle involves MT and full PE. The final quality of the translation delivered by the service provider is equal to publishable quality as defined in the localization instructions and the quality evaluation channels the localization assets go through. It is relevant to note that the localization process might involve translating with no previous reference, but, in general, it includes MT and translation memories, among other reference material, as well as a review cycle.
A specially-devised version of Word was used for the Japanese MT scenario, translated from English using the business partner’s highly-customized Microsoft Translator SMT.3 At the
time of implementing this experimental setup, customized Microsoft NMT was not available.
A warm-up task and 6 subsequent tasks were selected. The criteria for selection were that they contained enough text so as to measure the translation modality, that they were coded for telemetry purposes (for a second phase of this experimental project), that they could be performed in all the languages tested (German, Spanish, Japanese and English), and that they were relatively new or non-standard so as to minimize the effect of previous experience.
The warm-up task involved selecting a paragraph and changing the font. The six tasks were: 1) selecting a digital pen and drawing a circle using a defined thickness and color, 2) changing the indentation and spacing for the paragraph (presented to the users), 3) automatically reviewing the document, 4) selecting an option from the Word Options dialog box in the corresponding menu, 5) inserting a section break; and 6) finding the Learning Tools in the corresponding menu and changing the page appearance.
The tasks were evaluated by an English native speaker to test the instructions and the environment. Since it was not possible to analyze the original and translated text with standard readability metrics, a Japanese native speaker evaluated the tasks in the Japanese-released version and in the raw MT environment. This evaluator commented on the high quality of the MT although she signaled the sentences and words that were not idiomatic, wrong, or different from the released version. The errors spotted in the MT scenario in the tasks selected was
3https://hub.microsofttranslator.com/
comparable to the other languages that were going to be included in the project.
The instructions for the experiment were translated using Microsoft’s localization services. They translated the texts following specific instructions to respect the fluency and accuracy of the text and the experimental design.
3.4 Scenarios
Three scenarios (i.e. conditions) were defined for the experiment: MT, HT and English.
The Japanese participants in Group 1 completed three tasks as A) HT, and three tasks as B) MT, while participants in Group 2 were presented the same tasks but in reverse order, that is, B) MT, A) HT. This served to counterbalance the within-subject effect. Between scenarios, there was a brief pause that allowed the researcher to change the Word configuration and recalibrate the eye-tracker.
The English-speaking group were presented with a warm up task and 6 tasks. As with the Japanese group, they had a brief pause between the tasks, replicating the same environment.
3.5 Pre-task questionnaire
The participants were asked to fill in a questionnaire before the experiment. The questionnaire assessed the experience users had in using word-processing applications, Word, their native language and level of English, gender, age, education level, as well as their experience in doing the tasks that were part of the experiment. The questionnaire was provided by email using Google Forms.
3.6 Participants
42 participants took part in the experiment: 20 English-speakers, and 22 Japanese-speakers. 12 Japanese participants were assigned to Group 1 and 10 participants to Group 2.
The reason for the difference in number of Japanese participants is that some eye-tracking data was discarded due to poor recording quality (see Section 3.7). Also, after examination, the data from two EN participants were discarded because of changes in the original set-up (Word version). 75% of participants identified as women and 25% as men. Table 1 shows the age distribution per language.
Age English Japanese
18-24 55% 86%
25-34 17% 9%
35-44 28% 5%
[image:5.595.106.258.236.302.2]Total 18 22
Table 1: Age distribution
The age distribution is important as it might be an indicator of experience with the application. For example, although all of them reported experience using Microsoft Word, the EN group reported a higher level of experience.
Also, when participants were asked about their experience in the 6 experimental tasks, the Japanese group (JP) reported an average experience of 2.1 tasks out of 6 (35.61 %) while the EN group reported an average of 3.8 tasks out of 6 (62.96 %). When they were asked to rate their level of proficiency (i.e. “How would you describe your level of proficiency when working with word-processing applications?”), the average value for the EN was 3.83 in a 5-point Likert scale (1 being Novice and 5 being Very proficient) while the JP selected a 2.14. A Mann-Whitney test for self-reported experience suggests that there is a significant difference in the level of perceived experience between the two groups (U=24 and p<0.05). JP participants reported significantly lower experience than EN participants.
3.7 Experimental setup
The data recording equipment consisted of a Tobii X60 XL, a wide screen eye-tracker with a 24-inch monitor and 60Hz sampling rate, and a laptop computer (Intel Core 1.7 vProtm, 2.00 GHz 2 Core,
4 Logical processors, 8 GB RAM). The laptop was used for stimulus presentation and eye movement recording. The stimuli were presented with a 1600 x 900 resolution. The software used to record and analyze the data was Tobii Studio 3.4.5 1309, Professional Edition. The fixation filter selected was an IV-T Filter provided by the manufacturer. The filter has a velocity threshold
of 30 degrees, a maximum time between fixations of 75 ms and a maximum angle of 0.5 degrees. Fixations under 60 ms were discarded.
The participants were calibrated using a nine-point calibration screen (automatic). The participants were recalibrated if the Tobii system reported a poor calibration or if the calibration points were not clearly defined within the calibration grid. The optimal distance to the eye-tracker was set as 67 cm. However, this varied as the participants were not tested using a chin rest to preserve ecological validity during the experiment.
To estimate the cognitive effort using an eye-tracker, two Areas of Interest (AOIs) were defined. One AOI comprised the Instructions windows (25.7%, 369516 px) and the Word application window (74%, 1065165 px). Two participants in the JP group moved the screens slightly, therefore the AOIs for these 2 participants were slightly different for the Instructions (22.81%, 328500px) and the Word application (76.9 %, 1107000px) windows.
To test the quality of the sample, the gaze sample data in the Tobii system and the velocity charts were checked. Moreover, the segments of interest were exported (each segment represented a task timeline therefore six segments were exported per participant) to calculate the eye validity codes within these segments. A minimum 80% gaze sample was required for a recording to be considered valid and to be included in the statistical analysis. This meant that each participant had at least one eye or both eyes on the segments 80 per cent of the time.
3.8 Retrospective Think Aloud
Once the participants had completed the tasks, their gaze data was replayed, and they were asked to comment on what they were doing, thinking or feeling during the experiment. The participants were recorded using Flashback Express 5. The interviews took approximately 15 minutes.
The researcher asked certain questions to elicit responses from the participants, such as How did you find this task? What were you thinking at this point? How was the language in this menu? Had you done this task before? Did you notice any difference in Word when you came back from the pause?
3.9 Statistical methods
used. The statistics decisions were made with a significance value of 0.05.
To determine the effect of the scenario (HT, MT and EN) for each response variable (Effectiveness, Efficiency and Satisfaction), a general linear mixed model (called hereafter a mixed model) was adjusted according to the scenario and task groups (1, 2, 3 vs. 4, 5, 6 ) and the interaction between the two (Type III Test). The tasks and scenarios are considered fixed factors and the repeated measures of each participant are included in the model (random effects).
4
Results
4.1 Effectiveness
Table 1 shows that HT evinces higher effectiveness scores on average than the MT scenario in both groups of tasks. The EN group has the highest scores. Figure 1 illustrates these figures clearly.
Tasks/Scenarios N Mean Std
1, 2, 3 HT 12 82.64 9.70
MT 10 74.17 27.06
EN 18 93.98 12.06
4, 5, 6 HT 10 46.67 26.99
MT 12 40.28 29.05
[image:6.595.307.520.295.534.2]EN 18 62.96 34.09
Table 1: Effectiveness
Figure 1: Effectiveness according to scenarios and tasks
A mixed model for effectiveness shows that there are statistically significant differences between scenarios (F(2, 37)=4.26; p=0.0216) and tasks (F(1, 37)=64.73; p<.0001). The estimated mean of effectiveness is 78.47 in EN, 64.65 in HT and 57.22 in MT scenarios.
There are significant differences between scenarios when comparing the EN and MT groups, with 21.25 as the estimated difference. This means that the EN scenario is estimated as 21.25% more effective than the JP MT scenario (in line with findings from Doherty and O’Brien,
2014). The participants in the JP group show higher effectiveness scores in the HT than in the MT scenarios, but this difference is not significant.
Regarding the tasks, the estimated mean is 83.6 in tasks 1, 2, 3 and 49.97 for 4, 5, 6. There are statistically significant differences between tasks. The estimated difference of effectiveness between task 1, 2, 3 and tasks 4, 5, 6 is 33.63%, CI95%=[25.16, 42.09]. The mixed model confirms
that tasks 1, 2, 3 were “easier” for participants than tasks 4, 5, 6.
4.2 Efficiency
As with effectiveness, the efficiency was calculated per scenario and task as shown in Table 2 and Figure 2.
Tasks/Scenario N Mean Std
1, 2, 3 HT 12 31.92 13.89
MT 10 21.13 8.47
EN 18 48.75 19.27
4, 5, 6 HT 10 11.88 9.64
MT 12 9.11 8.08
EN 18 21.63 19.94
Table 2: Efficiency
Figure 2: Efficiency according to scenario and tasks
HT shows higher efficiency on average than the MT scenario in both groups of tasks and the EN group shows the highest efficiency scores.
A mixed model shows that there are statistically significant differences between scenarios (F(2,37)=9.9; p=0.0004) and tasks (F=65.25; p<0.0001). (F(1,37)=65.25; p<.0001). The JP group shows more efficiency in the HT than in the MT scenario, however this difference is not significant. The estimated mean of efficiency is 35.19 in EN, 21.90 in HT and 15.12 in MT.
The EN group has a 13.29 estimated difference with the HT scenario, and an estimated 20.07 difference with the MT scenario. There are no significant differences between the HT and MT scenarios in the JP group.
1, 2, 3 4, 5, 6
T asks 0%
20% 40% 60% 80% 100%
E
ff
e
c
ti
v
e
n
e
ss
English MT HT
Scenario
1, 2, 3 4, 5, 6
T asks 0
20 40 60 80
E
ff
ic
ie
n
c
y
English MT HT
[image:6.595.76.289.358.596.2]Regarding the tasks, the estimated mean for efficiency is 33.93 for tasks 1, 2, 3 and 14.21 for tasks 4, 5 and 6. There are statistically significant differences between tasks. The estimated difference between 1, 2, 3 and 4, 5, 6 is 19.72, CI95%=[14.78, 24.67].
If efficiency is considered, the participants are statistically more efficient in the EN group than in the JP group (in line with Castilho, 2016 and Doherty and O’Brien, 2014). However, if time is analyzed without considering task completion, there are statistically significant differences only between tasks (F(1,37)=20.2; p<.0001) but not between scenarios. The JP group employs less time the HT than in the MT scenario, however this difference is not significant.
The estimated mean of efficiency is 299.61 seconds for tasks 1, 2, 3 and 485.31 seconds for 4, 5, 6. The estimated difference is 185.7 CI95%
=[-269.4, -101.99], it took an average of 3 minutes longer to complete tasks 4, 5, 6.
4.3 Satisfaction
The satisfaction was calculated using the four questions from the post-scenario questionnaire that were ranked by the user on a 7-point Likert-type scale where 1 indicated the most satisfaction and 7, the least. Table 3 shows Satisfaction according to scenarios and tasks.
Tasks/Scenarios N Mean Std
1, 2, 3 HT 12 3.42 1.42
MT 10 3.37 1.14
EN 18 2.13 1.08
4, 5, 6 HT 10 3.40 1.22
MT 12 4.56 1.36
[image:7.595.309.520.71.210.2]EN 18 3.11 1.22
Table 3: Satisfaction*
Table 3 shows that Japanese participants report being more satisfied in the MT in the first part of the experiment and more satisfied in the HT scenario in the second part of the experiment where the difference is higher. The EN group shows the best satisfaction scores. Figure 3 shows this data clearly.
A mixed model shows that there are statistically significant differences between scenarios (F(2,37)=8.08; p=0.0012) and tasks (F(1,37)=21.94; p<0.0001. The estimated mean of satisfaction is 2.62 in EN, 3.41 in HT and 3.96 in MT scenarios.
[image:7.595.75.290.448.534.2]*Lower scores indicate higher satisfaction.
Figure 3: Satisfaction according to scenarios and tasks
There is an estimated difference of -1.34 between EN and MT scenarios, and a -0.55 between HT and MT Scenarios. There are differences between the EN group and the HT scenario (estimated difference=-0.79, stderr=0.38) but this is not significant.
Regarding the tasks, the estimated mean for satisfaction is 2.97 for tasks 1, 2, 3 and 3.69 for tasks 4, 5, 6. There are statistically significant differences between tasks. The estimated difference between 1, 2, 3 and 4, 5, 6 is -0.72, CI95%=[-1.03, -0.41].
The question that specifically addressed the Word application was explored (“Overall, I am satisfied with the language used in the Word menus, dialog boxes and buttons?”). Participants were more satisfied in the HT (M=3.5) than in the MT scenarios (M=4.5). A Wilcoxon signed rank test shows that HT ranks significantly lower than the MT scenario (Z=-2.62, p=0.009). As explained before, a lower score indicates a higher satisfaction. The results show that 3 participants were more satisfied with MT, 12 participants with HT, and in 7 cases MT was ranked alongside HT. If compared to the EN group significant differences are only found with the MT scenario (U= -3.26 and p=0.001).
The results regarding the participants’ satisfaction show they are more satisfied in the EN group than in the JP group (in line with Castilho, 2016 and Doherty and O’Brien, 2014). This could be explained by several factors: the language, the experience (EN group was more experienced and the familiarity could explain a higher satisfaction), but also to the way each culture reports satisfaction. The participants in the JP group are significantly more satisfied in the HT than in the MT scenarios and this was particularly true for the most difficult tasks.
1, 2, 3 4, 5, 6
T asks 0
2 4 6
S
a
ti
sf
a
c
c
io
n
English MT HT
4.4 Cognitive Effort
For these groups the fixation duration and count were calculated as indicators of cognitive load. Fixation duration measures the duration of each individual fixation within an AOI in seconds. Table 4 shows the Fixation duration mean for the Word AOI.
Tasks/Scenario N Mean in seconds
Std
1, 2, 3 HT 10 0.22 0.04
MT 8 0.23 0.03
EN 18 0.21 0.05
4, 5, 6 HT 8 0.21 0.03
MT 10 0.20 0.03
[image:8.595.305.520.71.315.2] [image:8.595.76.288.175.265.2]EN 18 0.18 0.04
Table 4: Fixation duration mean in Word AOI
The mean value for MT is higher than HT in the first tasks, and lower in the second set of tasks, and EN presents the lowest mean value as illustrated in Figure 4.
Figure 4: Fixation duration mean in Word AOI
A mixed model shows that there are statistically significant differences (F(2,33)=25.01; p<0.0001) between tasks, but not between scenarios or the interaction between scenarios and tasks. The estimated mean fixation duration is 0.22 for tasks 1, 2, 3 and 0.20 for 4, 5, 6 tasks. There is an estimated difference of 0.023 seconds CI95%=[0.014, 0.032].
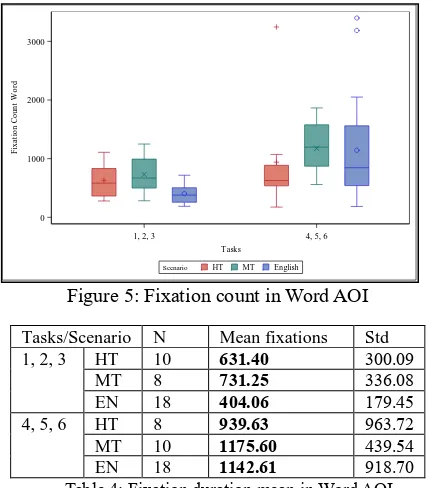
Fixation count measures the number of times the participant fixates on the Word AOI. Figure 5 shows the average fixation count per participant and tasks. There is a lower number of fixations in HT than in MT for both groups of tasks and the EN group shows a lower number of fixations than the HT scenario in the first 3 tasks but not in the second 3 tasks.
Figure 5: Fixation count in Word AOI
Tasks/Scenario N Mean fixations Std
1, 2, 3 HT 10 631.40 300.09
MT 8 731.25 336.08
EN 18 404.06 179.45
4, 5, 6 HT 8 939.63 963.72
MT 10 1175.60 439.54
[image:8.595.73.290.344.486.2]EN 18 1142.61 918.70
Table 4: Fixation duration mean in Word AOI
The estimated fixation count (at logarithmic scale) is 6.29 for tasks 1, 2 and 3 and 6.85 for tasks 4, 5 and 6. There is an estimated of -0.56 fixations (less) in tasks 1, 2, 3 than in 4, 5, 6 CI95%=[-0.78,
-.034]. If tasks and scenarios are considered, the estimated mean for the EN 1, 2, 3 tasks in 5.93 and 6.86 for 4, 5 and 6. The estimated differences in the EN group is of -0.93 fixations (less) in the first group of tasks CI95%=[-1.38, -0.49].
Regarding the cognitive load, there are significant differences between the tasks, which indicates that the cognitive load varied depending on the difficulty of the task, but not necessarily due to the scenario (as in Castilho, 2016). This is clear in the EN group where participants had significantly more fixations in the second set of tasks than in the first ones, but the participants were always under the same scenario. The mean fixation duration is lower for tasks 4, 5, 6 and this is surprising since these tasks were more difficult for participants. It could be that participants did not spend more time fixating on an option but fixating on different keywords to try and find the solution. So, although the sum of all fixation durations in seconds was higher for tasks 4, 5 and 6, the mean (when computing N=count of fixations) was lower because there were a lot more fixations in those tasks.
4.5 Mouse clicks
During the experiment, when the participants in the JP group did not understand a word in the MT scenario, they were observed clicking around to try and understand the context of that word.
1, 2, 3 4, 5, 6
T asks 0.00
0.05 0.10 0.15 0.20 0.25 0.30
F
ix
a
ti
o
n
D
u
ra
ti
o
n
W
o
rd
M
e
a
n
English MT HT
Scenario
1, 2, 3 4, 5, 6
T asks 0
1000 2000 3000
F
ix
a
ti
o
n
C
o
u
n
t
W
o
rd
English MT HT
Therefore, the number of mouse clicks were compared between the HT and MT scenario in the Japanese group. Although HT had a lower number of clicks than the MT scenario (HT=58.86; MT=62.68), there is no statistically significant difference between the two. On 10 occasions, the MT scenario ranks lower than HT, on 11 MT ranks higher than HT, and on 1 occasion they rank equally.
4.6 Retrospective think aloud protocols At the time of writing this paper, a complete qualitative analysis of these interviews has not been completed, as all interviews are being transcribed for ease of analysis, therefore a summary of the observations during the experiment is provided instead.
The participants from the JP and EN groups reported that they found the first three tasks easier than the second three tasks in general as has been observed in the quantitative analysis. As per the self-reported questionnaire and the results, the JP group reported having more difficulties with certain tasks than the EN group, and less experience with those tasks and Word in general. Possibly, the most surprising comment after talking to the participants was that when returning from the pause, the JP group did not notice that the Word application was different. The participants were concentrating on the completion of the tasks, and since they were not informed that there was a change in the application, they assumed it was the same one. Having said this, however, participants in the JP group did report that some words were wrong, incorrect or confusing, and that some technical terms posed difficulty in MT. As explained in Section 4.3, the JP group rated the MT scenario lower than the HT scenario, so they were less satisfied when working with MT, especially in tasks 4, 5 and 6.
5
Conclusions and future work
There are differences between the EN and JP group when it comes to effectiveness, efficiency, satisfaction and, to some extent, when it comes to cognitive effort. Translation modality appears to be a factor, especially when the MT scenario is considered for effectiveness and satisfaction.
If the JP group is examined in isolation, there are differences between the MT and HT scenarios, but these are not significant if effectiveness and efficiency are considered. However, when it comes to satisfaction, the difference is significant. This is also in line with what the participants
reported in the RTA protocol; overall, they did not notice a difference between the HT and the MT systems. However, they did notice words that were wrong, strange, confusing in the MT scenario and this is what they remembered when rating their satisfaction in both scenarios. The difference in satisfaction is also larger for more difficult tasks, and this might indicate that the less familiar we are with an application, the more we need the language to be of high quality to understand our way around that application.
Another aspect to consider is that if users cannot complete a high percentage of tasks, their satisfaction score might be lower because they would feel that either they, the instructions, or the language was inadequate. For this reason, it is important to see how participants in different languages and with different experience and successful scores, rate satisfaction.
Nevertheless, even if the number of tasks or the time it took to complete them was not significantly different in both scenarios, Japanese participants felt more satisfied in the HT scenario, and this perceived value is a key factor if customer experience and retention are considered when implementing MT solutions.
Would this have been different if participants were using a system translated with NMT? As we can see from the literature when comparing both paradigms (Bentivogli et al., 2016, Castilho et al. 2017, Castilho and Guerberof, 2018; Toral, Wieling and Way, 2018) improvements in quality have been observed when moving from SMT to NMT systems, but the effect this improvement has on translators/users, if any, is yet to be defined clearly. When reading within software (with a focus on completing a task), as in this experiment, the important factor appears to be key words, i.e. accuracy, not necessarily the fluency of the text, which is where NMT performs better. Therefore, if a raw NMT system is put in place (especially if compared to a highly customized SMT system), users might also notice or be confused by incorrect or unclear terms and report lower satisfaction scores. This remains to be tested.
Acknowledgements
This research was supported by the Edge Research Fellowship programme that has received funding from the EU Horizon 2020 and innovation programme under the MSC grant agreement No. 713567, and by the ADAPT Centre for Digital Content Technology, funded under the SFI Research Centres Programme (Grant 13/RC/2106) and cofounded under the European Regional Development Fund.
This research was also funded by Microsoft Ireland. We would like to thank Glenn Poor and Dag Schmidtke for their support in this pilot experiment.
References
Bentivogli, Luis, Arianna Bisazza, Mauro Cettolo, and Marcello Federico. 2016. Neural versus phrase-based machine translation quality: a case study. arXiv preprint arXiv:1608.04631
Bowker, Lynne. 2015. Translatability and User eXperience: Compatible or in Conflict? Localisation
Focus: The International Journal of Localisation
14(2): 13-27.
Bowker, Lynne and Jairo Buitrago Ciro. 2018.
Localizing websites using machine translation. The
Human Factor in Machine Translation. Chan Sin-wai, ed. Routledge Studies in Translation. Routledge, Lonad and New York: 8-29.
Castilho, Sheila, and Ana Guerberof Arenas. 2018. Reading comprehension of machine translation
output: what makes for a better read? 21st Annual
Conference of the European Association for Machine Translation, Alacant, Spain:79-88. Castilho, Sheila, Joss Moorkens, Federico Gaspari,
Iacer Calixto, John Tinsley, and Andy Way. 2017. Is neural machine translation the new state of the art?
The Prague Bulletin of Mathematical Linguistics, 108(1): 109–120.
Castilho, Sheila, Sharon O’Brien, Fabio Alves. and Morgan O’Brien. 2014. Does post-editing increase usability? A study with Brazilian Portuguese as
Target Language. Proceedings of the Seventeenth
Annual Conference of the European Association for Machine Translation, Dubrovnik, Croatia, 183–190. Castilho, Sheila. 2016. Measuring Acceptability of Machine Translated Enterprise Content. PhD Thesis. Dublin City University, Dublin, Ireland. De Almeida, G. and Sharon O’Brien. 2010. Analysing
post-editing performance: correlations with years of
translation experience. In Proceedings of the 14th
Annual Conference of the European Association for Machine Translation, S. Rafael, France.
Doherty, Stephen and Sharon O’Brien. 2009. Can MT output be evaluated through eye tracking?
Proceedings of the Machine Translation Summit XII,
Ottawa, Ontario, Canada, 214-221.
Doherty, Stephen and Sharon O’Brien. 2012. A user-based usability assessment of raw machine translated technical instructions. The Tenth Biennial Conference of the Association for Machine Translation in the Americas. Proceedings, San Diego, 6pp.
Doherty, Stephen and Sharon O’Brien. 2014. Assessing the Usability of Raw Machine Translated Output: A User-Centered Study Using Eye Tracking.
International Journal of Human- Computer Interaction, 30(1): 40–51.
Doherty, Stephen, Sharon O’Brien and Michael Carl 2010. Eye tracking as an MT evaluation technique.
Machine Translation Magazine, 24(1): 1-13. Guerberof, Ana. 2012. Productivity and quality in the
post-editing of outputs from translation memories and machine translation. PhD thesis. Universitat Rovira i Virgili, Tarragona. Spain.
Lewis, James R. (1995) IBM Computer Usability
Satisfaction Questionnaires: Psychometric
Evaluation and Instructions for Use. International
Journal of Human-Computer Interaction, 7:1, 57-78.
Lommel, Arle R. and Donal A. DePalma. 2016. Post-editing goes Mainstream. Common Sense Advisory.
Available on-line
http://www.commonsenseadvisory.com/AbstractVi
ew/tabid/74/ArticleID/36532/Title/Post-EditingGoesMainstream/Default.aspx (accessed
April 4th 2019)
Moorkens, Joss, Sharon O’Brien, Igor A.L. da Silva, Norma de Lima Fonseca, and Fabio Alves. 2015. Correlations of perceived post-editing effort with
measurements of actual effort. Machine Translation,
29(3): 267–284.
O’Brien, Sharon and Sheila Castilho. 2016. Evaluating the Impact of Light Post-Editing on Usability.
Proceedings of the Tenth International Conference
on Language Resources and Evaluation (LREC 2016), Portorož, Slovenia, 310-316
O’Brien, Sharon. 2006. Eye-tracking and translation
memory matches. Perspectives: Studies in
Translatology, 14(3):185–205.
Plitt, Mirko, and François Masselot. 2010. A productivity test of statistical machine translation
post-editing in a typical localization context. The
Prague Bulletin of Mathematical Linguistics, 23: 7-16
perspective? Journal of specialised translation, (31): 135-157.
Toral, Antonio, Martijn Wieling, and Andy Way. 2018. Post-editing effort of a novel with statistical and
neural machine translation. Frontiers in Digital
Humanities, 5, 9.
van Egdom, Gys Walt and Mark Pluymaekers, M. 2019. Why go the extra mile? How different degrees of post-editing affect perceptions of texts,
senders and products among end users. Journal of