Greenhouse Gas
Emissions Inventory
Prepared For:
July 2010
Prepared By:
SourceOne, Inc. 132 Canal Street Boston, MA 02114 Phone: (617) 399-6100 Fax: (617) 399-6186 www.s1inc.comThe following emissions inventory was calculated and prepared in accordance with the General and Technical Guidelines of the U.S. Department of Energy (D.O.E.) 1605(b) voluntary reporting program. Emissions were attributed to Endicott College under the principle of financial control. This inventory was prepared using data provided by Endicott College personnel. All information, emissions factors, and protocols are subject to inherent uncertainties and variability. This is especially true for electricity emissions factors. Besides being unrealistically uniform over multi-state regions, the factors are also blind to time-of-day fluctuations in emissions resulting from different kinds of power plants coming on- and off-line over the course of any given day.
Endicott College, for the intents and purposes of this inventory, is the made up of the buildings located on the campus on either side of Route 127 (Hale Street) in Beverly, Massachusetts. The school was founded in 1939 by Dr. Eleanor Tupper and Dr. George O. Bierkoe. In the fall of 2008, the college had 4,218 total students. There are approximately 353 full-time employees, along with 211 part-time employees.
Table of Contents
Executive Summary ...4 Accounting Scope ...6 Emissions Calculations ...7 Main Campus...8 East Buildings ...9Stoneridge & Bayview...10
Post Center ...11
Art Center...12
College Hall, Trexler Hall, & Alhambra Hall ...13
Wylie Inn, Tupper Manor, & Meeting Place ...14
Physical Plant & Campus Safety ...15
Van Loan...16
Miscellaneous Accounts ...17
De Minimis Emissions...18
Summary...19
Appendix A – Endicott College Utility Account Date Ranges...20
Executive Summary
SourceOne constructed this Greenhouse Gas (GHG) emissions inventory for Endicott College following the guidelines of the Department of Energy 1605(b) voluntary reporting program. The college’s largest source of emissions was electricity usage. The second largest source of emissions was the combustion of natural gas used for heating and domestic hot water. The consumption of fuel oil was the third largest source of emissions. Propane consumption accounted for a very small percentage of the emissions. The remaining emissions were from the use of gasoline and diesel fuel in vehicles.
Due to the limited availability of utility consumption data, this emissions inventory was calculated using data from different periods of time. The great majority of electric data was from July 2008 through June 2009. Natural gas data was mainly comprised of consumption between June 2008 and May 2009. Fuel oil, propane, and vehicle fuel consumption were from several 12-month periods. Unfortunately there are gaps in the data and some accounts have less than 12-months of data. The periods of time for each data source are listed in the table in Appendix A. All of this consumption data was combined to create a “typical year” of emissions. While this is not ideal, it was necessary based on the information available. Utility invoices and consumption summaries were provided by Endicott College personnel.
Emissions were grouped by area of the campus or building. Small emission sources or accounts which could not be correctly attributed to an area or building were combined into a Miscellaneous Accounts group. The groupings by account are shown in Appendix B. The group emissions are show below along with the emissions total in Figure 1.
0.0 1,000.0 2,000.0 3,000.0 4,000.0 5,000.0 6,000.0 7,000.0 G H G E m issi ons ( m et ri c t ons C O 2 -e ) Propane 0.0 0.0 0.0 0.0 0.0 0.0 0.0 0.0 0.0 16.3 16.3
Main Campus East Buildings Stoneridge/
Bayview Post Center Art Center College Hall Wylie Inn Physical Plant Van Loan Misc. Accounts Total CO2-e (metric tons)
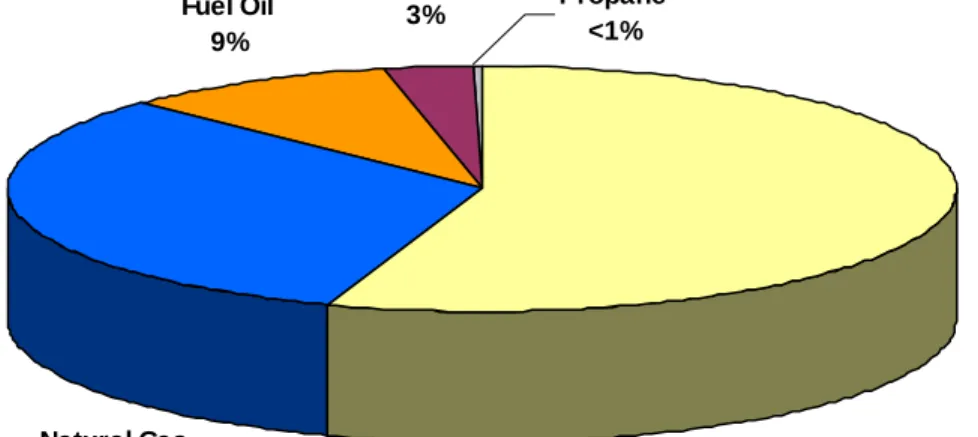
The emissions for a “typical year” were calculated to be 6,340.8 metric tons of CO2-e. The
primary driver was electricity usage, which made up 55% of the emissions or 3,501.9 metric tons. The largest user of electricity, with 25% of the total, was the main campus. Natural gas consumption made up 32% of the emissions with the main campus also being the largest user (33% of the total).
Fuel oil consumption made up 9% of the emissions with the largest single user being College Hall, but most consumption was spread across the smaller miscellaneous accounts. Automotive fuel emissions made up just 3% of the total, with the Physical Plant (which includes Campus Safety) emitting 68% of these emissions and the remainder from the Athletic Team Bus, which is under miscellaneous accounts. Less than a 0.5% of the emissions were from propane consumption at the Misselwood Tent and the Football Locker Room (both grouped under Miscellaneous Accounts). Fuel Oil 9% Automotive 3% Propane <1% Natural Gas 32% Electricity 55%
Accounting Scope
This emissions inventory includes Greenhouse Gas (GHG) emissions attributable to Endicott College according to the principle of financial control. If the college has financial control over a facility, vehicle, machine, or process that has GHG emissions, then those emissions are included in the emissions inventory. Owned and controlled buildings located in Endicott, Massachusetts are included in the report.
Emissions fall into three different categories: Scope I, II, and III. Scope I GHG emissions are from direct sources such as the combustion of fuels on site or in college vehicles. For Endicott College, natural gas, fuel oil, propane, and vehicle fuel consumption make up the Scope I emissions. Scope II emissions are indirect emissions from the purchase of energy. Endicott College’s Scope II emissions are entirely from electricity usage/purchase.
Scope III emissions were not taken into account when preparing this report. Scope III emissions cover a very broad range of indirect sources. They can include production and disposal of almost everything that is utilized within the college, employee air & rail travel, employee and student commuting, and any other indirect emissions that could be attributed to the college. Reporting emissions from these sources is optional and they have been excluded from this report.
De Minimis Exclusion: The D.O.E. 1605(b) program allows for up to 3% of entity-wide emissions to be excluded from the emissions report. Sources can be excluded on any grounds as long as it can be justified that the omitted emissions are less than 3% of the emissions total. The reasons for exclusion of an emissions source that are most often cited are insignificance, inability to monitor emissions, inaccuracy of data, lack of data, and excessive reporting burden. Some critics say that because an estimate of emissions is required for inclusion in the De Minimis category, those emissions might as well be included in the overall report instead of having a built-in underestimate in the overall total, however small. But given the inherent uncertainties in emissions factors, especially electricity emissions factors, a very small portion of the total emissions with an even higher inherent uncertainty does not contribute to the quality of an emissions report enough to justify the additional effort.
Emissions Calculations
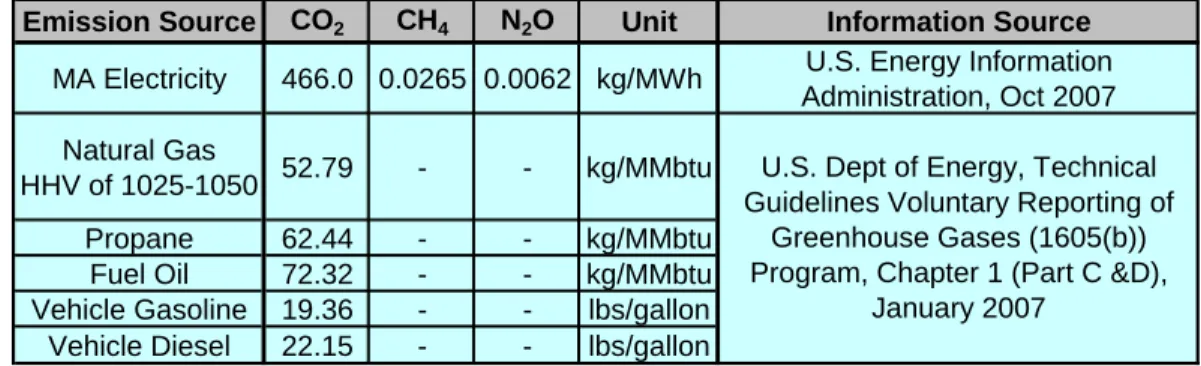
GHG emissions for fuel combustion and electricity usage were calculated using usage data (e.g. kWh) multiplied by emissions factors for carbon dioxide (CO2), methane (CH4), and nitrous
oxide (N2O) (e.g. lbs CO2/kWh). These are the three most common Greenhouse Gases. The
other three main GHGs (SF6, HFCs, and PFCs) are not emitted by traditional combustion of
fossil fuels or electricity usage. They are typically emitted by specific types of processes or equipment, such as refrigeration equipment for HFCs or electricity distribution equipment for SF6.
Emission Source CO2 CH4 N2O Unit Information Source
MA Electricity 466.0 0.0265 0.0062 kg/MWh U.S. Energy Information
Administration, Oct 2007
Natural Gas
HHV of 1025-1050 52.79 - - kg/MMbtu
Propane 62.44 - - kg/MMbtu
Fuel Oil 72.32 - - kg/MMbtu
Vehicle Gasoline 19.36 - - lbs/gallon
Vehicle Diesel 22.15 - - lbs/gallon
U.S. Dept of Energy, Technical Guidelines Voluntary Reporting of
Greenhouse Gases (1605(b)) Program, Chapter 1 (Part C &D),
January 2007
Table 1 - Emissions Factors Used in U.S. Greenhouse Gas Emissions Inventory
Electricity emissions factors are assigned on a regional basis to reflect the generation mix that serves the load in each region. The electricity emissions factors, though published in 2007, are based on 1999-2002 emissions as calculated by the Energy Information Administration (EIA), the research arm of the D.O.E. When electricity grid emissions are next evaluated for a more recent period, the emissions factors will most likely be lower to reflect the increasing presence of renewables in the national and regional generation mixes.
Natural gas emissions factors can vary depending on the energy content of the gas. The Gas delivered to Endicott College was assigned the United States Pipeline Average emissions factor for the calculations. The pipeline average assumes a Higher Heating Value (HHV) between 1025 to 1050 Btu per scf. The CH4 and N2O emissions from the combustion of natural gas, fuel oil, and vehicle fuel are considered De Minimis due to the relatively small amounts emitted. CO2 is the weakest of the main GHGs in terms of atmospheric effect per unit of gas, but it is
responsible for the large majority of the enhanced greenhouse effect caused by manmade emissions because it is emitted in the largest quantities. For simplicity, emissions of all GHGs are converted to lbs CO2-equivalent based on their global warming potential (GWP). The GWP
of a gas is equal to how many pounds of CO2 it would take to create the same atmospheric
effect as one pound of that gas. For example, CH4 is 25 times more potent than CO2 as a GHG,
thus one pound of CH4 can be counted as 25 lbs CO2-equivalent (CO2e). (Table 2)
Gas GWP
Co2 1
CH4 25
N2O 298
These values are from the Fourth Assessment Report of the Intergovernmental
Panel on Climate Change
Main Campus
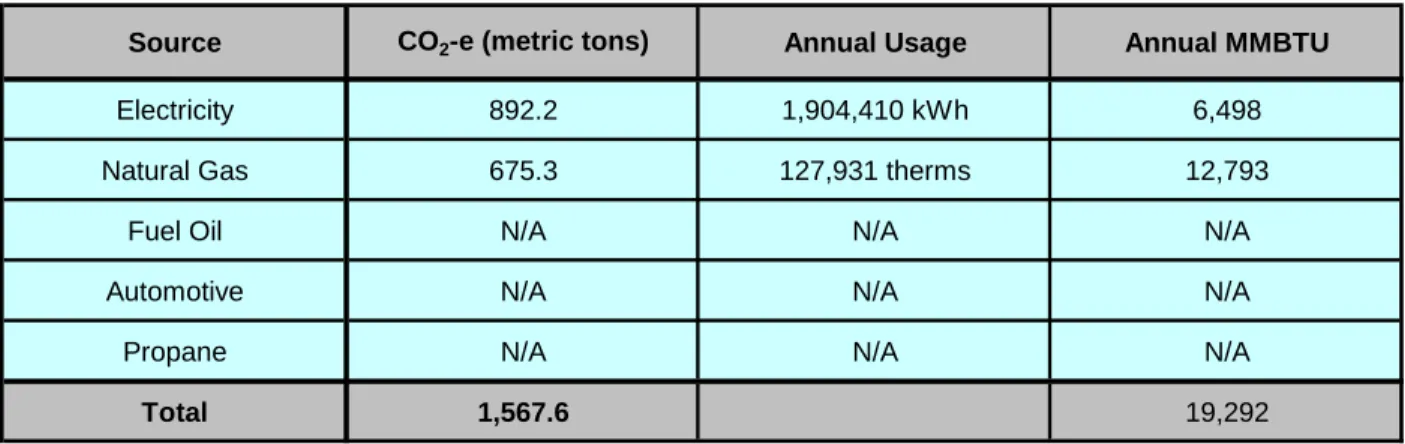
The Main Campus, for purposes of this inventory, is comprised of the accounts for Kennedy Hall, Callahan Center, Academic Center, Halle Library, Williston Townhouses, Wax Academic Center, West Center, and the Chapel. The Main Campus made up the largest percentage of carbon emissions across all of the groupings with 1,567.6 metric tons of CO2-e emissions. This
was 25% of the total emissions across all of Endicott College.
Source CO2-e (metric tons) Annual Usage Annual MMBTU
Electricity 892.2 1,904,410 kWh 6,498
Natural Gas 675.3 127,931 therms 12,793
Fuel Oil N/A N/A N/A
Automotive N/A N/A N/A
Propane N/A N/A N/A
Total 1,567.6 19,292
Table 3 – GHG emissions by source at Endicott College’s Main Campus
On the main campus, the largest percentage of emissions, 57% or 892.2 metric tons, was created through the usage of electricity. This electricity was supplied by National Grid (July 2008 through June 2009) and totaled 1,904 MWh. The remaining emissions, 43% or 675.3 metric tons of CO2-e, were produced through the consumption of 127,931 therms of natural gas, which
serves as the heating fuel for the facilities. The natural gas was also purchased from National Grid. The consumption of fuel oil, automotive fuel, or propane was not attribution to the Main Campus and thus these facilities had no emissions from these sources.
Natural Gas 43%
Electricity 57%
East Buildings
For this inventory, the East Buildings are made up of four residence halls, known as: Brindle Hall, Hale Hall, Endicott Hall, and Reynolds Hall. Brindle Hall was built in 1967 as a residence hall and still serves in this capacity today. Hale Hall was previously utilized for classroom and office space, but was renovated as a residence hall in 1998. Endicott Hall is another residence hall, which can house 120 students. Reynolds hall was purchased by Endicott College in 1939, making it the school’s first building acquisition. This group of buildings made up the 10% of the total carbon emissions for Endicott College at 634.4 metric tons of CO2-equivalent.
Source CO2-e (metric tons) Annual Usage Annual MMBTU
Electricity 228.6 487,920 kWh 1,665
Natural Gas 405.8 76,864 therms 7,686
Fuel Oil N/A N/A N/A
Automotive N/A N/A N/A
Propane N/A N/A N/A
Total 634.4 9,351
Table 4 – GHG emission by source at Endicott College’s East Buildings
Carbon emissions from the usage of 487,920 kWh of electricity produced 228.6 metric tons of CO2-equivalent. This electricity was delivered by National Grid (August 2008 to July 2009). This
accounted for 36% of the total emissions produced at the East Buildings. The largest source of emissions was the consumption of natural gas (June 2008 through May 2009). The consumption of 76,864 therms produced 405.8 metric tons of CO2-e, which was 64% of the total
emissions at the East Buildings. The consumption of fuel oil, automotive fuel, and propane was not attributable to the East Buildings.
Electricity 36%
Natural Gas 64%
Stoneridge & Bayview
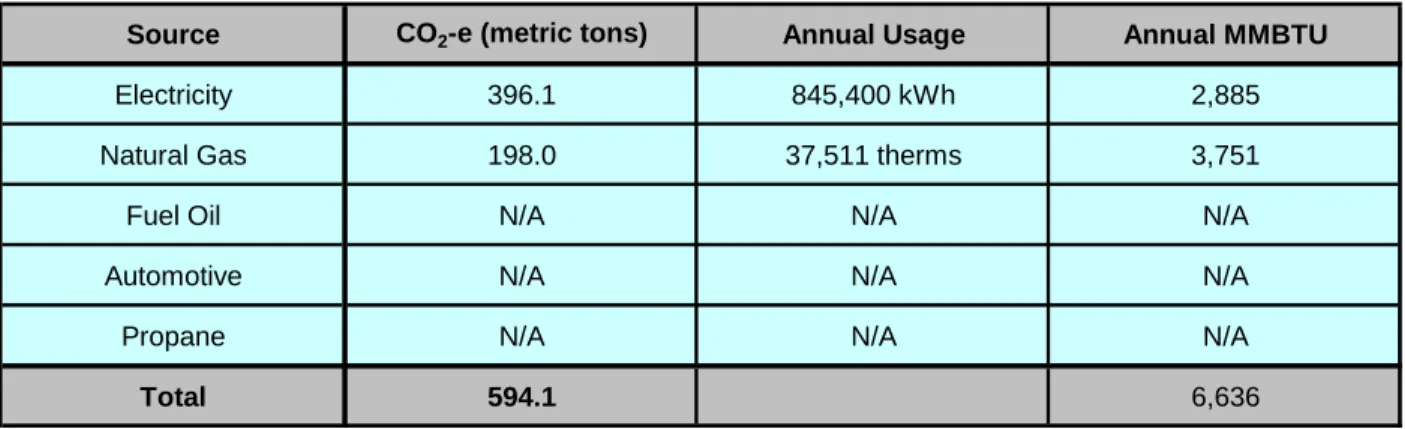
Stoneridge Hall and Bayview Hall are located on Village Road towards the west end of the campus. Stoneridge Hall is a traditional residence hall, which was built in 2002. Bayview Hall was constructed in 2005 and serves as not only a traditional residence hall, but also has six apartments for students living with a child. These two buildings were responsible for 9% of the total emissions at Endicott College. The combined emissions of the two buildings totaled 594.1 metric tons of CO2-equivalent.
Source CO2-e (metric tons) Annual Usage Annual MMBTU
Electricity 396.1 845,400 kWh 2,885
Natural Gas 198.0 37,511 therms 3,751
Fuel Oil N/A N/A N/A
Automotive N/A N/A N/A
Propane N/A N/A N/A
Total 594.1 6,636
Table 5 – GHG emissions by source at Endicott College’s Stoneridge & Bayview Buildings
The largest portion of emissions, 396.1 metric tons of CO2-e, was the result of electricity usage.
The usage of 845,400 kWh (July 2008 to June 2009) accounted for 67% of the emissions at the two buildings. The other 33% of emissions were from the consumption of natural gas (June 2008 to May 2009). The consumption of 37,511 therms resulted in the emission of 198.0 metric tons of CO2-e. Stoneridge and Bayview were not responsible for any of the fuel oil, automotive,
or propane emissions at Endicott College.
Natural Gas 33%
Electricity 67%
Figure 5 – GHG emission percentages at Endicott College’s Stoneridge & Bayview Buildings
Post Center
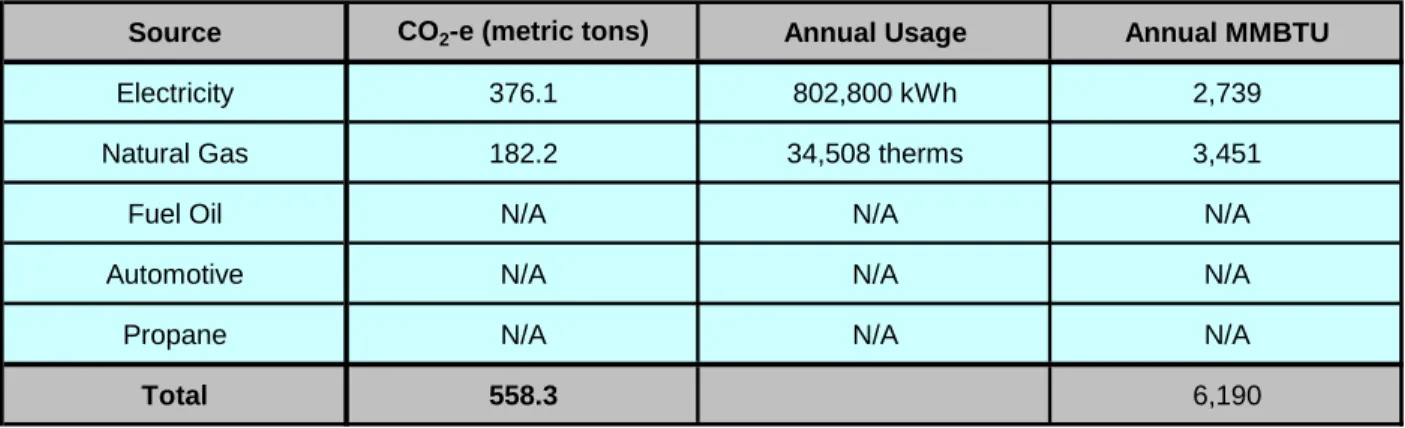
The Post Center is an 84,000 square foot building that was built in 1999. It serves as the main offices for the Athletics Department and the School of Sport Science. This facility contains classrooms and offices, as well as a 1,200-seat gymnasium and a field house. The post center accounted for a little under 9% of the carbon emissions across all of Endicott College with 558.3 metric tons of CO2-e emissions.
Source CO2-e (metric tons) Annual Usage Annual MMBTU
Electricity 376.1 802,800 kWh 2,739
Natural Gas 182.2 34,508 therms 3,451
Fuel Oil N/A N/A N/A
Automotive N/A N/A N/A
Propane N/A N/A N/A
Total 558.3 6,190
Table 6 – GHG emissions by source at Endicott College’s Post Center
Electricity usage accounted for 376.1 metric tons of CO2-equivalent emissions. This was 67% of the total emissions at the Post Center. These emissions were the result of purchasing 802,800 kWh of electricity from National Grid (November 2008 to October 2009). At the Post Center, 34,508 therms of Natural Gas were consumed (July 2008 to May 2009). This consumption was the source of 182.2 metric tons of CO2-e, which made up the other 33% of the emissions at the
Post Center. There were no emissions from fuel oil, propane, or automotive fuel attributed to the Post Center.
Electricity 67% Natural Gas
33%
Art Center
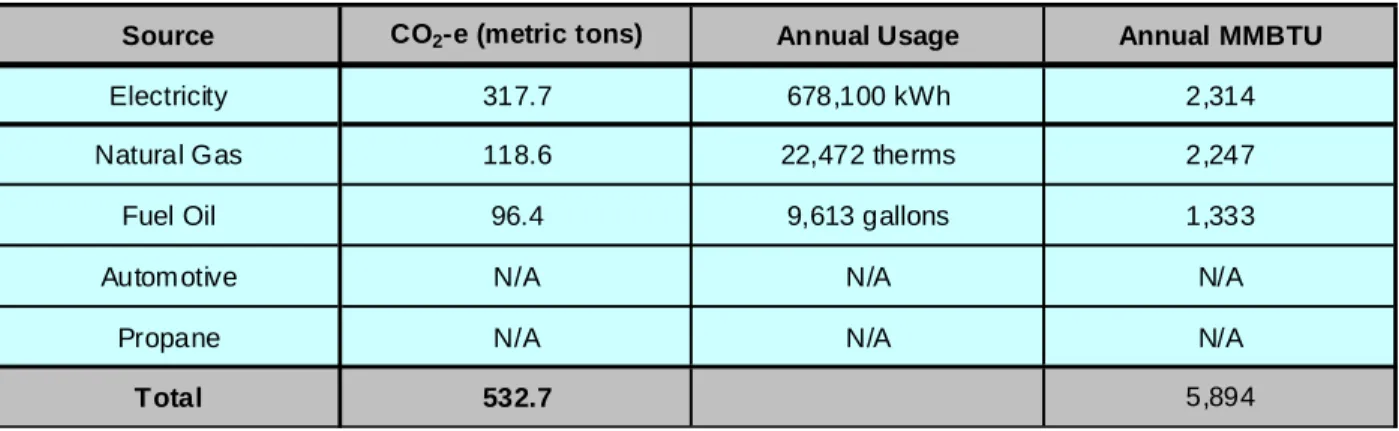
The Art Center was opened in January 2009 and is home of the School of Visual and Performing Arts. The building contains classroom space as well as multiple venues for different types of exhibitions. The Art Center is responsible for 8% of the total emissions at Endicott College. The emissions of the buildings totaled 532.7 metric tons of CO2-equivalent.
Source CO2-e (metric tons) Annual Usage Annual MMBTU
Electricity 317.7 678,100 kWh 2,314
Natural Gas 118.6 22,472 therms 2,247
Fuel Oil 96.4 9,613 gallons 1,333
Automotive N/A N/A N/A
Propane N/A N/A N/A
Total 532.7 5,894
Table 7 – GHG emissions by source at Endicott College’s Art Center
Electricity usage accounted for 317.7 metric tons of CO2-equivalent emissions. This was 60% of the total emissions at the Art Center. These emissions were the result of purchasing 438,100 kWh of electricity from National Grid (September 2008 to April 2009) and extrapolating May 2009 through August 2009, based on standard load profile, to get a total of 678,100 kWh. At the Art Center, 22,472 therms of Natural Gas were consumed (July 2008 to September 2009). This consumption was the source of 118.6 metric tons of CO2-e, which made up 22% of the
emissions at the Art Center. Fuel oil emissions totaled to 96.4 metric tons, accounting for the remaining 18%. This was the result of consuming 9,613 gallons (October 2008 to September 2009). Fuel Oil 18% Natural Gas 22% Electricity 60%
College Hall, Trexler Hall, & Alhambra Hall
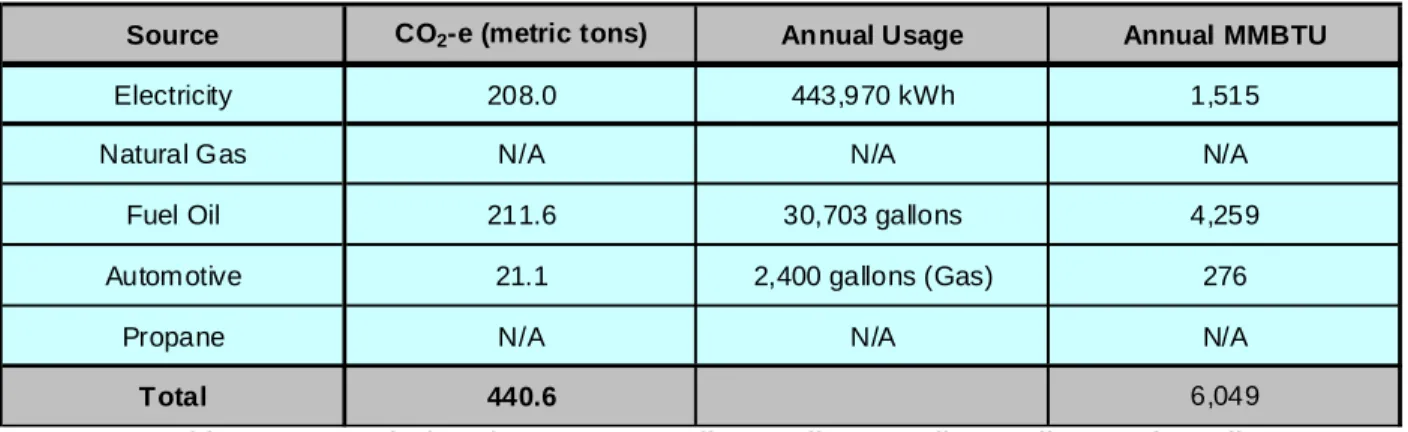
College Hall serves has Endicott College’s main administration building, housing such departments as Admissions, Financial Aid, and the Registrar. Trexler Hall was previously a library and in 1965 was converted into a student residence. Alhambra Hall was originally built in 1750 and moved to its current location in the 1920’s; it now used as a student residence. These buildings accounted for slightly under 7% of the campus wide emissions. The emissions at the three buildings totaled to 440.6 metric tons of CO2-e.
Source CO2-e (metric tons) Annual Usage Annual MMBTU
Electricity 208.0 443,970 kWh 1,515
Natural Gas N/A N/A N/A
Fuel Oil 211.6 30,703 gallons 4,259
Automotive 21.1 2,400 gallons (Gas) 276
Propane N/A N/A N/A
Total 440.6 6,049
Table 8 – GHG emissions by source at Endicott College’s College Hall, & Trexler Hall
Fuel oil consumption was the source of 48% of the emissions at these three buildings with 211.6 metric tons of CO2-e. The fuel oil was delivered by Townsend Oil between July 2008 and June
2009 and totaled 21,091 gallons. The second largest emissions source at these three buildings was the usage of electricity (July 2008 to June 2009). This group of buildings was billed for 443,970 kWh of electricity, which was the source of 208.0 metric tons of CO2-e (47% of the
total). College Hall is the home of the Admissions Department, which utilizes (5) cars that each drive approximately 12,000 miles annually. These cars have an estimated gas mileage of 25 miles per gallon resulting in a total of 2,400 gallons of automotive gasoline a year. The combustion of gasoline in these cars resulted in the emission of 21.1 metric tons of CO2-e, 5%
of the emissions from College Hall, Trexler Hall, and Alhambra Hall sources.
Automotive 5% Fuel Oil 48% Electricity 47%
Wylie Inn, Tupper Manor, & Meeting Place
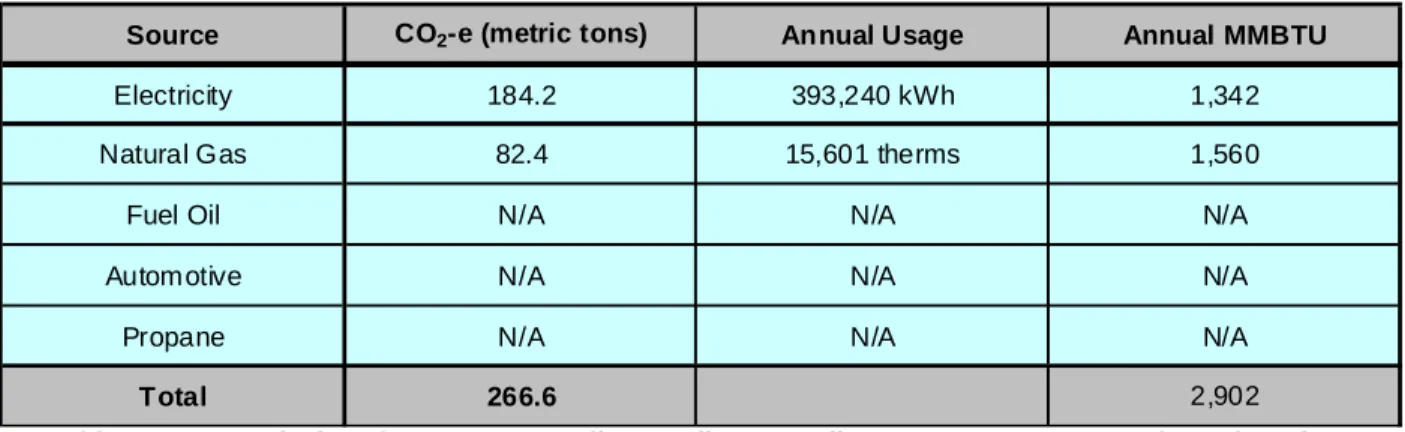
This group of buildings consists of the Wylie Inn & Conference Center, Tupper Manor, and Meeting Place. The Wylie Inn was originally built in 1958 and renovated in 2007. Tupper Manor was purchased by Endicott College in 1943 and serves as the manor house for the Wylie Inn. Meeting Place was built in 1955 and served as the campus gymnasium until 1999. It is now utilized as a conference center. This group of buildings was responsible for the production of approximately 4% of the CO2-e emissions at Endicott College (266.6 metric tons of CO2-e).
Source CO2-e (metric tons) Annual Usage Annual MMBTU
Electricity 184.2 393,240 kWh 1,342
Natural Gas 82.4 15,601 therms 1,560
Fuel Oil N/A N/A N/A
Automotive N/A N/A N/A
Propane N/A N/A N/A
Total 266.6 2,902
Table 9 – GHG emissions by source at Endicott College’s Wylie Inn, Tupper Manor, and Meeting Place
The majority of combined emissions across this group of buildings were created through the purchase and usage of National Grid electricity. The electricity usage from the buildings totaled 393,240 kWh (July 2008 to June 2009). This resulted in the emission of 184.2 metric tons of CO2-equivalent, which was 69% of the total emissions at Wylie Inn, Tupper Manor, and Meeting
Place. The remaining 31% of emissions (82.4 metric tons of CO2-e) were produced through the
combustion of 15,601 therms of natural gas (June 2008 to May 2009). No emissions from fuel oil, automotive fuel, or propane were attributed to these buildings.
Electricity 69% Natural Gas
31%
Physical Plant & Campus Safety
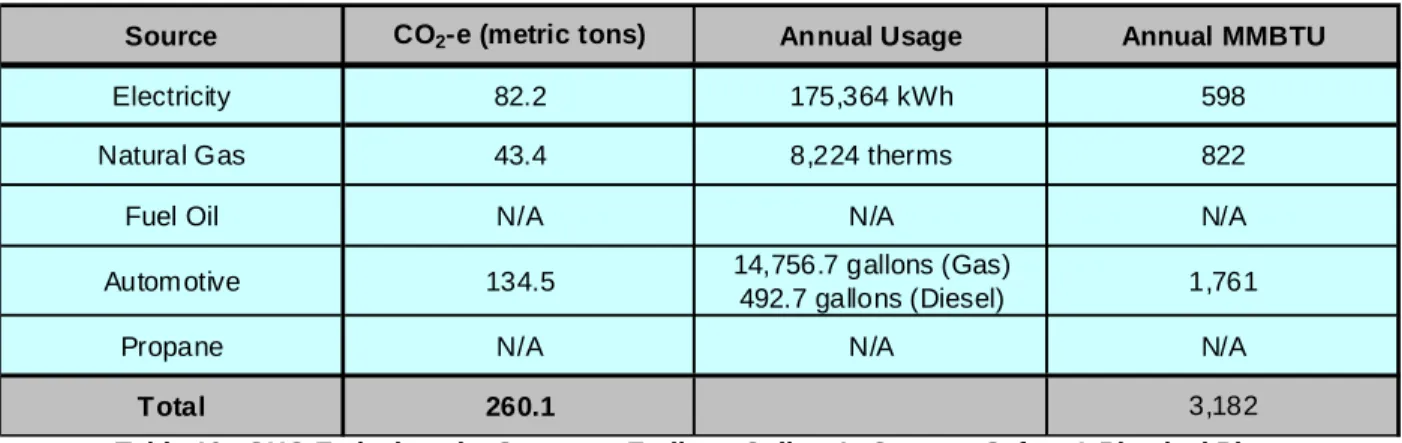
For this report, Campus Safety and the Physical Plant (Facilities Department) were grouped together due to shared vehicle gasoline logs. The Campus Safety building was constructed in 2008 and is operated 24 hours a day. The Physical Plant is a two-story building built in 2001. These two buildings accounted for 260.1 metric tons of CO2-equivalent (4% of Endicott
College’s total emissions).
Source CO2-e (metric tons) Annual Usage Annual MMBTU
Electricity 82.2 175,364 kWh 598
Natural Gas 43.4 8,224 therms 822
Fuel Oil N/A N/A N/A
Automotive 134.5 14,756.7 gallons (Gas)
492.7 gallons (Diesel) 1,761
Propane N/A N/A N/A
Total 260.1 3,182
Table 10 –GHG Emissions by Source at Endicott College’s Campus Safety & Physical Plant
These two buildings were the largest user of vehicle fuel at Endicott College with 134.5 metric tons of CO2-e emitted during the combustion of vehicle fuel. The Campus Safety and Physical
Plant gasoline fueled vehicles consumed 14,756.7 gallons (December 2007 and January 2008). The Physical Plant also has a diesel-powered truck, which consumed 492.7 gallons of diesel fuel (January 2008 through December 2008). The emissions from these vehicles accounted for 51% of the CO2-e attributable to these two buildings. The consumption of 8,224 therms resulted
in the emission of 43.4 metric tons of CO2-e (17% of the total). The Physical Plant consumed
this natural gas from June 2008 to May 2009. Campus Safety natural gas data is only from October 2008 – May 2009. Electricity accounted for the remaining 32% of emissions, 82.2 metric tons of CO2-e. This was produced through the use of 175,364 kWh. The Physical Plant
(Facilities) electric usage occurred from July 2008 to June 2009 and Campus Safety usage records were from August 2008 to Jun 2009. Propane and fuel oil were not consumed by these two buildings. Automotive 51% Natural Gas 17% Electricity 32%
Van Loan
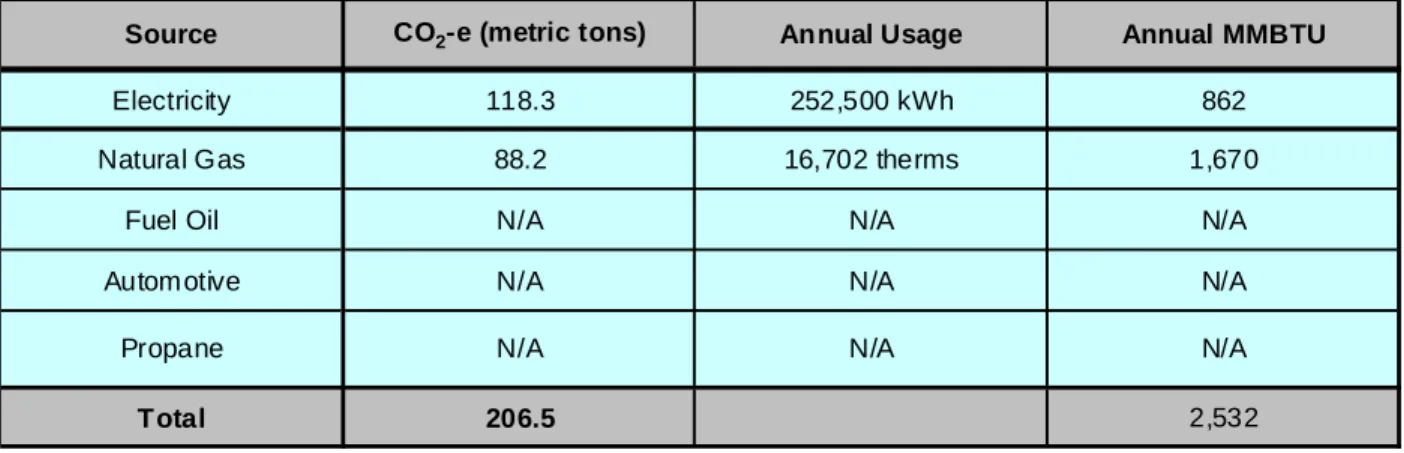
This building was originally known as Bullock Hall and was acquired by Endicott College in 1943. After being renovated in 2003, it became the Van Loan School of Graduate and Professional Studies. It is comprised of classrooms, labs, and offices. The Van Loan building was the source of 206.5 metric tons of CO2-equivalent, which is 3% of the total emissions at
Endicott College.
Source CO2-e (metric tons) Annual Usage Annual MMBTU
Electricity 118.3 252,500 kWh 862
Natural Gas 88.2 16,702 therms 1,670
Fuel Oil N/A N/A N/A
Automotive N/A N/A N/A
Propane N/A N/A N/A
Total 206.5 2,532
Table 11 – GHG emissions by source at Endicott College’s Van Loan
Electricity usage accounted for 118.3 metric tons of CO2-e emissions, which was 57% of the
total at the Van Loan School. This electricity was utilized from October 2007 to September 2008 and totaled 252,500 kWh. Natural Gas consumption was the source of the other 43% percent of emissions. The Van Loan School consumed 16,702 therms (June 2008 to May 2009) to produce 88.2 metric tons of CO2-equivalent.
Natural Gas 43%
Electricity 57%
Miscellaneous Accounts
Endicott College had 56 miscellaneous accounts that were grouped together for the purpose of a more concise organization. This included 23 electric accounts, 19 natural gas accounts, 12 fuel oil accounts, and two propane accounts. This group consists mostly of residences including Beacon Hall, Birchmont, the Farm House, Hamilton Hall, Hawthorne Hall, the Ledge, Rockport Hall, Rogers Hall, Tower Hall, the Village, Winthrop Hall, and the Woodside Townhouses. Recreational and sports areas such as Grove Hall, The Lodge, and the Stadium are part of the miscellaneous accounts. Finally, there are various areas such as Misselwood Estate, the Research Center, the Art Center, and parking lots. The miscellaneous accounts emitted a total of 1,279.9 metric tons of CO2-e. These emissions were 20% of the total at Endicott College.
Source CO2-e (metric tons) Annual Usage Annual MMBTU
Electricity 698.6 1,491,098 kWh 5,088
Natural Gas 234.0 44,335 therms 4,434
Fuel Oil 288.6 28,773 gallons 3,991
Automotive 42.4 4,217 gallons (Diesel) 485
Propane 16.3 2,864 gallons 261.60
Total 1,279.9 14,259
Table 12 – GHG emissions by source across Endicott College’s Miscellaneous Accounts
Amongst the Miscellaneous Accounts, electricity was the source of the majority of CO2-e
emissions with 55%. The usage of 1,491,098 kWh resulted in the emission of 698.6 metric tons of CO2-equivalent. The next largest source was fuel oil consumption, which was 23% of the
total. Across the Miscellaneous Accounts, 28,773 gallons of fuel oil were consumed, producing 288.6 metric tons of CO2-e. The consumption of 44,335 therms of natural gas resulted in 18% of
the emissions or 234.0 metric tons of CO2-e.
Electricity 55% Natural Gas 18% Propane 1% Automotive 3% Fuel Oil 23%
Figure 12 – GHG emission percentages across Endicott College’s Miscellaneous Accounts
Endicott College’s athletics team bus-travel was incorporated into the Miscellaneous Accounts. There were 25,304 miles of recorded bus travel in 2008. Assuming a fuel efficiency of 6 miles per gallon, this would result in 4,217 gallons of diesel being consumed. This was the source of 42.4 metric tons of CO2-e emissions (3% of the total). There are two small propane accounts at
Endicott College: the Misselwood Tent and the Football Locker Room. 2,864 gallons of propane were consumed at these two sources resulting in 16.3 metric tons of CO2-e emissions.
De Minimis Emissions
A small percentage of emissions at Endicott College were not calculated in this report. These emissions are considered De Minimis and do not need to be included as they account for less than 3% of the college-wide emissions. Reasons for exclusion of an emissions source that are most often cited are insignificance, inability to monitor emissions, inaccuracy of data, lack of data, and excessive reporting burden.
For Endicott College, one type of excluded emission is the methane (CH4) and nitrous oxide
(N2O) emitted through the combustion of gasoline and diesel fuel in campus vehicles. While
these gases are considered potent, in terms of atmospheric effect per unit of gas, they are emitted in small quantities during this type of combustion. The same is true for CH4 and N2O
emissions when accounting for Endicott College’s natural gas combustion.
Another De Minimis emission source not accounted for in this report are the fugitive HFCs from air conditioning equipment used on campus. These emissions are not explicitly tracked because they are typically very small when compared to more common emissions sources
Summary
Endicott College produced 6,340.8 metric tons of CO2-equivalanet during a “typical year”
utilizing data ranging from 2007 to 2009. The two largest contributors to the total were the Main Campus buildings (25%) and the Miscellaneous Accounts (20%). The next largest contributors were the East Buildings with 10% of the total emissions.
Source Main Campus East Buildings Stoneridge/ Bayview Post Center Art Center College Hall Wylie Inn Physical Plant Van Loan Misc. Accounts Total CO2-e (metric tons) Electricity 892.2 228.6 396.1 376.1 317.7 208.0 184.2 82.2 118.3 698.6 3,501.9
Natural Gas 675.3 405.8 198.0 182.2 118.6 N/A 82.4 43.4 88.2 234.0 2,027.9
Fuel Oil N/A N/A N/A N/A 96.4 211.6 N/A N/A N/A 288.6 596.6
Automotive N/A N/A N/A N/A N/A 21.1 N/A 134.5 N/A 42.4 198.0
Propane N/A N/A N/A N/A N/A N/A N/A N/A N/A 16.3 16.3
Total 1,567.6 634.4 594.1 558.3 532.7 440.6 266.6 260.1 206.5 1,279.9 6,340.8
Table 13 – GHG Emissions by building groups at Endicott College in metric tons of CO2-equivalent
The greenhouse gas emissions across the Endicott College campus were mostly created through the use of electricity (55%) and natural gas consumption (32%). A smaller portion of the emissions were created through fuel oil consumption (9%), automotive fuel consumption (3%), and propane consumption (<1%). The Main Campus and Miscellaneous Accounts were logically the largest users of electricity. Breaking from the emission percentage breakdown, the Main Campus and the East Buildings were the largest consumers of natural gas. The Miscellaneous Accounts and the three buildings grouped as College Hall were the largest consumers of fuel oil. The vehicles from the Physical Plant and Campus Safety consumed the most automotive fuel. The two propane accounts were part of the Miscellaneous Accounts.
Fuel Oil 9% Automotive 3% Propane <1% Natural Gas 32% Electricity 55%
Appendix A – Endicott College Utility Account Date Ranges
Electric Accounts (except for below) Jul 2008 Jun 2009
Hawthorne Sep 2008 Jul 2009
East Buildings Aug 2008 Jul 2009
Campus Safety Aug 2008 Jun 2009
Post Nov 2008 Oct 2009
Van Loan Oct 2007 Sep 2008
Art Center Sep 2008 Apr 2009
Fuel Oil Accounts
332 Hale Street Mahlstedt House Feb 2008 Jan 2009 31 Beckfod Street Apt#2 Nov 2008 Oct 2009 322 Hale Street Keeper's/Rockport House Sep 2008 Aug 2009 376 Hale Street Feb 2008 Feb 2008 378 Hale Street (Research Center) Aug 2008 Jun 2009 407 Hale St (Main House) Jan 2008 Apr 2008 413 Hale Street Oct 2008 Sep 2009 8 Pickett Court 1st Floor Nov 2008 Nov 2009 8 Pickett Court 2nd Floor Sep 2008 Nov 2009
Art Center Aug 2008 Jun 2009
Birchmont Sep 2008 Aug 2009
Maintenance Shed Sep 2008 Sep 2009
Rogers Hall Jan 2008 May 2008
Winthrop Hall Jul 2008 Jun 2009
Alhambra Hall May 2008 Apr 2009
College Hall Jul 2008 Jun 2009
Trexler Hall May 2008 Apr 2009
Natural Gas Accounts (except for below) Jun 2008 May 2009
Performing Arts Oct 2008 Sep 2009
Rogers Aug 2008 Sep 2009
Post Jul 2008 May 2009
Campus Safety Sep 2008 May 2009
Propane Accounts
Misselwood Jun 2008 May 2009
Football May 2008 Apr 2009
See Below See Below
Appendix B – Endicott College Utility Account Groupings
Grouping Fuel Oil Accounts Propane Accounts
Misc 64097-31019 31 Beckford St.,#2 (rental) 31 Beckfod Street Apt#2 Misc 64256-24037 8 Pickett Ct., #1 8 Pickett Court 1st Floor Misc 76718-54039 8 Pickett Ct.,#2 (rental) 8 Pickett Court 2nd Floor Misc 76719-51024 310 Hale St.(Farmhouse)
Misc 64257-21022 320 Hale St.(Ledge)
Misc 39321-31017 322 Hale St.(Rockport) 322 Hale Street Keeper's/Rockport House Misc 39321-28029 332 Hale St.(StaffHouse) 332 Hale Street Mahlstedt House Misc 02065-91022 361 Hale St.(Beacon) 00042-61823-290 376 HALE ST Beacon
Misc 26858-06028 361 Hale St.(Winthrop) Winthrop Hall Misc 39321-27022 365 Hale St.(Birchmont) Birchmont Misc 14455-54022 372 Hale St.(Rogers) 00042-61821-470 376 Hale Street Rogers Rogers Hall Misc 31738-31003 374 Hale St. (Hawthorne) 00042-61821-630 374 Hale Street Hawthorne 376 Hale Street Misc 62989-14026 376 Hale St.(Lot G lights)
Misc 75460-62021 376 Hale St.(Stadium) Football Lock Room
Misc 02021-48025 376 Hale St.(Stoneridge lot)
Misc 64257-17028 400 Hale St.(Research Ctr.) 378 Hale Street (Research Center)
Misc 50518-03014 407 Hale St.(Misselwood) 00042-61823-340 395 Hale St-Misselwd Misselwood-House 407 Hale St (Main House) Misselwood Tent Misc 26858-05012 413 Hale St. (Hamilton-carriage house) 00042-61823-370 395 Hale St-Carriage Misselwood-Carriage
Misc 39321-26016 413 Hale St. (Hamilton-house) 413 Hale Street 00042-61821-410 287 Hale Street Grove
00042-61823-610 302 Hale Street Lodge 00042-61823-510 302 Hale Street T1 00042-61823-520 302 Hale Street T2 00042-61823-540 302 Hale Street T3 00042-61823-570 302 Hale Street T5 00042-61823-580 302 Hale Street T6 00042-61823-600 302 Hale Street T7 00042-61823-550 302 Hale Street 00042-61822-720 287 Hale St Tower 00042-61821-450 376 Hale St-Gloucester Gloucester 00042-61821-440 376 Hale St-Manchester Manchester 00042-61823-330 400 Hale St-Townhse1 Woodside #1 00042-61823-360 400 Hale St Woodside #2 00042-61822-420 376 HALE ST Kennedy 00042-61821-460 376 HALE ST Callahan 00042-61822-450 376 HALE ST Academic Center 00042-61821-490 376 HALE ST Library 00042-61821-700 376 HALE ST T.H.-Williston 00042-61821-640 370 HALE ST Dining Hall 00042-61821-790 376 HALE ST Brindle 00042-61822-780 376 Hale St Hale 00042-61822-960 376 HALE ST Endicott 00042-61823-320 376 HALE ST Reynolds College Hall Trexler Hall Alhambra Hall Art Center 27339-35014 Art Center 00042-61821-420 376 Hale Street Performing Arts Art Center
00042-61823-630 376 Hale Street Bayview 00042-61823-500 287 Hale St Stoneridge 50518-29009 295 Hale St.(Inn)
50517-17022 295 Hale St. (Tupper & Mtg. Place) 00042-61823-490 376 HALE ST Meeting Place Post Center 87934-83028 376 Hale St.(Post Ctr.) 00042-61822-900 376 HALE ST Post
VanLoan 62992-82023 289 Hale St.(VanLoan) 00042-61821-590 287 Hale St Van Loan 00042-61812-450 346 Hale Street Campus Saftey
00042-61823-260 376 HALE ST Physical Plant Maintenance Shed 00654-61029 386 Haie St.(Facilities)
376 Hale St.(East Bldgs.) 38034-48029
Natural Gas Accounts Electric Accounts
376 Hale St.(Grove & Lodge) 00654-49023
376 Hale St. (Woodside T.H.'s) 38047-25007
370 Hale (Main Campus/Williston) Main Campus East Buildings Misc 25558-14029 PhysPlant/ Campus Saftey Wylie Inn
College Hall 62993-74017 376 Hale St.(College Hall) Stoneridge/
Bayview
376 Hale St.(Campus Safety) 74935-78007 302 Hale St.(Stoneridge/Bayview) 00655-26025 Misc Misc Misc 376 Hale St.(Village) 62991-85029 00653-11024 376 Hale St.(Tower)