Topic 10. Intelligent buildings and advanced control techniques
Model Predictive Control for Mid-Size Commercial Building HVAC:
Implementation, Results and Energy Savings
Sorin C. Bengea1,*, Anthony D. Kelman2, Francesco Borrelli2, Russell Taylor1, and Satish Narayanan1
1
United Technologies Research Center, East Hartford, CT
2
Department of Mechanical Engineering, University of California, Berkeley, CA *
bengeasc@utrc.utc.com
Keywords: Model predictive control, Supervisory architecture, On-line implementation, Measurements-based analysis
SUMMARY
The paper presents field demonstration results from the implementation of a model predictive control formulation to optimize the operation of a variable volume, dual-duct, multi-zone HVAC unit serving an existing mid-size commercial building. This full-scale study is used to estimate the benefits of advanced building control technologies that can be integrated during a retrofit. The predictive control approach uses dynamic estimates and predictions of zone loads and temperatures, outdoor weather conditions, and HVAC system models to minimize energy consumption while meeting equipment and thermal comfort constraints. The paper describes the on-line hierarchical control system, including communication of the optimal control scheme with the building automation system, the controlled set points and the component-level feedback loops, as well as the performance benefits from the demonstration. The experiments conducted and the receding control algorithm implementation results are described. Site measurements show this algorithm, when implemented in state-of-the-art direct digital control systems, consistently yields energy savings of 60% or more relative to pre-configured rule-based schedules, without sacrificing indoor comfort conditions.
INTRODUCTION
Buildings are responsible for more than 40% of global energy consumption. In aggregate, heating, ventilating, and air conditioning (HVAC) account for 27% of energy consumption and 45% of peak electrical demand in commercial buildings and represent a substantial energy use reduction opportunity. Building Management Systems (BMS) serve about one-third of the nearly 67 billion ft2 of commercial floor space in the U.S., providing access to real-time data, but are under-utilized. For example, most existing buildings are operated assuming maximum occupancy and worst-case “design day” leading to excessive ventilation and air conditioning. Building control systems are generally organized in a hierarchical manner (Fig. 1). A supervisory layer manages pre-programmed schedules and set-points for device controllers (e.g., air handling units (AHU), rooftop units, variable area volume (VAV) boxes, fan coil units) and a local-loop control layer manipulates actuators with PI controllers. A promising technology is optimal control, which has the potential to reduce whole building energy consumption by up to 10% (0.5-1.7 of the 17 quads of energy consumed by US commercial buildings) [TIAX 2005]. This is achieved by continuously adjusting ventilation rates and temperature set-points to match building occupancy and weather loads. Model Predictive
Control (MPC) provides an implementation option using a system model and an optimization algorithm to adjust the control set-points dynamically. At each control time-step, using weather and internal load measurements and predictions, an open-loop optimal control problem is solved over a finite horizon. For complex constrained multivariable control problems, such as in the process control industry, the use of MPC is prevalent (Morari & Lee 1999; Mayne et al. 2000; Borrelli 2003); because it has the unique ability to systematically and effectively handle constraints on control and states. MPC for supervisory control of buildings has been proposed (Kelly, 1988) and recently simulation and small-scale testbed experiments have been reported illustrating potential benefits, e.g. by Henze et al (2004, 2005) and Clarke et al (2002). Most of these focused on taking advantage of time-of-day utility rates to shift loads and minimize energy costs. Very recent studies report exploration of MPC in thermally activated low energy buildings with radiant HVAC systems (Siroky et al. 2011). However, measured performance from on-line MPC implementation in full-scale buildings with typical HVAC systems and control architectures is lacking. This is precisely what motivated the current study and the test results presented here characterize the achievable performance benefits and address practical implementation issues.
A demonstration of MPC was conducted at the U.S. Army Corps of Engineers Construction Engineering Research Laboratory (CERL) in Champaign, IL. The facility’s age, mixed use, and HVAC systems is representative of existing building stock. The use of wireless sensors to reduce retrofit installation cost was explored with Oak Ridge National Laboratory, and reported in Bengea et al. (2012). The network operated reliably during the tests and includes motion; space temperature, humidity, and CO2, and supply temperature sensors in all zones.
Figure 1. (Left) Multi-Zone Unit schematics illustrating hot and cold coils, mixing dampers, ducts serving five zones and key variables. (Right) Hierarchical control architecture diagram
with MPC algorithm at supervisory level and HVAC actuator control at low level.
BUILDING AUTOMATION SYSTEM AND HIERARCHICAL CONTROL
ARCHITECTURE
The HVAC system serving a 7,000sq. ft. space in Building II at the Construction Engineering Research Laboratory, US Army Corps of Engineers, Champaign, IL, was retrofitted and used as a living laboratory for the project. This building area has diverse utilization and consists of open plan office with cubicles, individual offices, dining space, laboratory space, storage space and conference spaces. The HVAC system, illustrated in Figure 1 (left), is a centralized
dual-duct multi-zone AHU that receives chilled and hot water from central chiller and boiler plants, and supplies conditioned air to five zones. Each zone is supplied with airflow and temperature generated at the AHU through a combination of hot and cold deck airflows in proportions that are controlled by zone dampers based on the difference between occupant-set thermostat and actual space temperatures.
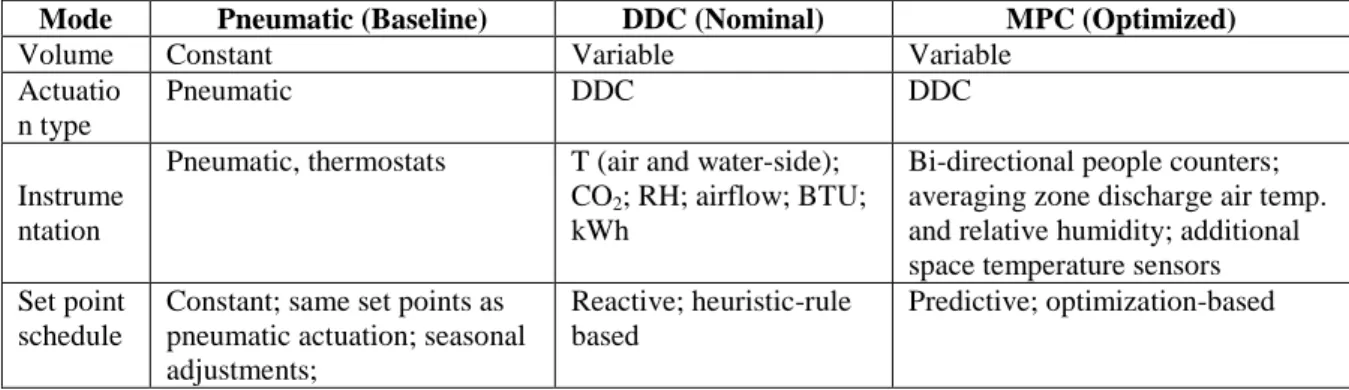
To demonstrate the benefits of optimal control, the HVAC system was retrofitted in two stages (see Table 1). First, the existing pneumatically-actuated constant-volume system (also referred to as “pre-retrofit”) was upgraded to a state-of-the-art Digital Direct Control (DDC) system with variable flow (also referred to as “post-retrofit”). Secondly, the pre-configured schedules implemented in the BAS were replaced by set points generated by the model-based optimization algorithm (described later); this is referred to as the optimal control mode. A mode of operation for each of the three different schedules was implemented to enable flexible and reliable operation of the BAS and HVAC system.
Table 1. The HVAC system retrofits for all three modes of operation evaluated
Mode Pneumatic (Baseline) DDC (Nominal) MPC (Optimized)
Volume Constant Variable Variable
Actuatio n type
Pneumatic DDC DDC
Instrume ntation
Pneumatic, thermostats T (air and water-side);
CO2; RH; airflow; BTU; kWh
Bi-directional people counters; averaging zone discharge air temp. and relative humidity; additional space temperature sensors Set point
schedule
Constant; same set points as pneumatic actuation; seasonal adjustments;
Reactive; heuristic-rule based
Predictive; optimization-based
The supervisory control architecture has two main layers (see Figure 1 right). The optimization algorithm resides at the supervisory level and is implemented on a control platform that communicates in real-time with the BAS via Open Process Control communication protocol. The optimization algorithm uses sensor measurements and system models to generate set-points. These set points are used by the local controllers implemented at the lower level (also see Figure 1 right). The local control loops involve the variable frequency drives, multi-zone unit (MZU) damper actuators, zone flow damper actuators, and proportional electrical valves to control the flows in the hot and cold deck coils.
MODEL PREDICTIVE CONTROL APPROACH
The MPC algorithm uses a comprehensive model that integrates static models of MZU components and dynamic models for zone temperatures. The key variables are illustrated in the signal flow chart of Figure 2 and include: MZU-level mixed flow temperature and volume rate; supply fan power and volume rate; hot and cold deck flows and temperatures on water and air-side; zone-level mixed-flow air temperature and supply flow; zone space temperatures; return flow mixing; return fan power consumption. The semi-empirical models used are not detailed in this paper.
All flow, temperature and power variables can be combined into a single state vector x to formally describe the MPC problem. The integrated model generates predictions over a three-hour time horizon to generate open-loop optimal set points at every sampling time and requires estimates for all disturbances over this time interval. The disturbances, denoted asw, are generated using models or forecasts. The ambient conditions are obtained on-line from the National Oceanic and Atmosphere Agency (NOAA). The water supply temperatures for both cooling and heating coils are assumed to be constant during the prediction horizon, based on
the chiller and boiler plant schedules. The zone thermal loads are forecasted based on occupancy models. The control inputs, denoted byu, are: supply flow; mixed-air temperature; hot and cold deck discharge air temperature; supply temperatures for each zone.
Figure 2. Signal flow chart of HVAC component models (the variables in green are obtained from forecasts or external subsystems, and those in orange are optimized by MPC algorithm)
The MPC problem is formulated by combining system dynamics, MZU HVAC components operational constraints, occupant comfort constraints and optimization cost. At each sampling time t the optimization problem is formulated over a 3-hour prediction horizon uniformly sampled with period T; the integrated HVAC system and building thermal model can be expressed as f(xk+1|t,xk|t,uk|t,wk+1|t,wk|t) =0 for all future steps k over the prediction horizon, where xk|t,uk|t and wk|t are respectively the values of the state, input and disturbance at time
t+k*Tpredicted at timet. The constraints can be expressed asg(xk+1|t,xk|t,uk|t,wk+1|t,wk|t) ≤0for the same future steps k. The continuous-time one-step optimization cost is defined as Jck|t
=∫(rePf+ rePc+ rhPh)dτ on the interval [k*T, (k+1)*T] where: re, rh denote utility rates for electrical power and gas, respectively; Pf,Pc, Ph denote the model-based estimates of power consumption for fans, chilled and hot water, respectively. The integral is approximated by a trapezoidal discretization and is denoted byJk|t. MPC solves at each time steptthe following optimization problem: minU,X (J0|t+...+J(N-1)|t) while meeting the equality constraints
f(xk+1|t,xk|t,uk|t,wk+1|t,wk|t) =0and inequality constraintsg(xk+1|t,xk|t,uk|t,wk+1|t,wk|t) ≤0for all steps
k over the optimization interval [t, t+(N-1)*T] where U={u0|t,…, uN-1|t} is the set of the predicted control inputs at time t, X={x1|t, … ,xN|t} is the set of the predicted system states at time t, starting from the initial measured state x0|t and applying the input sequence U to the system model f. Let the optimal control input solution at time t be denoted by U*={u*0|t,…,
u*N-1|t}. Then, the first step of U*, u*0|t ,are the optimal set points at the step t and they are communicated to the BAS. The optimization is repeated at time t+T with the updated new state x0|t+T, from measurements, yielding amoving or receding horizon control strategy. The optimization problem has nonlinear cost and nonlinear constraints and is solved using the interior-point nonlinear programming solver Ipopt (Wächter and Biegler, 2006).
EXPERIMENTAL RESULTS AND PERFORMANCE FOR DDC RETROFIT MODE
The performance of the retrofitted system was first established. The energy savings are 35% or more for the dynamically-optimized variable-volume post-retrofitted system when
compared to the energy use of the original pneumatic system; the latter was mimicked via constant control set points in the tests conducted with the DDC systempost facto.
Figure 3. (Left) Ambient temperature during the pneumatic and DDC modes (0F); (Right)
Average zonal load conditions during the pneumatic and DDC modes (KWh/day)
To ensure consistency of weather and load patterns, the pneumatic and DDC modes were executed sequentially in 2011: the DDC mode was executed during July 5-13, and the pneumatic mode was executed during July 16-31. The similarity between the conditions in these two periods is illustrated in Figure 3 with measured ambient temperature and the estimated zonal loads. The similarity between the external ambient and internal usage conditions for the two modes enables a direct comparison of measured thermal and electrical meter energy consumption, without subjective normalization, as illustrated in Figure 4 (center). The relative energy savings achieved during post-retrofit operation compared to the pre-retrofit baseline is approximately 35%. These savings come from at least three improvements in the DDC mode system operation: (i) reduced operation hours: as opposed to the pneumatic system that operates at constant volume and set points 24/7, the DDC system was pre-configured to operate only during working hours (note in Figure 4 (right) that the DDC-mode supply flow value is zero during the weekend of July 9-10); (ii) modified set points: in contrast to the pneumatic scheduled fixed set points for all weather and load conditions, the DDC schedule uses installer-generated heuristics to configure and adjust these values seasonally. These differences are evident in Figure 4 (left), where it can be observed that the DDC mode saves energy by lowering hot deck discharge air temperature (red) and supply flow (green); (iii) improved local controls: the local controllers are improved using features beyond the capabilities of the original pneumatic controllers (such as the integral action of the DDC’s PI control algorithm; economizer; temperature and pressure resets).
Pneumatic DDC 50 60 70 80 90 100 0 3 6 9 12 Pneumatic DDC 0 500 1000 1500 2000 Fan Fan Heating Heating Cooling Cooling
Zone 1 Zone 2 Zone 3 Zone 4 Zone 5 0
1 2 3 4
Zone 1 Zone 2 Zone 3 Zone 4 Zone 5 0 1 2 3 4 Pneumatic DDC
Figure 4. (Left) Average set points for cold (blue) and hot (red) deck discharge air
temperature (0F) and measurements for supply flow (green; KCFM); (Center) MZU energy
consumption (KWh/day) comparisons; (Right) Average difference (0F) between zonal set
points and actual temperatures
The savings are generated while improving thermal comfort, measured by the difference between the zone thermostat set points and actual space temperature values. Figure 4 (right) shows that thermal comfort is significantly improved for the state-of-the-art DDC system.
EXPERIMENTAL RESULTS AND PERFORMANCE COMPARISON FOR POST AND OPTIMIZED MODES
We now summarize the performance benefits with HVAC system set points being generated by the MPC algorithm (henceforth referred to as MPC mode) during a weeklong test window in February 2012. To estimate energy savings, we have used data for days when ambient conditions as well as indoor conditions were similar for the MPC and for the DDC modes. Thus, for each day when the MPC algorithm was executed, a set of DDC-mode days were carefully identified with similar ambient temperature patterns (not just average or peak outside temperatures as is often done). Such a comparison is illustrated as an example in Figure 5 where four DDC-mode days were identified to have similar conditions as the MPC-mode day on Feb. 14, 2012. In selecting the DDC-MPC-mode days for comparison, in addition to the ambient-temperature-similarity criteria, the chiller operation status and the indoor thermostat set point values were also ensured to be similar. It should be noted that although back-to-back weeks and days of DDC-mode and MPC-mode tests were conducted, identical conditions were very difficult to establish due to highly variable weather and indoor usage patterns as is to be expected in a practical environment. This implied that a DDC-mode day that best correspond to a given MPC mode day often was selected from a different day of the month (sometimes extending to nearly a year prior). Despite best efforts to carefully baseline the estimates, there is variability in savings estimated and this is a subject of ongoing research. Based on this data it was concluded that energy consumption was consistently reduced and on average the energy savings were more than 65%, and peak-power was generally reduced, with one exception, and on average reduction was nearly 25%.
06:00 09:00 12:00 15:00 18:00 32 34 36 38 40 42 44 46 Time (HH:MM) T e m p e ra tu re ( oF ) MPC DDC 1 DDC 2 DDC 3 DDC 4
Figure 5. (Left) Ambient temperature for MPC (red; Feb. 14, 2012) and DDC (Mar. 15, 2011; Nov. 28, 2011; Jan. 27, 2012; Nov. 10, 2011). (Right) Total HVAC energy (electrical and
thermal) consumption and maximum power for MPC-mode and DDC-mode days
The above procedure was employed to estimate energy savings from multiple datasets for MPC and DDC modes of operation. Figure 6 shows the consistent savings achieved. Average energy consumption for the HVAC system is dramatically reduced by 60-85% over DDC-mode levels. Peak power usage was generally reduced by 10-35%. In cases where the peak power increased, see Test #1 and 4 in Figure 6 (right), the peak was noted to occur only early in the day when starting the HVAC system, and the MPC algorithm “over reacts” to the out-of-comfort-range temperatures from when HVAC system was shut down. This transient peak could be managed via better trade-off between energy use and peak power. The HVAC system energy savings accomplished are attributed to the MPC algorithm’s effectiveness in
dynamically decreasing the multi-zone air handling unit hot deck temperatures and supply airflow rates when favorable, and increasing the cold deck temperatures when favorable compared to what was pre-programmed in the post retrofit mode. Also illustrated in Figure 6, are the indoor comfort metrics for zonal temperature tracking and CO2 levels, showing that
the controlled space temperatures are maintained within the constraints set, namely ± 1oF of set point TSP, sometimes with more improved tracking with MPC modes, and are within the
CO2 level limit (as derived from ASHRAE 62.1 standard) with the exception of one case
where the constraint is violated.
0 100 200 300 400 500 600 700 800 900 1000 Test #1
Savings: 80% Savings: 67%Test #2 Savings: 64%Test #3 Test #4
Savings: 68% Savings: 85%Test #5 Average DDC MPC 0 10 20 30 40 50 60 70 80 Test #1
Savings: none Savings: 24%Test #2 Savings: 11%Test #3 Test #4
Savings: none Savings: 35%Test #5
Average DDC
MPC
Figure 7. (Left) HVAC system average energy consumption comparisons (KWh); (Right) HVAC system peak power consumption comparisons (KW)
70 70.5 71 71.5 72 72.5 73 73.5 74 A ve ra ge In d o o r T _ SP ( oF)
Test#1 Test#2 Test#3 Test#4 Test#5
DDC MPC 400 500 600 700 800 900 1000 1100
Test#1 Test#2 Test#3 Test#4 Test#5
DDC MPC M ax im um In do or CO 2 Le ve l( pp m ) Upper Limit on Indoor CO2 Levels
Figure 8. Summary of indoor environmental measurements, illustrating the MPC performance, relative to DDC mode, in tracking occupant space temperature relative to zone
set point TSPduring occupied hours (see left) and maintaining indoor CO2levels (see right).
CONCLUSIONS
The on-line implementation of model-based predictive and optimal control of an existing HVAC system in a mid-size office building was evaluated as a proof-of-concept. This appears to be a first of its kind full scale deployment in a building with conventional HVAC systems. The on-line MPC algorithm aimed to increase overall efficiency by continuous adjustment of system operation, heating and cooling set points and fresh air levels brought into the building, based on forecasted and estimated occupancy levels, internal loads and weather conditions. The optimization and control algorithms were integrated with a modern building automation system and evaluated experimentally over multiple test windows at the site. A 60-85% reduction in HVAC system energy use was demonstrated compared to state-of-the-art DDC system sequence of operations. Comfort constraints, involving occupant-driven space temperature set points and CO2 level limits, were maintained or improved. This was in
addition to a 35% improvement achieved when upgrading the building from a pneumatic control system, achieved via off-line adjustments of the system schedule of operation and
heuristic adjustments of the heating and cooling coil set points, as typically practiced in industry state-of-the-art DDC systems. Challenges remain in addressing the degree of variability observed in the demonstrated benefits, encountered in practical building operation, and the issue of appropriate baseline definition deserves additional research. The predictive control methodology pursued here can be extended to hydronic heating and cooling systems where variable speed technologies are becoming prevalent and robust, but multivariable optimal control methodologies are lacking.
ACKNOWLEDGEMENT
The authors are grateful for the financial support and guidance provided by the SERDP/ESTCP Office under the leadership of Drs. Jeff Marqusee and Jim Galvin for this project EW-0938. ERDC-CERL CFE and the University of Illinois provided demonstration site support, particularly David Schwenk, Andrew Friedl, Joe Bush and Clint Wilson. CERL researchers authored the original sequence of controls. Mike Boogemans, Alpha Controls and Services, retrofitted the systems and implemented the DDC mode. Mr. Teja Kuruganti and his team at ORNL supported the sensor network installation and commissioning.
REFERENCES
Borrelli, F. 2003. “Constrained Optimal Control of Linear and Hybrid Systems”. Lecture Notes in Control and Information Sciences, Springer-Verlag. Vol 290.
Clarke, J., J. Crockroft, S. Conner, J. Hand, N. Kelly, R. Moore, T. O’Brien, and P. Strachan. 2002. “Simulation-assisted control in building energy management systems”. Energy and
BuildingsVol. 34, pp. 933–940.
Energy Impact of Commercial Building Controls and Performance Diagnostics: Market
Characterization, Energy Impact of Building Faults and the Energy Savings Potential,
TIAX Report D0180, for U.S. DOE Contract 030400101, Nov 2005.
Morari, M. and J. Lee. 1999. “Model predictive control: past, present and future,”Computers
and Chemical Engineering, Vol. 23, pp. 667–682.
Mayne, D., J. Rawlings, C. Rao, and P. Scokaert. 2000. “Constrained model predictive control: stability and optimality,”Automatica, Vol. 36, No. 6, pp. 789–814.
Henze, G., D. Kalz, C. Felsmann, and G. Knabe. 2004. “Impact of forecasting accuracy on predictive optimal control of active and passive building thermal storage inventory.”
HVAC&R Research, Vol. 10, No. 2, pp. 153–177.
Henze, G., D. Kalz, S. Liu, and C. Felsmann. 2005. “Experimental analysis of model-based predictive optimal control for active and passive thermal storage inventory”. HVAC&R
ResearchVol. 11, No. 2, pp. 189–213.
Kelly, G. 1988. “Control system simulation in North America”. Energy and Buildings Vol. 10, pp. 193–202.
Siroky J, Oldewurtel F, Cigler J, Privara S. 2011, “Experimental analysis of model predictive control for an energy efficient building heating system”.Appl Energy. Vol. 88, pp. 3079– 3087.
Wächter and L. T. Biegler, “On the Implementation of a Primal-Dual Interior Point Filter Line Search Algorithm for Large-Scale Nonlinear Programming”, Mathematical Programming
106(1), pp. 25-57, 2006.
Bengea, S., Borrelli, F., Kelman, A., Killough, S., Kuruganti, T., Lin, Y., Manges, W., Narayanan, S., Taylor, R., Vrabie, D., Woodworth, K., Yuan, S., “A Wireless Platform for Energy-Efficient Building Control Retrofits”, Final report draft, ESTCP Project EW-0938, June 2012.