MÁSTER EN GESTIÓN TÉCNICA Y ECONÓMICA EN EL SECTOR ELÉCTRICO
TESIS DE MÁSTER
Role of the Physical Power Exchanges in
the Electricity Wholesale Market
AUTOR: CORALIA VERDUGO PENADOS MADRID, 8 Octubre 2008
ESCUELA TÉCNICA SUPERIOR DE INGENIERÍA (ICAI)
INSTITUTO DE POSTGRADO Y FORMACIÓN CONTINUA
Coralia Verdugo Penados
EL DIRECTOR DE LA TESIS
Tomás Gómez San Román
Fdo: Fecha: 8 /10/2008
Vº Bº del Tutor de la Tesis
Mariano Ventosa
Summary
The electricity sector worldwide is undergoing a deep transformation from vertically integrated utilities to unbundled companies that operates in a competitive market. The liberalization era in Europe dated back in the 90´s and had an important impact in the way the electricity is treaded. As a result of this transformation the Power Exchanges appeared as a centralized entity in which the supply and demand meets creating a competitive market based mechanism to procure the electricity. The main objective of this thesis is to analyze the role of the Power Exchanges in the wholesale electricity market, the advantages that this scheme represents and the key elements that are necessary to achieve a successful market mechanism. First an introduction of the liberalization process is presented follow by the main aspects and background of the liberalization process in Europe and a description of how physical organized electricity markets works. In the next chapters it is presented a description of four different Power Exchanges in Europe, Nord Pool (Scandinavia), Omel (Spain), Opcom (Romania) and Powernext (France). Finally some concluding reflexions about the implementation of the Power Exchanges in the markets analyzed.
Table of Contents
1. INTRODUCTION... 2
1.1 Introduction... 2
2. BACKGROUND: LIBERALIZATION OF THE EUROPEAN ELECTRICITY SECTOR... 8
2.1 Background: Liberalization of the European Electricity Sector... 8
3. PHYSICAL ORGANIZED ELECTRICITY MARKETS... 13
3.1 Electricity Trading... 13
3.2 The Electricity Power Exchanges and Power Pools... 15
3.3 Role of the Power Exchanges... 17
3.4 Spot Markets... 18
3.5 Trading on a Spot Market... 19
3.6 Behaviour of electricity spot prices... 22
3.7 Risk Management in Spot Markets... 27
3.8 Power Exchanges Comparative... 29
3.9 References... 30
4. THE SCANDINAVIAN SPOT MARKET (NORD POOL)... 32
4.1 Scandinavian Electricity Sector Summary... 32
4.2 The Nord Pool Spot Market... 36
4.3 Regulator... 39
4.4 Elspot: Day ahead... 40
4.5 Elbas: Hour-ahead... 45
4.6 Real Time Market (System Operator Market)... 46
4.7 Nord Pool´s Financial Market... 47
4.8 References... 49
5. THE SPANISH SPOT MARKET... 51
5.1 Spanish Electricity Sector Summary... 51
5.2 The OMEL Spot Maket... 52
5.3 Regulator... 53
5.4 Daily Market... 53
5.6 System Operator Process... 66
5.7 Iberian Market... 67
5.8 References... 70
6. THE ROMANIAN SPOT MARKET (OPCOM)... 72
6.1 Romanian Electricity Sector Summary... 72
6.2 The OPCOM Spot Market... 73
6.3 Regulator... 76
6.4 Day Ahead Market (DAM)... 76
6.5 Balancing Market... 79
6.6 References... 82
7. THE FRENCH SPOT MARKET (POWERNEXT)... 84
7.1 French Electricity Sector Summary... 84
7.2 The PowerNext Spot Market... 85
7.3 Regulators... 88
7.4 Day-ahead market... 88
7.5 Balancing Mechanism (System Operator)... 94
7.6 Trilateral Market Coupling... 95
7.7 References... 97
8. KEY FEATURES OF THE ELECTRICITY SPOT MARKETS... 99
9. FINAL REFLEXIONS... 103
10. DEFINITIONS AND ACRONYMS... 109
Table of Figures
Figure 1. Wholesale and Retail Electricity Market... 3
Figure 2. Electricity Trading Markets ... 14
Figure 3.. European Power Exchanges ... 16
Figure 4. Supply and Demand Curves ... 20
Figure 5. Structure of an Auction Algorithm... 21
Figure 6. Supply curve construction... 23
Figure 7. Supply curve construction... 25
Figure 8. Nord Pool Spot Shareholders... 37
Figure 9. Nord Pool Day-Ahead Spot Market Price/Volume History 1993- 1998 (prices Norwegian Krone) ... 43
Figure 10. Nord Pool Day-Ahead Spot Market Price/Volume History (prices in EUROS) ... 44
Figure 11. Sequence of operations in the Scandinavian markets... 47
Figure 12. Schedule Stop Condition... 57
Figure 13. OMEL Daily Market Price/Volume History... 58
Figure 14. OMEL Intraday Market Price/Volume History ... 62
Figure 15. OMEL Price Historic Volatility ... 64
Figure 16. Daily and Intradaily Timetable in OMEL... 65
Figure 17. Sequence Processes in the Spanish Market ... 67
Figure 18. Iberian Market Results ... 68
Figure 19. One and Two side Auction... 73
Figure 20. OPCOM Daily market Results ... 79
Figure 21. Powernext Shareholders ... 86
Figure 22. Powernext Day-Ahead timetable... 91
Figure 23. Powernext Day-Ahead Market Price/Volume History... 92
Figure 24. Powernext Historically Price Volatility ... 93
Tables
Table 1. European Power Exchanges... 17
Table 2. Comparative Table of Power Exchanges... 29
Table 3. Norway Specifications ... 33
Table 4. Sweden Specifications... 34
Table 5. Finland Specifications ... 35
Table 6. Denmark Specifications ... 36
Table 7. Nord Pool Trading Fees... 39
Table 8. Price dependent schedule... 41
Table 9. Price Independent Schedule... 41
Table 10. Nord Pool Day-Ahead Prices and volume... 44
Table 11. Timetable for Daily Market Sessions ... 56
Table 12. OMEL Average Prices and Energy traded ... 58
Table 13. Timetable for Intraday Sessions in OMEL ... 60
Table 14. OMEL intraday average prices and energy traded... 63
Table 15. Volumes traded befote and alter MIBEL ... 69
Table 16. OPCOM Market Evolution... 75
Table 17. Powernext Trading Fees ... 87
Table 18. Powernext Default Offer Block Products ... 89
Table 19. Powernext Day-Ahead prices and volumes... 92
1
Introduction
1.
Introduction
1.1 Introduction
The objective of this Study is to provide an overview of the role and responsibilities of the Power Exchanges in a competitive and liberalized electricity market in Europe. These Power Exchanges differ country to country with respect to diverse market design, regulatory framework and the background of the electricity industry. Procedures and organisation of four Power Exchanges within Europe are presented.
The reform of the electricity sector in the European Union, according to the provisions of European Directive 96/92/EC 1 and then replaced by the 2003/54/EC 2, involved the unbundling of the activities of Generation, Trading and Supply from the natural monopoly regulated activities such as Transmission and Distribution. Competition in Generation, Supply and Trading must be able to take place without barriers, while natural monopolies will be conceived as regulated activities.
The primary objectives of electricity market liberalization are the achievement of a feasible competitive Wholesale market that provides market-based electricity prices to consumers, guarantees the system security and the efficient utilization and availability of the resources.
Wholesale competition is enhanced on the supply side, by participation of several generation companies, and on the demand side by allowing customers to buy directly or indirectly from generators trough customer choice.
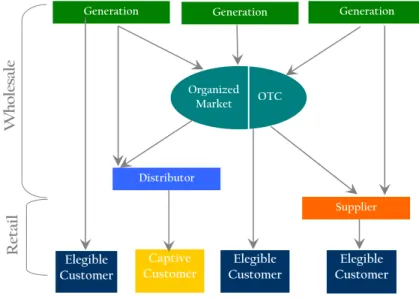
In the next figure is represented schematically the Wholesale and Retail Electricity Market, the stakeholders and the interaction between them.
1 Directive 96/92/EC of the European Parliament and of the Council of 19 December 1996 concerning
Common Rules for the Internal Market in Electricity
2 Directive 2003/54/EC of the European Parliament and of the Council of 26 June 2003 concerning
Generation Generation Generation Distributor Supplier Elegible Customer Elegible Customer Elegible Customer Captive Customer Re ta il Wh o le sa le Organized Market OTC
Figure 1. Wholesale and Retail Electricity Market
The liberalization formally outlines minimum regulatory functions and competencies of national regulatory authorities. In particular the EU Electricity and Gas Directives acknowledge that regulatory authorities have an important role on ensuring the operation of an internal market of electricity. The Directives specifically summarise their regulatory functions in general terms as:
• Non-discriminatory access to Networks
• Effective competition and the efficient functioning of the market
An important aspect of the liberalized framework is the development of facilities for electricity trading among different market agents. Electricity can be traded physically or financial, bilateral and nowadays in many Member States it is been traded through organized electricity markets (Spot Markets organized in Power Exchanges) 3.
Before the liberalization, the electricity industry was organized in vertically integrated utilities, usually monopolies that performed all the activities (generation, transmission and supply). One of the meanings for such framework was the prominent
economies of scale of the generation and the need for a centralized control and dispatch for generation and transmission.
There are some characteristics of electricity which are particularly relevant when designing the trading scheme, electricity can not be economically stored and it is delivered to final consumers at the time it is being produced, this means that the supply and demand must be in balance at any time. The consumption of electricity varies with respect to the season, day of the week and hour of the day. The demand side generally follows this consumption pattern that makes the forecast easiest to predict.
The main goals of the Power Exchanges lies in facilitate the trade of electricity in a short term and the promotion of information, competition, and liquidity. Power Exchanges may also provide other benefits, such as easy access, low transaction costs, neutral marketplace and price reference, safe counterpart and clearing, and settlement service (OSCOGEN, 2002).
The Spot Markets are created to provide an organized wholesale transactional environment where demand meets production at the lowest price (see section 3.6). Spot Markets may be characterized with respect to the following aspects:
• Market participation (voluntary or mandatory)
x Trading timing • Traded products • Bid and offer format
• Trading method and pricing criteria • Settlement and clearing
• Congestion Management (in some countries the transmission capacity allocation is managed in an implicit way in the Power Exchange)
A new independent figure arise from this structure, the Market Operator, which is the entity responsible for the management of the Organized Market (Spot Market) assuring the competitiveness and performing monetary settlements for the transactions. Governance of the Market is ensured by the Market Operator complemented by the Energy Regulator appointed and acting on behalf of Governments (either the Industry or the Finance Ministries).
The Spot Market is most often defined as a Day-ahead market where individual prices and physical quantity transactions are determined one day in advance (D-1) under a transparent and accepted set of trading arrangements for each of the 24 hours of the following day (day D). Those markets are the key link between the price convergence in the Financial and Bilateral arrangements.
The Spot Markets can be complemented with several Intra-Day sessions also known as Hour-Ahead where each participant can adjust up to a point closer to real time their open position, this way can diminish their risks of being out of balance and therefore being obliged to pay imbalance prices, and in that order help to lower the balancing load on grid operators.
The existence of a Power Exchange is fundamental for a well functioning of the retail market since a liquid Power Exchange gives the suppliers the opportunity to procure energy without the need to own production capacity. In short a Power Exchange is a trading platform operating by a Day-ahead facilitating anonymous trade in an hourly basis.
The System Operator plays an important role in the wholesale market because it manages the services needed to maintain in real time the energy balance and network stability for the entire system, using in some cases, market based mechanisms to acquire it.
The Balancing Market is an organized market, carried out by the Transmission System Operator (TSO), where players with dispatchable units and loads can make balancing bids. With the balancing bids, participants offer regulation services, i.e. they offer to increase or decrease their power production (or consumption) for a given hour of operation.
The Balancing Market opens after the Spot Market closure. The submission of balancing bids starts on the day-ahead (and can continue on the intra-day, depending on the country).
The scope of this study is to describe the Power Exchanges and its mechanism. But, because of the importance of the Balancing Market in maintaining the balance in the system and its relation with the Power Exchanges, along this document will be presented a general idea of the Balancing Market.
2
Background: Liberalization of the
European Electricity Sector
2.
Background: Liberalization of the European Electricity Sector
2.1 Background: Liberalization of the European Electricity Sector
During the 1990s significant changes occurred in the European Electricity Sector. Electricity Industry had evolved from vertically integrated monopolies which covered the entire electricity business chain: Generation, Transmission, Distribution and Retail Supply, to unbundled companies separating the competitive activities (Generation and Supply) from the natural monopolies (Transmission and Distribution). The access to the network become regulated for the transmission and distribution companies, progressively the clients are becoming eligible to chose their electricity supplier, new institutions and organization had arisen and some companies became private own, all of these changes and process is known as Liberalization.
In the traditional regulated structure companies usually state-own runs the Generation, Transmission and Distribution, they also had the exclusiveness to supply electricity to residential, commercial and industrial retail costumers who have no choice to choose their electricity supplier.
The sector was characterized by having high construction and operating costs, costly centralized dispatching usually driven by political decisions, limited or null competition, slight innovation, risk-free investment and the regulator guarantee the full recover of all the costs incurred, as a result retail prices were very high.
Discussions on Europe electricity liberalization began in 1992 but became a reality when in 1996 an agreement was reached with the first and second Directive 96/92/EC and 2003/54/EC, previously mentioned. These two Directives focus on the unbundling of the industry and on a gradual opening of national markets promoting the competition of the Electricity Sector.
The first European countries that liberalize were England & Wales and Norway in 1990, since then almost all European countries have liberalized their electricity markets up to the present.
The overriding goals of the reform are the increase of competition and transparency, deal with social environmental concerns, reduce prices, increase the cross- border trade, improve the performance of existing systems and facilities, and invest in Research & Development.
The Liberalization in short means the opening of the sector to competition. Could involve all or some of the following aspects:
Restructuring
Vertical unbundling aim to separate the competitive activities such as, Generation and Supply, from the regulated activities, Transmission and Distribution. Legal, accounting, management or ownership separation is required in order to prevent cross subsidy of activities. Vertical integration between Generation and Supply (both competitive activities) is allowed and it appears to have a strong commercial motivation.
Competition
• Wholesale competition: Retail companies and large consumers are authorized to buy electricity directly from generators while the distribution companies maintain local franchise over retail consumers with regulated Third Access Party (TAP).
• Retail competition: The 2003 Directive requires that customers can freely choose their power supplier according to the offerings that best meet their needs. On July 1st 2004 for non-households followed by full market opening to allow all household customers by July 1st 2007. The electricity can be purchased to energy service companies (suppliers, traders, retailers) or directly from generators.
Since mid 2007, household customers have also the right to choose whether to go to the free market or stay in the regulated market being supplied by distribution companies at regulated tariffs.
• The way electricity is contracted is not regulated by the Directive. Many schemes or markets may exist and are already functioning in the
European Union, the most applied are Bilateral Contracts (Over the Counter Market) and Power Exchanges or Power Pools (Organized Market) based on bid prices, both markets are complementary.
Wholesale market and Retail competition allow new entrants into generation and supply, improving quality of service, investment and security of supply.
Regulation
In order to liberalize the Electricity Sector the regulatory design must establish appropriate structural, institutional, and operational framework. It is generally recognized that regulatory design and implementation should take into consideration the specific characteristics of the sector in question. The regulation must be a tailor-made scheme in order to avoid problems at the time of implementation.
The experience had shown that regulatory design is essential for the success of the Electricity Market. Successful reforms can improve the efficiency of the sector offer lower prices and better quality of service. At the same time, flawed regulatory design can undermine the benefits of reforms.
The regulator needs to establish clear rules for the Wholesale market since regulatory risk is one of the main problems when investment takes place. The assignments of the regulatory authority include the advisement to the government, arbitrage, fix the tariffs for the regulated activities, authorize new facilities, supervise anti-competitive actions, promote competition between competitive activities, and perform drafts for new regulation, among others.
Privatization
Privatization is not a prerequisite for liberalization and not all of the countries have adopted, for example Belgium and Germany were already privatized before the liberalization, United Kingdom, Portugal and Spain
undergone an extensive privatization, partially privatization took place in Italy and France chooses to keep state owned.
However there are significant evidence that privatization deliver benefits, like improving productivity and quality service, maximize short-term returns to shareholders, reduce the public costs, large effect on investments. All these can be achieved when combined with effective restructuring, competition and regulation.
The performance of liberalization can be measured in a number of ways, here are presented some of them:
x Electricity prices, the most important indicator. It is important to mention that this indicator also depends on other factors such as fuel markets prices, price convergence in national gas markets, interconnection capacity, emissions allowances and trading, etc.
x Price and tariff convergence
x Customers change of supplier activity
x Increase in productivity
x Customer contract renegotiations with suppliers
x Number of available suppliers and offers
x Customer satisfaction
x Barriers to new entrants
x Barriers to customer change of supplier
x Convergence of price zones
3
Physical Organized Electricity
Markets
3.
Physical Organized Electricity Markets
3.1 Electricity Trading
Trading electricity consist of buying and selling electrical energy no matter who is the supply and the demand side. Nowadays in the liberalized structure trading constitutes the same approach but the consumers, more known as customers are free to choose their supplier, furthermore to Change Supplier according to the provider that best meet up their needs.
While the supplier can be differentiated regarding the size, technology, prices, etc. electricity cannot be differentiated; all electrons are physically the same, in trading jargon this is known as a “commodity”.
Already back in the eighties professor Shweppe suggests the following:
“There is a need for fundamental changes in the ways society views electric energy. Electric energy must be treated as a commodity which can be bought, sold, and traded, taking into account its time – and space – varying values and costs” (Shweppe, 1988).
In the liberalized era different markets have emerged to trade the electricity.
• Non Organized or Bilateral Trading: Also known as Over-the-Counter (OTC), which means that the negotiations are carried out directly between the parties involved, without a clearing house and where the contracts are not regulated. On this market the electricity can be traded by means of physical delivery or by using financial instruments (Forwards and Option contracts).
• Organized Trading: As its name implies consist in a structured market govern by Spot Markets and organized in Power Exchanges or Power Pools. In the Organized Markets the trading procedures and the structural conditions to operate are establish in the market rules. The Spot Market prices represent an important reference for the financial and bilateral trading in parallel markets.
On the figure below is represented the structure of the electricity trading markets.
Market
Bilateral (OTC) Organized
Physical Financial Physical Financial
Forward Spot
Power Exchange or Pool
Figure 2. Electricity Trading Markets
All the contracts no matter if they where traded on an OTC or organized market, share four characteristics: x Defined amount x Defined price x Defined location x Defined period Physical Trading
Physical Trading means that the electricity traded is going to be produced and delivered, in contrast to the financial trading that is main purpose is to hedge against price volatility.
The timeframe of physical trading can differ depending on the necessities to balance the supply and demand. The contracts can be long term, short or very short term.
3.2 Electricity Power Exchanges and Power Pools
The most evident result of the liberalization process of the electricity industry in Europe is the development of electricity trading and the creation of electricity Power Exchanges. After the liberalization process began, the European electricity industry had undergone a considerable transformation led by a combination of technical innovations, changes in the regulatory framework, political commitments, etc. that had changed dramatically the Wholesale electricity market.
The trading of electricity exists since utilities companies were originally formed. However, there are two main differences between trading electricity before the liberalization process and nowadays, one is the organization or the scheme for trading and the second is that consumers have the freedom to choose their supplier encouraged by the separation between Generation and Transmission and the open to competition of the Generation and Supply activities.
On a liberalized electricity market, the participants can act on two different markets. Traditionally they can trade electricity bilaterally on the Over-the-Counter (OTC) market, where the bulk of transactions is still being traded or in Organized Day-Ahead Markets also called, Spot Markets.
There are two kinds of organized markets: 1. Power Pools
2. Power Exchanges
There are different approaches about the two models, according to (Steven Stoft 2002), Pools are associated with nodal pricing and Exchanges have been associated with zonal prices, anyway the author implies that there are no theoretical reason for this association.
On the other hand, (Boisseleau, 2000) explains the differences between the two models by using two criteria: initiative and participation, this implies that the power pools are the result of a public scheme and the participation is mandatory, this means that all the energy must be traded on the pool. While the Power Exchanges are encourage on a privately basis and the participation is voluntary.
Omel Powernext GME Nordpool Belpex OTE APX TGE Opcom Bronzen UKPX EXXA EEX Omel Powernext GME Nordpool Belpex OTE APX TGE Opcom Bronzen UKPX EXXA EEX
Even though there is no a standard definition regarding the Power Pools and Power Exchanges and for the purpose of this study I will use the second approach that also points out that the players in Power Pools can only be generators and that a side payment is one of the main aspects that differentiated from the Exchanges.
This means that the price on the pool is based on cost minimization and optimal generation dispatch in contrast of matching the demand and the supply side of the Power Exchanges.
One example of the pool system used in Europe was the first England and Wales pool (1990-2001) and the fist years of the Romanian OPCOM pool (2000-2005).
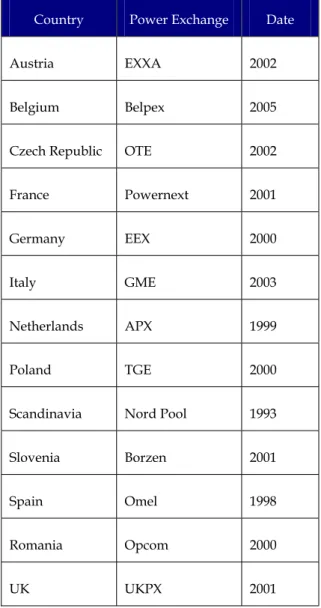
According to the last description the Power Exchange model is currently the most widespread system in Europe. The figure below shows the existing Power Exchanges in the continent and the table below shows the starting date.
Country Power Exchange Date
Austria EXXA 2002
Belgium Belpex 2005
Czech Republic OTE 2002
France Powernext 2001
Germany EEX 2000
Italy GME 2003
Netherlands APX 1999
Poland TGE 2000
Scandinavia Nord Pool 1993
Slovenia Borzen 2001
Spain Omel 1998
Romania Opcom 2000
UK UKPX 2001
Table 1. European Power Exchanges
3.3 Role of the Power Exchanges
The Power Exchanges play an essential role in the new structure of the electricity industry, especially within the European wholesale Market which was until now dominated by bilateral trade. All these Power Exchanges share the same goals. They aim to facilitate electricity trade, foster competition, ensure transparency and become recognized as a European marketplace. Finally, each Power Exchange aims to develop liquidity and credibility of its price index.
Power Exchanges are considered marketplaces, lets remark the word marketplace, is a third party which facilitate transactions between sellers and buyers, they are ruled by its own trading rules and they guarantee the payment.
x Facilitate trading: Power Exchanges make easy the short term trading because it gathers all the stakeholders of the wholesale market in one single market.
x Foster competition: By letting submit bids to generators, distributors, suppliers and eligible consumers. Every participant specifies the desire quantity and the price they are willing to pay/received.
x Ensure transparency: The bids are anonymously, the driver for the price is based on matching the supply and demand curves. The market clearing prices are public.
x Price index: Price in the Power Exchange is published on a daily basis and represent a useful tool for benchmark the bilateral transactions.
x Reduce credit risk: The counterpart for the transactions is the exchange’s clearinghouse. The role of the clearinghouse is to guarantee the financial regularity of the parties.
3.4 Spot Markets
Spot Markets are usually organized by Power Exchanges which provides short term horizons for trading at least a Day-Ahead market. An Intra-Day Market also referred as an Hour-Ahead or Adjustment Market is sometimes offered to get a more accurate balance between demand and supply.
This market closes few hours before the actual physical delivery of the electricity. Additionally, in order to balance power generation to load at any time during real-time operations, System Operators use Balancing or Real-time market, where participants can submit bids that specify the prices they require (offer) to increase/decrease their generation, or decrease/increase their consumption for a specific volume in a short period of time. Furthermore balancing services (also referred to as Ancillary Services) are needed to support a reliable delivery of electric energy (e.g. transmission losses, reactive power support, voltage control, among others) are sometimes also traded on an exchange-based market.
3.5 Trading on a Spot Market
The European Power Exchanges usually provide an auction framework of bidding-based trading for physical delivery during a particular hour of the next day. The usual trading system is a daily double-side (generation and demand) auction for every hour to match transactions at a single price. The product traded is an hourly spot contract that specifies the size (MWh) and value (€MWh).
Type of bids
x Hourly bids
Hourly bids are the more common type of bids and some information is required on each bid, like: participant’s name, type of bid (sale or purchased), hour of the day, quantity and price.
The bidding process is the following:
1. Market agents allowed to participate in the Power Exchange such as (Generators, Distributors, Traders, Suppliers and in some markets qualified Consumers) submit their bids, generally used electronic systems, according to the deadlines specified on the Market Rules, determining the quantity and the price (Block Bid) they are willing to sell/buy. After receiving the bids a verification and validation process is performed.
Each sale bid specifies the quantity and its minimum price at which they seller is willing to supply the energy. On the other hand each buy bid specifies the desired quantity and the maximum price at which they are willing to buy.
2. In some Power Exchanges the participants can add to their bids several conditions or complex bids.
3. The submitted bids are collected and the participants can only know their own bids and cannot see others (anonymous bids).
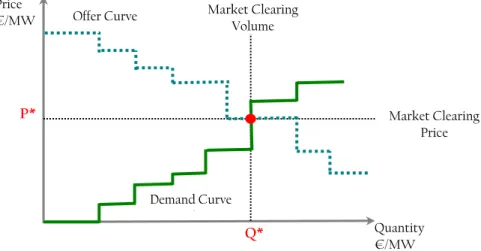
4. For price determination all the bids collected up to the predetermined closure time are arranged on a Merit Order sorted according to the price and aggregated to get a market demand and supply curve for every hour. A block bid must be matched for the entire or partially volume specified, and for all hours. If this is not possible, the block bid is rejected.
5. The clearing or matching price for every hour is settled after the demand and supply curve is aggregated and intersected.
6. The simple bid matching, presented on the figure below, ignores any complex conditions or grid constraints and results in an initial market Clearing Price. Q* P* Price €/MW Quantity €/MW Market Clearing Volume Offer Curve Demand Curve d Market Clearing Price
Figure 4. Supply and Demand Curves
7. The non-existence of an intersection may trigger a second round of submitting bids.
8. There may be a surplus at the market clearing price resulting of the simple bid matching. In this case the volumes of bids with the market Clearing Price as limit are proportionally curtailed, or the algorithm selects the bids according to the time of order book entering (first come, first serve).
9. If all conditions are not satisfied the price solution is not valid. In this case one of the unfulfilled bids is eliminated and the price calculation is run again. This checking process is iterated until all the remaining bids can be fulfilled.
10. The traded volumes of the matched bids have also to be checked against the transmission grid capacities. If there are transmission constraints, the schedules have to be balanced either by only adjusting the trade volumes, by adjusting the trade volumes and re-running the iterative bid matching, or by splitting the market in several areas.
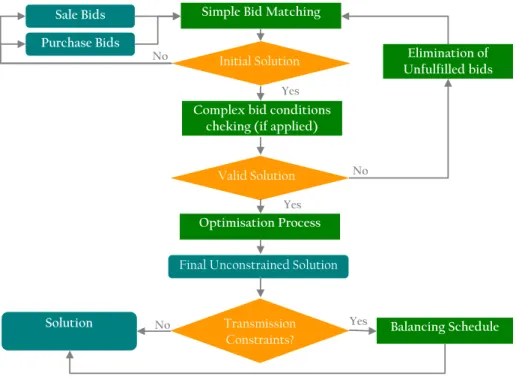
Sale Bids Purchase Bids
Simple Bid Matching
Initial Solution
Complex bid conditions cheking (if applied)
Valid Solution
Optimisation Process
Final Unconstrained Solution
Transmission
Constraints? Balancing Schedule
Solution Elimination of Unfulfilled bids Yes Yes Yes No No No
Figure 5. Structure of an Auction Algorithm
x Block bids
Block bids is an aggregated bid for several consecutive hours with a fixed price and volume. This bidding singularity is due to the fact that some power plants are not that flexible on the start-up process and requires a ramp to achieve its optimal operation, so this kind of bids allows the participants to sell/buy electricity for a period of consecutive hours. The bidding process is the same as the single hour bid with some additional conditions like fill-or-kill option; this means that the whole
amount of energy has to be accepted. In some Power Exchanges the blocks are already specified like the French Power Exchange Powernext or the Nordic Nord Pool.
3.6 Behaviour of electricity spot prices Determining the Market price
Most of the European Power Exchanges set energy prices based on the marginal price auction (or single price auction), this means that all generators are paid the market clearing price. The highest accepted supply bid is the one that determines the price.
In the spot market, the participants specify how much electricity they wish to buy or sell at a given price. For each hour during the following day the participants’ bids are aggregated into supply and demand curves.
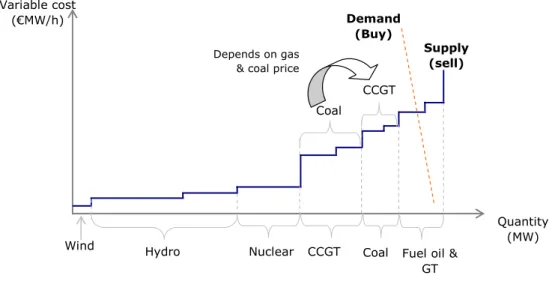
The supply curve consists of the participants’ aggregated sales bids in terms of each technology’s variable production cost, or the marginal cost which corresponds to the cost of increasing or producing one additional unit. The demand curve consists of the participants’ purchase bids also in terms of price and quantities.
The combination of price and quantity where the supply and demand curves match determines the market clearing price.
Hydro Nuclear CCGT
CCGT
Coal Coal
Fuel oil & GT Wind Quantity (MW) Variable cost (€MW/h) Supply (sell) Demand (Buy) Depends on gas
& coal price
Source: own elaboration
Figure 6. Supply curve construction
The supply curve aggregates the bids on a merit order from the unit of production with the lowest marginal cost up to the marginal cost of the last unit of the production needed. This means that demand and supply meet at the lowest possible cost.
Once we have described how the supply curve is shaped, it is essential to explain the factors influencing the variable cost bided.
Fuel cost, carbon allowances cost and variable O&M represent the variable cost that comprises the sale bids. Apart from wind and water power the rest of technologies must rely on the cost of their fuel to operate.
Fuel prices
Fuel costs are a share of total generation costs and vary significantly among technologies. Wind has no fuel costs. For nuclear power, fuel costs represent a small component of nuclear power generation, between 8 and 11%. For CCGTs, fuel costs account for about 75% of total costs. A 50 % increase in uranium, gas and coal prices would increase nuclear generation costs by about 3%, coal costs by about 20% and CCGT costs by about 38% (IEA, 2006).
x Coal prices: The coal-fired power stations depend on buying coal for fuel; when coal becomes more expensive the cost of generating electricity from this fuel rises.
There is a price level on which burning coal to produce power becomes uneconomic and such level of activity may decline. Consequently, the supply will be reduced and boosts prices on the Power Exchange. In 2005, gas-fired generation contributed a lower share of the increasing power needs, because high gas prices provided strong incentives for an increase in coal-fired generation from existing plants.
x Gas prices: Nowadays gas-fired plants are becoming more “popular” in Europe due to a range of advantages. As with coal-fired capacity, these power stations depend on buying gas for fuel. Lower gas prices would improve the terms for such output, which in turn could increase electricity supply, and cut prices. Demand for gas in power generation in the OECD increased from 213 bcm in 1990 to 447 bcm in 2004; an annual average growth of 5.4% (Gas Market 2007).
Considering that the price of natural gas tends to be volatile in some markets, this seems an important drawback for CCGTs. However, it must be remembered that where gas sets the electricity’s marginal price, this volatility can be recovered from the market. In this case, of course, high gas prices directly translate into high electricity prices. High gas prices make other alternative technologies more competitive.
Gas prices are typically indexed to crude and/or oil products such as Low Sulphur Fuel Oil, High Sulphur Fuel Oil, and gas oil; so gas price will increase: when the world crude-oil market tightens, when there are low inventories, when demand rises and refinery capacity meets its production, or when there are speculative facts about geopolitical situations, with a time lag which depends on the indexation mechanism included in the gas pricing formula.
x Carbon allowances prices: The European Emissions Trading Scheme (ETS) limits CO2 emissions for some industrial sectors; since 2005 each country allocates its allowances to companies which are free to trade them within the EU. Carbon allowances (EUAs) and carbon credits (CER´s) are traded as a commodity. Power stations with carbon emissions must buy EUAs or CERs to cover a possible shortage of such allowances.
If the price of EUAs or CERs is high, generating electricity from fuels such as coal and gas becomes more expensive, and the cost could rise. The price could increase by the amount of the EUAs and CERs, because these are input factors.
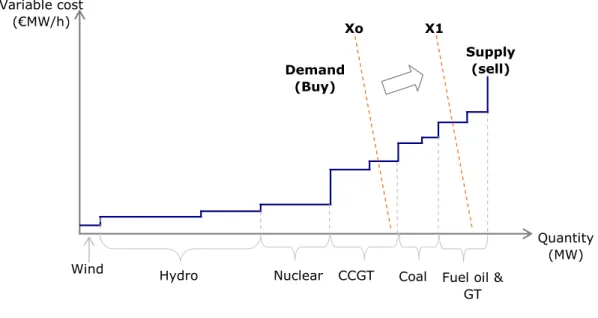
Demand side also affects the electricity price on the spot market by moving the demand curve (from Xo to X1), as shown in the figure below: if the demand curve moves this will require that more expensive technologies operate to cover the demand.
Hydro Nuclear CCGT Coal Fuel oil & GT Wind Quantity (MW) Variable cost (€MW/h) Supply (sell) Demand (Buy) Xo X1
Source: own elaboration
Figure 7. Supply curve construction
Some of the factors that affect the demand curve displacement are the following:
x Weather and temperature conditions
Precipitation: The level of precipitation is significant for pricing on the Power Exchange. Plentiful rain and snow means more water to drive the turbines, which in turn boosts supply. An increase in precipitation alone will normally reduce electricity prices.
x Temperature conditions
Temperatures influence daily demand for power. Colder weather boosts demand, which can lead in turn to price increases.
x Electricity transmission
Transmission capacity: Capacity shortages in the transmission network could increase prices if demand in one area exceeds supply. Lack of capacity means that power cannot be acquired from regions with a surplus.
x Seasonability
Demand differs between seasons (winter/summer), days (weekdays/weekends), and hours (peak/off peak). This seasonal and day variation implies that some generators only run a couple of hours per year
x Level of economic activity
General economic fluctuations such as booms and recessions also impact in the electricity consumption and, thereby, trading in power because power market is influenced by fluctuations in other raw materials and currency markets.
x Economic factors
Generating capacity: Expanding generating capacity will increase the supply of electricity, which could reduce prices.
x Currency movements
Most raw materials are priced in US dollars. A lower exchange rate for the dollar cuts the cost of coal, gas and other fuels to lower the price of electricity.
3.7 Risk Management in Spot Markets
As we saw there are a number of factors which cause unexpected price and cost changes in competitive power markets. These factors can be classified in Short Term (seconds, up to the day) and Long Term.
The business separation between Generation and Supply activities enforce the need to deal with some uncertainties that were no concern before when companies belong to the same power group.
Important financial penalties can be incurred in liberalized markets by producers and consumers of energy if they diverge from agreed levels of production or consumption.
The exact mechanism used to balance a network, which inevitably varies from market to market, may have an impact on the risk trading strategy. The need to predict consumer demand accurately and to meet contracted production targets in each trading interval becomes vital to the profitability of the organisation.
Alternatively, the risk can sometimes be managed through the introduction of special contract types or conditions, such as interruptible contracts.
The main causes of the price volatility are:
Short term
xOperational risk (power generation failures)
xForecasting risk (over costs associated to the Balancing Energy)
Day Ahead Market
x Generation mix (changes in the marginal price as a result of the different technologies that participate on the Spot Market)
x Market demand peaks and valleys
x Congestion management
Long term
x Costs and availability of fuel
x Environmental conditions (especially rain and weather) and environmental constraints
x Regulatory risk
x Forecasted demand
x Investment programs
In addition to the problem of price and volume risk, utilities must actively manage other risks such as credit, legal and liquidity risk, among others.
Some risks are measurable, and generally accepted techniques and models exist, while others are more an issue for the organisation to address accordingly to its own structure and processes. Whatever the case may be, an organisation which is trading in the electricity market must be aware of the risks they are facing and have strategies and processes to manage it.
Additionally some utilities tend to speculate with future energy prices. This adds a considerable extra risk.
Physical markets (in particular, the Spot Markets) are essential to control and minimize the short term price and the needs to provide the network balance, stability and reliability.
In addition the Spot Market has as key role to provide price reference which is necessary to build Financial and OTC Markets. Energy futures prices and derivatives products for the power markets are based and are derived from in the Spot Market prices.
3.8 Power Exchanges Comparative
On the next chapters it is presented four European Power Exchanges, the reason to select this markets is because one of them represents a different level of liquidity, competition, volume traded, etc, for instance, the Nord Pool is the pioneering, most successful and mature market across Europe, Omel was at the beginning a mandatory market and thus liquidity on this market was so high, Powernext is practically a residual market in France and Opcom is an incipient but straight forward market with opportunities to achieve an important role not only in the Romanian wholesale market but in the South East Europe region.
First a brief description of the electricity sector of each country is presented then some spot market procedure insights and finally spot market price analysis.
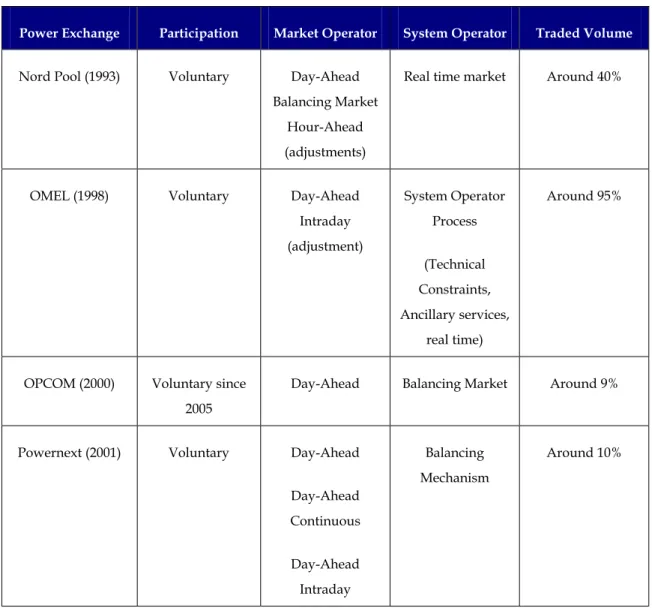
Power Exchange Participation Market Operator System Operator Traded Volume
Nord Pool (1993) Voluntary Day-Ahead Balancing Market
Hour-Ahead (adjustments)
Real time market Around 40%
OMEL (1998) Voluntary Day-Ahead Intraday (adjustment) System Operator Process (Technical Constraints, Ancillary services, real time) Around 95%
OPCOM (2000) Voluntary since 2005
Day-Ahead Balancing Market Around 9%
Powernext (2001) Voluntary Day-Ahead Day-Ahead Continuous Day-Ahead Intraday Balancing Mechanism Around 10%
3.9 References
xBajpai, P and Singh. S.N. Electricity Trading In Competitive Power Market: An Overview and Key Issues. International Conference on Power Systems. Kathmandu, Nepal 110 pp.
x Bogas, J; Fernandez, C; Ventosa, M. (2) Overview on Electricity Markets: International Experiences.
x Boisseleau, F. (2004). “The Role of Power Exchanges for the Creation of a Single European Electricity Market: Market Design and Market Regulation.” PhD Thesis, University of Paris IX Dauphine, Delft University Press.
x Cavallo, L. And Termini, V. (2007). Spot, Bilateral and Futures Trading in Electricity Markets. Implications for Stability. 34 pp.
x Flatabø, N.; Doorman, G.; Grande, O. ; Randen, H. ; and Wangensteen, I. (2003) Experience with the Nord Pool Design and Implementation, Member, IEEE. 7 pp.
x Helyette, G. (2002) Towards a European Market of Electricity: Spot and Derivatives Trading.
x Hogan, W. W. (1998). “Competitive Electricity Market Design: A Wholesale Primer.” December, John F. Kennedy School of Government, Harvard University.57pp.
x IEA (2001). Competition in Electricity Markets (2001). Head of Publications Service, OECD 2, rue André-Pascal, 75775 Paris cedex 16, France.
x Joskow, P. (2007). Lessons learned from electricity market liberalisation. University of MIT. 38 pp.
x Makkonen, S. and Lahdelma, R. (1999). Analysis of Power Pools in the Deregulated Energy Market through Simulation.
x Quarterly Review of European Electricity and Gas Prices. DG Energy and Transport. Issue 1-8.
x Reinhard, M., R. And Kaufmann, M. (2002). Power exchange spot market trading in Europe: theoretical considerations and empirical evidence.
x Stoft. S.( 2003) Power System Economics. IEEE Press. Piscataway, NJ, USA.
x Wolak, F. A. (2001). “Market Design and Price Behaviour in Restructured Electricity Markets: An International Comparison”, Department of Economics, Stanford University.
4
The Scandinavian Spot Market
(Nord Pool)
4.
The Scandinavian Spot Market (Nord Pool)
4.1 Scandinavian Electricity Sector Summary
Norway
Norway was the first of the Nordic countries to liberalize its electricity sector, in 1991 the 1990 Energy Act came into force. The main motivation for the electricity market reform was an increasing dissatisfaction with the performance of the sector in terms of economic efficiency in resource utilization.
The most important elements of the reform were the desire to organize a Spot Market that incorporates the demand side 4.
Before the liberalization process, the dominant state-owned and vertically integrated company Statkraft was split into two separate entities:
• Statkraft SF (Generating company)
x Statnett SF (Transmission company)
The other vertically integrated power companies were separated into generating or trading divisions. The market liberalization was implemented without changes in ownership, neither of the companies were privatized, 85% of the electricity system was publicly owned by local, regional and state-owned companies. The prices were determined by the government and set different prices for different consumers, which created inefficiencies in the electricity market.
The Norwegian electricity system is quite unique, because around 99% of the production is generated by hydropower. Production varies heavily from season to season depending on the rainfall.
4 From 1971 to 1990 an Occasional or Interruptible Spot Power Market exists, based on expected
The low cost of electric power in Norway and a growing economy led a steadily increase in electric consumption throughout the 1990s. Production, however, has not kept pace, as a result Norway is now a net importer of electricity.
Population 4,6 million Area 325.000 km2. Electricity annual Consumption 115 TWh Individual Consumption 25.000 KWh
Industry Paper and Chemical Aluminium
smelting or Iron Alloy Natural Resources Fifth producer of hydro
worldwide and first in Europe. 1996 – 67 TWh
2000 – 147 TWh Hydropower 99% Other termal power 1% Electricity production Grouth
NORWAY
Electricity production
Table 3. Norway Specifications
Sweden
Sweden deregulated its electricity sector in 1996 according to the Electricity Act 1197:857, the main driver for restructuring was the increasing concern of market power, the aim to reduce electricity prices and increase productivity.
Before deregulation the electricity sector was vertically integrated, consumers bought their power from the local electricity company, which either generated its own power or acquired it from another member of the industry’s clubs 5. After the liberalization this vertical integration was split up into three segments: generation, transmission, and retail trade directed to individual customers including households.
5 The clubs were voluntary associations of companies that were in one way or another engaged in the
Both generation and retail trade were open into competition, while transmission remained regulated.
The reason why transmission remained sheltered from competition was that it is three geographical levels (National, Regional and Local) that together formed a natural monopoly.
One of the most remarkable parts of the Swedish reform was that Svenska, Sweden Transmission System Operator, bought half of the Norwegian electricity Spot Market form the Norwegian, known as the Nord Pool.
Sweden has gained from the creation of Nord Pool, however, for the market in which Swedish generators compete is now usually twice as large as Sweden alone, and can be nearly three times large.
At present, Sweden is a single price area within Nord Pool, even if there is congestion within the country’s transmission system
Population 9 million
Area 450.000 km2
Electricity annual Consumption
145 TWh,
Individual Consumption Fourth individual consumption worldwide
Industry 30% consumption belong to
Paper Industry
Production mix Hydro and nuclear, small portion cogen and fuel
Hydropower 46% Nuclear Power 45% Other termal Power 12%
SWEDEN
Electricity Production
Table 4. Sweden Specifications
Finland
The Electricity Market Act (EMA) and the Point-access tariff of 1995 opened the Finnish electricity market to competition. A later modification of the law has, since autumn 1998, allowed all customers to choose a supplier freely with no additional cost.
Due to the use of consumption profiles, no specific electricity meters are needed for small customers.
There are many reasons for restructuring the electricity industry in Finland. One is the worldwide trend towards liberalisation and the evidence of improved efficiency. The second was the deregulation of the electricity markets in other Nordic countries and the establishment of the common power pool, Nord Pool. And third, there has been a scheme for opening the European electricity markets, to which Finland wanted to be properly prepared. Population 5,2 millions Area 338.000 km2 Electricity annual Consumption 85 TW
Individual Consumption Similar to Sweden
Industry 30% consumption belong to
Paper Industry Electricity Production Nuclear Power 33%
Other termal power 47%
FINLAND
Table 5. Finland Specifications
Denmark
Denmark started to liberalize its electricity market in 1996 by introducing limited competition concerning to large customers (consumption over 100 GWh). In 1999 a New Electricity Supply Act was passed in the Parliament and at the same time the western part of the country became a separate price area within the competitive Nord Pool Power Exchange.
Contrary to the other Nordic countries, the government does not own any electricity utilities, most of it are owned either by municipalities and customer co-operatives. Peak-load demand is usually satisfied by imported hydropower from Norway and Sweden. Denmark is interconnected by transmission lines to two different systems, from West to the Great Belt to the Continental Western Europe and from the East of the Great Belt to the other Nordic countries.
Population 5,4 million
Area 43.000 km2
Electricity annual Consumption
35 TWh
Individual Consumption Tipical from an European country
Production mix 85% Cogen the rest wind power
DENMARK
Table 6. Denmark Specifications
4.2 The Nord Pool Spot Market
Initially in 1993 this Power Exchange covered only the Norwegian market operating the first year a volume of 10.2 TWh. The Power Exchange changed its name to Nord Pool ASA when it became a common Norwegian-Swedish market in 1996. Svenska (Swedish TSO) brought the 50 % to Statnett (Norwegian TSO) which owns the other 50%. In 1998 the Market was extended to Finland and finally in 1999 the western part of Denmark joined the Pool.
Nowadays the Nord Pool Group owns Nord Pool ASA which has the 20% of participation in the Nord Pool Spot, the rest 80% is owned by the four Nordic TSOs - Statnett SF, Svenska Kraftnätt, Fingrid and Energinet.dk with 20% each.
At the end of 2005 Nord Pool Spot opened a price quotation in Germany. The Nordic Exchange area was expanded to include also a bidding area in Germany named KONTEK. Geographically, KONTEK gives access to the Vattenfall Europe Transmission control area.
Statnett SF 20,0% Svenska 20,0% Fingrid 20,0% E nerginet 20%
Nord Pool ASA 20,0%
Figure 8. Nord Pool Spot Shareholders
Nord Pool is a non mandatory Power Exchange that organises approximately 40%6 of the total trade of electricity in the Nordic market. The rest is organized on the basis of bilateral contracts.
Any company wishing to trade in Nord Pool must first become a member. Membership is open to Generators, Distributors, Suppliers, Industrial Customers, Traders and Brokers. At present there are 131 Direct Participants, 172 Clearing Customers and 14 Trading and Clearing Representatives.
National competition and regulatory authorities monitor the Nordic power market to ensure that it is sufficiently competitive. The competition authorities check that no form of price cooperation occurs and that no players secure excessive market power. The financial and energy regulators monitor compliance with licence terms, while Nord Pool provides direct surveillance of the marketplaces.
The physical Nord Pool is divided into two areas: • Elspot (Day-Ahead Market)
• Elbas (Hour-ahead), this market do not operates in Norway because Norway is mainly water based. That means that the base load profile is
very flat. The marginal cost for water is not very high and that is the reason why Statnett until now has rejected the elbas.
Other services to maintain a secure and reliable power supply are handled through the Real-time Market and Ancillary services managed by each of the Nordic Transmission System Operators.
Conditions for trading
There are three participant categories on the Nord Pool Spot market:
• Direct participant: Participants that trades on their own behalf and is the responsible for the settlement.
x Trading & Clearing Representative: Participant who carries out Trading for a Clearing Customer account and risk.
• Clearing Customer: Make an agreement with a Trading & Clearing Representative to perform the trading on his behalf. Is the responsible entity for the settlement of their own trading done by the Trading & Clearing Representative.
Every Participant has to post a cash collateral on a pledged bank account or a demand guarantee issued by the bank to Nord Pool.
The member that wants to become a Nord Pool participant has to fulfil the following requirements:
1. The Participant must sign the Participant Agreement and the Clearing Customer the Customer Agreement.
2. Before the trading commencement, it is necessary that the Participant and the Clearing Customer established a deposit account or a non-pledged account and posted cash collateral on either accounts or present a guarantee document issued by a bank.
3. Sign a Balance Responsibility Agreement with the Transmission System Operator.
4. Comply with the following fees and payments
Direct participants € 12.500
Trading & Clearing Representative € 12.500
Clearing Customers € 2.000
Elspot 0,03 €/MWh
Elspot (small participants)* 0,13 €/MWh
Elbas 0,08 €/MWh
Elbas Service Fee 500 €/Month
* Small participants can waive the annual fee and pay a higher variable.
Annual Fixed Fees
Variable Fee
Table 7. Nord Pool Trading Fees
4.3 Regulator
The regulatory and supervision authority for the Nord Pool Spot is the Norwegian Water Resources and Energy Directorate (NVE) which is subordinated to the Ministry of Petroleum and Energy. Nord Pool Spot hold a licence to operate and organized marketplace for trade physically delivered power contracts, under the Energy Act 2003 of Norway. NVE also allowed Nord Pool Spot to organise the physical exchange of power with neighbouring countries.
The license requires that a market surveillance function is establish, The Rulebook for Nord Pool Spot regulates the obligations and rights of the market participants in trading and settlement, and constitutes the rules that the Spot Market participants have to comply. There are separate regulatory agencies in the four countries.
x Swedish Energy Agency (EI)
x Energy Market Authority (EMV)
4.4 Elspot: Day ahead
Elspot is a Day-ahead market on which electricity is traded on a daily basis for physical delivery for the following day.
The bidding areas are consistent with the geographical area of each of the Transmission System Operators: Sweden, Finland and the German area KONTEK are each one bidding area. The grids in Jutland (Western Denmark) and Zealand (Eastern Denmark) are not physically connected giving two bidding areas in Denmark. The Norwegian grid is usually divided into two bidding areas.
Elspot Key Features
• Hourly, Block and Flexible bidding contract (24 hours of the next day)
• Price mechanism to allocate transmission capacity • Price grid congestion is included in the System Price • Prices are determined for every hour
• Electronically trading system (EDIEL or EIWeb) • Minimum contract duration is one (1) hour
x Minimum contract block is four (4) hours duration • Minimum contract size is 0,1 MWh/h
• Trading currencies: NOK, SEK, DKK, EUR/MWh • Bid: Sequence price/volume
• Purchases positive numbers, Sales negative numbers • Ceiling and Floor price limit
There are different kinds of purchase and sales Bids:
1. Hourly Bid: Participants submit their bids (sale or purchase) covering all the 24 delivery hours. It could be price-dependent hourly bid or price-independent hourly bid.
• Price dependent bids: Nord Pool Spot make a linear interpolation of volumes between each adjacent pair of submitted price steps. Once the Elspot price for each hour is determined, a comparison with a participant's bid form for the day establishes the traded volume for that participant. Price¬ Hour 1 2 3 50 MWh 50 MWh 0 0 -10 MWh -10MWh -30 MWh -30 MWh 4 Etc. Price Levels 22.1 30 30.1 2000 0 15 15.1 22
Table 8. Price dependent schedule
• Price Independent bids: The participant will receive a schedule of deliveries equal to the specified volume for all hours, regardless of the price level within the range.
Floor Price Ceiling Pirnce
0 2000
00-24 60 MWh 60 MWh Price
Hour
Table 9. Price Independent Schedule
2. Block Bid: Is an aggregated bid for several consecutive hours with a fixed price and volume. The Participant can choose the start and stop hour at a block but must consider at least four consecutive hours. The Block Bid gives the opportunity to set a Fill-or-Kill option for all the hours of the block. The maximum blocks bids per day are 15. This kind of bid is useful in cases where the cost of starting and stopping is high.
3. Linked Block Bids: This kind of bid allows to link up to three blocks together, the third bid is then dependent on acceptance of both preceding bids. This is useful when the cost of starting one generator depends if another generator is already in order or not. The blocks cannot link for sale and purchase.
4. Flexible hourly Bid (Only for sales): It is a bid with a fixed price and volume without any specification about the hour. The bid will be accepted in the hour with the highest price in the calculation.
Elspot Timetable
1. At 10:00 the TSOs have had submitted their capacity allocation for Elspot contracts.
2. 12:00 is the deadline hour for receiving all the bids covering hourly contract for delivery the next day. The market closes; Elspot price calculations begin.
3. At 13:00 or 13:30 at the latest the price calculations are completed. The results are confirmed to the participants, to the TSOs and others responsible for power balance adjustments. Participants can file complaints about trades in the next 30 from the publication of the schedules.
4. 14:00 is the deadline for filing complaints, unless a delay of price-setting beyond 13:30 has occurred. All Elspot contracts are binding between buyers, sellers, and Nord Pool Spot.
The Nord Pool calculates the System Price using all the bids submitted by the participant in the four countries + KONTEK area. At first the grid capacities are not included in the calculation, this means that the System Price will correspond to the Price area of each Nordic country.
If congestion is detected during the initial calculation, the markets are split into different price areas and repeat the price calculation in the two areas separately. The
price in one area will therefore be higher than in the other. Electricity will be then purchased in the low price area and sold in the high price area. The increased demand in the low price area will in turn raise the price in that area. Correspondingly, the price in the high price area will fall when the amount of available power increases. This process, known as Market Splitting, will continue until all the transmission capacity is fully utilized.
Elspot Price Analysis
The bar and line chart on figure 9 shows the evolution of the volume traded and the prices at Nord Pool Spot market in Norwegian Krone for the period 1993-1998. In 1996 a significant increase of traded volume is evident since Sweden merged with the Norwegian Spot market, as same in 1998 when Finland joined as well.
0 10 20 30 40 50 60 1993 1994 1995 1996 1997 1998 0,0 50,0 100,0 150,0 200,0 250,0 300,0 E nergy Price NOK/MW TWh
Figure 9. Nord Pool Day-Ahead Spot Market Price/Volume History 1993- 1998 (prices Norwegian Krone)
• The heavily influence of hydraulic in Norway is the reason for the spike prices in 1994 and 1996. Those years where influenced by environmental causes (strong winters and low raining season).
On figure and table 10 is presented the evolution of the volume traded since the beginning of the Nord Pool Spot and Spot prices since 1999, in EUROS. In 1999 and 2000 western Denmark and eastern Denmark respectively join the market. The most recent incorporation to the market was in 2005 when the German area KONTEK
adheres to the Nord Pool Spot Market. The table above shows the evolution in figures and the variation over the years.
0 50 100 150 200 250 300 1993 1994 1995 1996 1997 1998 1999 2000 2001 2002 2003 2004 2005 2006 0 10 20 30 40 50 60 E nergy Price TWh EUR/MWh
Figure 10. Nord Pool Day-Ahead Spot Market Price/Volume History (prices in EUROS)
Table 10. Nord Pool Day-Ahead Prices and volume
Year Price NOK/MWh Volume TW/h 1993 80,3 10,02 1994 182,7 14,8 1995 117,67 20 1996 253,63 40,6 1997 135 43,6 1998 116,35 56,3 Price € /MWh 1999 13,46 75,4 2000 12,8 96,9 2001 23,1 111,9 2002 26,91 124,4 2003 36,7 119 2004 28,92 167 2005 29,33 176 2006 48,59 251
• 2003 was a very dry year, the demand did not grew as much as other years, because of that the prices had an important rise from 26, 91 to 36,7 €MW/h.
• The turnover for Monday 22 January 2007 was 1003.5 GWh. The volume traded at Nord Pool Spot now represents more than 70% of the Nordic consumption.
4.5 Elbas: Hour-ahead
Elbas is an Electricity Adjustment Market that started in 1999. The Elbas Market is open at all times (continuous trading 24 hours a day). The traded products are one-hour duration power contracts. The purpose of this market is to improve the physical balance.
In the past, especially in Sweden and Finland, electricity distributors estimated their balance long time ahead. Forecasting the future is a very important and difficult task in these countries because most of its generation production is based on CHP (Combined Heat and Power), however, the consumption and production predictions do not always correspond to the situation in real time, but a prediction can get achieved as the actual delivery time approaches, therefore continuous trading near the delivery hour is extremely effective.
The participants in the Elbas Market are power producers, distributors, suppliers, industries and brokers. Today the Elbas market runs in Finland, Sweden and Eastern Denmark.
Elbas Key Features
• Contracts: one-hour physical power • Minimum contract size is 1 MWh/h • Prices in EUR/MWh
• Minimum bid price is 0,1 EUR • Web based real-time trading system • Block bids are accepted
Elbas Timetable
1. At 14:00 when the deadline for filing complaints on the Elspot market is closed, the hour-contracts for the next day are opened for trade in Elbas market. The trade for a specific hour contract is closed one hour before its delivery.
2. In eastern Denmark the hour-contracts for the next day are opened at 17:00. The trade for a specific hour contract is in eastern Denmark closed two hours before its delivery.
4.6 Real Time Market (System Operator Market)
This market is managed by each of the TSOs involved, the objectives are to serve as a tool for the TSOs to balance the power at any time and to provide the imbalance price for the Participants. Balance is maintained separately in each participating country.
1. Participants submit their bids to the TSOs after the Elspot Market has closed.
2. TSOs sort the bids for each hour in priority order, according to price. 3. For upward regulation the TSOs picks from the list the unit with the
lowest price.
4. For downward regulation the TSOs picks from the list the unit with the highest price.
In Norway there is only one real-time price for each hour. The last unit called in each hour defines the price for that hour.
In the rest of the Nordic countries two prices for each hour are defined, one for downward and one for upward regulation.
In hours when there is no real-time regulation, the real-time price corresponds to the area Elspot price.