The Niagara Region’s Tourism Opportunities
The U.S. and Ontario Markets
Part I: Product Development Opportunities
August 2007
Part II: Marketing Implications
TABLE OF CONTENTS
Executive Summary ... 4
Part I: Product Development Opportunities... 7
Introduction ... 7
The Recent Past ... 9
What are the latest statistics for tourism in the Niagara Region?... 9
Why do overnight visitors travel to the Niagara Region? ... 10
THE US MARKET ... 13
Core Activity Segments and Opportunities for Growth... 13
Definition of the Niagara Region’s Core Activity Segments ... 13
How large are these US segments?... 13
Are these activities trip motivators for American travellers?... 14
Potential Opportunity Segments for Niagara... 14
What other key activities do these segments engage in? ... 17
Other complementary products ... 18
How well does the Niagara Region meet the Americans’ demand? ... 20
Product Development ... 22
The bricks and mortar of the tourism product... 22
Infrastructure and the softer stuff ... 23
Projections for 2015 and 2025: US Market ... 24
The Ontario Market ... 26
Core Activity Segments and Opportunities for Growth... 26
How large are these Ontario segments?... 26
Are these activities trip motivators for Ontario travellers? ... 27
Potential Opportunity Segments for Niagara... 28
What other key activities do these segments engage in? ... 30
Other complementary products ... 31
How well does the Niagara Region meet the Ontario travellers’ demand? ... 33
Product Development ... 34
Part II: Marketing Implications, US Market ... 37
Introduction ... 37
Demographic Information... 38
Additional Demographic and Travel Behaviour Information ... 45
Residence Information ... 45
Benefits Sought and Other Destination Considerations ... 46
Media Habits... 47
Profiles of Niagara Region’s Core US Segments... 38
Wine Segment: The Inquisitive Explorers ... 38
Natural Wonder Segment: Culture seeking classy adventurers... 40
Casino Segment: Looking for convenience... 42
Segment Clusters ... 48
Wine Segment Clusters... 49
Natural Wonder Segment Clusters... 54
Executive Summary
Ontario residents and Americans constitute Niagara Region’s largest source markets for overnight travellers (88% in 2004). Although the Ontario market has exhibited positive growth over the past seven years, the US market appears to be in decline.
Part I of this report focuses on these two source markets and identifies opportunities for
product development around the Region’s main product strengths: the falls, the vineyards and the casinos.
Size of Market
51% of all American travellers and 53% of all Ontario travellers participated in one or more of the Region’s core strengths while on an overnight trip anywhere in the world in the 2004-2005 period. Among American travellers, going to casinos was the leading attraction for visitors (35% of all US travellers), followed by viewing natural wonders (21%) and participating in wine-centred activities (17%). Among Ontario travellers, going to casinos was the leading attraction (32% of all Ontario travellers), followed by viewing natural wonders (25%) and participating in wine-centred activities (19%). Although the Region’s core strengths are popular amongst travellers, they are not generally trip motivators for the vast majority of travellers; only 20% of Americans and 15% of Ontarians who participated in these activities took trips that were motivated by these activities – a fact that has implications regarding the variety of things that a destination should offer to its visitors.
Opportunity Group
Not all of the Americans and Ontarians who participated in the activities identified as product strengths for the Niagara Region could be considered as potential visitors to the Region. The opportunity group includes only those who: a) are motivated to travel by at least one of these
activities (wine, natural wonders, casino1), b) find Ontario to be an appealing travel destination
and believe there are many good reasons to travel to the province, and c) have indicated that the choice of destination is very or extremely important to them (and that they are the ones choosing the destination and not someone else). The resulting opportunity set for Niagara Region includes 3.2 million Americans and 525,000 Ontarians.
Within the American market opportunity set, the natural wonder segment had the largest number of travellers (1.9 million), followed by the wine segment (1.0 million) and the casino segment (871,000). 44% of the American market opportunity set had travelled to Ontario in the 2004-2005 period.
Within the Ontario market opportunity set, the natural wonder segment had the largest number of travellers (270,000), followed by the casino segment (232,000) and the wine segment
(130,000). 92% of the Ontario market opportunity set had travelled within Ontario in the 2004-2005 period.
Product Development
US Market
Supplementary products that could enhance the Niagara Region’s primary products (wine, natural wonder and casinos) centre around food, shopping, strolling around to see buildings and architecture (with implications regarding downtown revitalization) and attractions such as historic sites and amusement parks.
Ontario Market
Supplementary products that could enhance the Niagara Region’s primary products centre around food, shopping, strolling around to see buildings and architecture, attractions such as historic sites and nature parks.
In addition to these products, there are some other issues that, according to various studies, the Niagara Region would need to address:
• Regional image and product awareness2
• Transportation from Niagara to other Ontario and from Niagara to the US
• Satisfaction of travellers’ needs by existing product3
Future Growth
Overall, Niagara’s opportunity group from the US market is expected to experience
moderate growth in 2015 and 2025 (3% and 9%, respectively). Although the natural wonder segment will continue to have the largest proportion within the opportunity group in 2015 and 2025, it is the wine segment that is expected to show the most growth over that period (10% and 20%, respectively). Participation in all shopping-related activities is expected to grow at moderate rates, with the exception of fruit picking at farms (which will be down slightly). Participation in food-related activities is also expected to show healthy growth rates. Growth in attraction-related products will show slow to moderate growth rates, while interest in golfing and pop/rock concerts is expected to decline. Attendance at ethnic festivals and shopping at greenhouse/ garden centres were identified as emerging travel activities in 2015 and 2025.
Looking at Niagara’s opportunity set within the Ontario market for 2015 and 2025, growth rates are expected to be substantially higher than those for the opportunity set within the US market (10% and 20%, respectively). Similar to the US findings, the wine segment is
expected to show the most growth looking ahead to 2015 and 2025 (increases of 11% and 28%, respectively). Participation in shopping-related activities is expected to grow at
healthy rates, as is participation in arts-related attractions such as live theatre with or without dinner and stand-up comedy. Golfing and dining at farms are expected to show healthy growth in 2015 and 2025. Products for which there is expected to be declining interest among Ontario travellers include: attending food and drink festivals, participating in harvesting operations, visiting amusement parks, viewing fireworks displays and mini-golfing. Attending ballets was identified as an emerging product for 2015, but drops out of the priority list in 2025.
2
Travel Intentions Study, TNS Canadian Facts 3
Marketing Profiles
The second part of the report features information on demographics, travel behaviour and media preferences for each of the Region’s three core segments in order to inform targeting choices and marketing decisions. Each segment is then further distilled into activity clusters, allowing marketers and others to pinpoint their specific markets and to targets them
Part I: Product Development Opportunities
Introduction
This report will focus on travellers who engaged in the attractions intrinsic to the Niagara Region, specifically activities related to wine, viewing natural wonders and going to casinos. This report will provide an overview of these activity segments and will explore opportunities for tourism sector growth, specifically looking at product development for the Niagara
Region.
This report will examine the recent past, travel intentions and core activity segments and opportunities for growth using a variety of different information sources:
• The Recent Past, based on Statistics Canada’s International Travel Survey (ITS) 2005
and Canadian Travel Survey (CTS) 2004;
• Travel Intentions, based on the Ministry’s survey conducted by TNS Canadian Facts since November 2003; and
• Core Activity Segments and Opportunities for Growth, which is further subdivided by the US and Ontario markets, and is based on the 2006 Travel Activities and
Motivations Survey (TAMS) conducted by Statistics Canada and TNS Canadian Facts on behalf of the Ministry and the TAMS partnership.
International Travel Survey (ITS), 2005 and Canadian Travel Survey (CTS), 2004 The ITS and CTS report statistics on the characteristics and trends of the domestic and international travel markets to Ontario such as:
• The performance of Ontario’s tourism industry;
• Where the visitors come from;
• How much they spend in the province;
• What places they visit; and
• What activities they engage in while they are here.
The ITS is conducted by Statistics Canada with the help of Canada Customs and Immigration authorities who distribute questionnaires to a sample of travellers at border crossings. Travellers self-complete the questionnaires and mail them back to Statistics Canada. Questionnaires completed by same-day visitors from the United States who enter Canada by car do not contain any questions regarding the activities that these visitors engage in during their trip. For that reason, this report will report only on the activities of overnight visitors from the United States. Most of the remaining trip characteristics were obtained from 23,833 completed questionnaires by US visitors (out of 41,032 usable questionnaires of US visitors to Canada) and 5,447 completed questionnaires by overseas visitors (out of 10,740 usable questionnaires of overseas visitors to Canada).
The CTS is also conducted by Statistics Canada annually, and is a supplement to the Labour Force Survey. Co-sponsored by the provincial and federal governments, the CTS telephone interview captures the incidence and detail of travel by Canadians. A total of 201,560 Canadian households — including 57,570 Ontario households were surveyed during 2004. The response rates for Canadian and Ontario respondents were 83.1% and
The Ministry’s Travel Intentions Study (TIS)
The TIS is a household survey of Americans, Ontarians and residents of Quebec City, Montreal and Winnipeg which is intended to measure intent to travel to Ontario and specific Ontario destinations within key US and domestic markets. The focus was on travel intentions for the March/May 2007 and June/August 2007 seasons and interviewing was conducted by telephone among individuals 18 years or older. In total, 5,840 interviews were completed - 1,909 in Canada and 3,931 in the United States.
The 2006 Travel Activities and Motivations Survey (TAMS)
TAMS examined the recreational activities and travel habits of Canadians and Americans over a two-year period (2004 and 2005). The survey provides detailed information on travellers’ activities, travel motivators, places visited, type of accommodation used,
impressions of Canada, demographics and media consumption patterns. The survey was conducted in Canada and the United States between January and June 2006 and it surveyed adults 18 years and over. The reference period for the data is 2004 and 2005. The U.S. survey consisted only of a mail back survey as it used an existing panel:
• The panel’s response rate for this survey was 71.3%
• The U.S. database consists of 60,649 completed responses
The Canadian survey consisted of a telephone and a mail back survey:
• The household response rate of the telephone survey was 65.4%
• The paper questionnaire response rate was 53.5%
• The Canadian database consists of 53,150 completed records from the telephone
The Recent Past
What are the latest statistics for tourism in the Niagara Region?
Figure 1: Same-day visitors to the Niagara Regional Municipality by Market
0 1,000,000 2,000,000 3,000,000 4,000,000 5,000,000 6,000,000 7,000,000 8,000,000 1998 1999 2000 2001 2002 2003 2004 2005 2006 Ontario Other Canada US Overseas
Same-day visitation to the Niagara Region declined 16% from 10.4 million in 1998 to 8.8 million in 2004. The US market share declined from 73% in 1998 to 60% in 2004, and as the data indicate, further declines in this share are expected in 2005 and 2006. If the Ontario market share remained at its 2004 level, then the Ontario market would be almost of equal significance as the US market in 2006.
The decline in same-day visitors to the Niagara Region is primarily due to the decline in US visitors, but the fact that all other three market segments (Ontario, overseas, other Canada) have remained stagnant over the period has not helped visitation to the Region.
Figure 2: Overnight visitors to the Niagara Regional Municipality by Market 0 500,000 1,000,000 1,500,000 2,000,000 2,500,000 1998 1999 2000 2001 2002 2003 2004 2005 2006 Ontario Other Canada US
In the overnight market, the picture is quite different. Visits from other regions of Canada are showing some positive growth; while the US is exhibiting a negative trend, while still moving within its historical band of 1.5 to 2.0 million visitors. The overseas market is also showing a negative trend while the Ontario market is exhibiting substantial growth. Starting in 2003, the Ontario market is of a greater importance to the Region than the US market.
Why do overnight visitors travel to the Niagara Region?
The majority of visitors from every market travel to the Niagara Region for pleasure. However, Ontarians also travel there in order to visit friends and relatives.
Figure 3: Main Trip Purpose – Overnight Visitors, 2004
0 200,000 400,000 600,000 800,000 1,000,000 1,200,000 1,400,000 1,600,000
Ontario Other US Overseas
Pleasure VFR Business Other
The following four figures show the activities of overnight visitors to Niagara Region.
Sightseeing and shopping are the top activities for all market segments. For visitors from the US, overseas and from other regions in Canada, these two activities are followed by visits to historic sites and to provincial/national parks. However, for Ontarians, shopping and
sightseeing are followed closely by visiting friends and relatives and going to the casinos. Figure 4: Activities of Ontario’s Overnight Visitors to the Niagara Region - 2004
0 300,000 600,000 900,000 1,200,000 Visit Friends/Relatives Festivals/Fairs Cultural Performances Museums/Art Galleries Zoos/Aquariums/Bot. Gardens Sports Events Shopping Sightseeing Bars/Nightclubs Casinos Theme Parks National/Provincial Parks Historic Sites Boating Golfing Fishing Hunting Ontario
Figure 5: Activities of US Overnight Visitors to the Niagara Region - 2004
0 300,000 600,000 900,000 1,200,000
Visit Friends/Relatives Festivals/Fairs Cultural Perform ances Museum s/Art Galleries Zoos/Aquarium s/Bot. Gardens Sports Events Shopping Sightseeing Bars/Nightclubs Casinos Them e Parks National/Provincial Parks Historic Sites Boating Golfing Fishing Hunting US
Figure 6: Activities of Other Canada Overnight Visitors to the Niagara Region - 2004 0 40,000 80,000 120,000 160,000 Visit Friends/Relatives Festivals/Fairs Cultural Performances Museums/Art Galleries Zoos/Aquariums/Bot. Gardens Sports Events Shopping Sightseeing Bars/Nightclubs Casinos Theme Parks National/Provincial Parks Historic Sites Boating Golfing Fishing Hunting Other Canada
Figure 7: Activities of Overseas Overnight Visitors to the Niagara Region - 2004
Cultural Performances Museums/Art Galleries Zoos/Aquariums/Bot. Gardens Sports Events Shopping Sightseeing Bars/Nightclubs Casinos Theme Parks National/Provincial Parks Historic Sites Boating Golfing Fishing Hunting Overseas
THE US MARKET
Core Activity Segments and Opportunities for Growth
Definition of the Niagara Region’s Core Activity Segments
Travellers who, during their trips anywhere in the world, participated in activities that are intrinsic to the Niagara Region were grouped to form three segments: the “wine segment”, the “natural wonder segment” and the “casino segment”.
• Travellers who went to wineries for day visits and tasting or stayed at a wine tasting
school or went on a same-day winery tour or took cooking/wine tasting courses will
henceforth be referred to as the wine segment;
• Travellers who visited a natural wonder will henceforth be referred to as the natural
wonder segment; and
• Travellers who went to a casino or went on a same-day casino tour will be referred to as
the casino segment.
How large are these US segments?
51% of American travellers, or 89.7 million, engaged in some of the offerings intrinsic to the Niagara Region during any of their trips in 2004-2005.
Table 1 shows the size of each of these three segments and their interaction with each other. Relative to the other two segments, the casino segment is the largest accounting for 35% of all American travellers.
Interestingly, a large number of travellers who engage in wine-related activities and who visit natural wonders also engage in casino-related activities (54%). However, the opposite is not true. That is, the casino segment is less dedicated to wine activities and to viewing natural wonders (27% and 28%, respectively) than the wine and natural wonder segments are to casino-related activities.
Table 1: American travellers who participate in Niagara’s core activities while on a trip Segment
Wine Natural
wonder Casino
Number of travellers engaging in activity (000s) 30,479 36,223 61,404
As % of total American travellers 17% 21% 35%
Interaction with other segments
Wine-related activities 100% 33% 27%
Natural wonder activity 40% 100% 28%
Are these activities trip motivators for American travellers?
Although 89.7 million American travellers engaged in some of the primary segment activities, only 20% of them, or 35.1 million, mentioned that these primary activities were the main
reason for taking at least one of their trips in 2004-2005.4
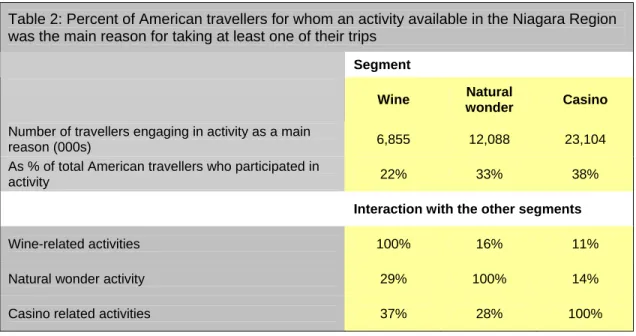
Table 2: Percent of American travellers for whom an activity available in the Niagara Region was the main reason for taking at least one of their trips
Segment
Wine Natural
wonder Casino
Number of travellers engaging in activity as a main
reason (000s) 6,855 12,088 23,104
As % of total American travellers who participated in
activity 22% 33% 38%
Interaction with the other segments
Wine-related activities 100% 16% 11%
Natural wonder activity 29% 100% 14%
Casino related activities 37% 28% 100%
Table 2 shows that the casino segment had the highest percentage of American travellers who indicated that the activity was the main reason for taking at least one of their trips during 2004-2005 (38%).
The wine and natural wonder segments appear to travel for the main purpose of going to a casino (37% and 28%, respectively) to a greater extent than the casino segment is
motivated to travel for the main purpose of participating in activities centered on wine (11%) and viewing natural wonders (14%).
Potential Opportunity Segments for Niagara
Although the previously described activity segments contain a sizeable portion of the US traveling population that enjoys the type of activities that the Niagara Region has to offer, they do not necessarily constitute Niagara’s potential market. Though these activities are available in the Niagara Region, it does not necessarily mean that those who travel for the purpose of participating in these activities will travel to Ontario to do so.
Consider the wine segment, for example: 8% of the total wine segment indicated that they do not think Ontario is a very appealing travel destination and the largest proportion of that group (17%) resides in California.
These individuals, although motivated to travel for wine-centered activities, would not
consider Ontario as a possible travel destination for the purpose of partaking in wine-related activities. For whatever reason (California’s own wine-related offerings, distance, etc.), Ontario is not an attractive destination for this share of the wine segment.
Therefore, in order to identify the growth opportunities for the Niagara Region, the following criteria were imposed on the previously mentioned segments
• Motivation to travel: Travellers are motivated to travel (i.e. main reason) by at least
one of Niagara’s core strength activities - wineries, natural wonders, casino5;
• Destination appeal: Travellers find Ontario to be an appealing travel destination;
• Willingness to travel: Travellers believe there are many good reasons to travel to the province; and
• Importance of destination choice: Travellers have indicated that the choice of destination is very or extremely important to them.
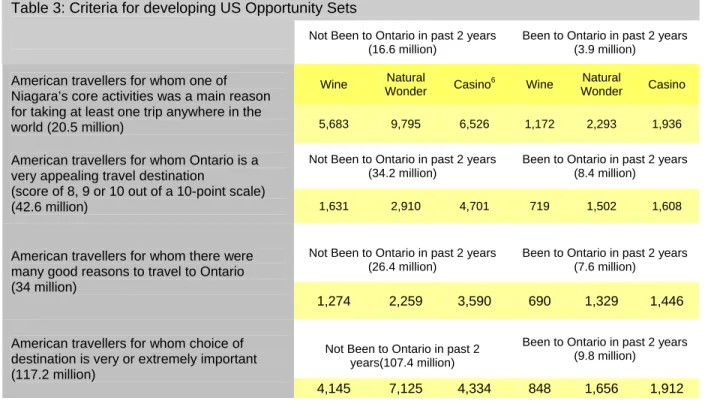
Table 3 shows the number of American travellers corresponding to the application of each of the above criteria. The opportunity sets defined with the above criteria were further divided into those who had visited Ontario in 2004-2005 and those who had not, as these two
groups of travellers would most likely require different strategies, especially from a marketing point of view.
5
Residents must be from Michigan, New York, Ohio or Pennsylvania. 6
For those who took at least one trip for the main purpose of going to a casino, we further require that they are residents of either Michigan or New York, or Ohio or Pennsylvania. The reason for this restriction is that the Niagara casinos have more of a regional appeal as opposed to the Las Vegas casinos that have an international, or long-haul, appeal. This restriction
Table 3: Criteria for developing US Opportunity Sets
Not Been to Ontario in past 2 years (16.6 million)
Been to Ontario in past 2 years (3.9 million) Wine Natural Wonder Casino 6 Wine Natural Wonder Casino
American travellers for whom one of Niagara’s core activities was a main reason for taking at least one trip anywhere in the
world (20.5 million) 5,683 9,795 6,526 1,172 2,293 1,936
Not Been to Ontario in past 2 years (34.2 million)
Been to Ontario in past 2 years (8.4 million)
American travellers for whom Ontario is a very appealing travel destination
(score of 8, 9 or 10 out of a 10-point scale)
(42.6 million) 1,631 2,910 4,701 719 1,502 1,608
Not Been to Ontario in past 2 years (26.4 million)
Been to Ontario in past 2 years (7.6 million)
American travellers for whom there were many good reasons to travel to Ontario (34 million)
1,274 2,259 3,590 690 1,329 1,446
Not Been to Ontario in past 2 years(107.4 million)
Been to Ontario in past 2 years (9.8 million)
American travellers for whom choice of destination is very or extremely important (117.2 million)
Applying all the above criteria to the earlier wine, natural wonder and casino segments provides us with Niagara’s potential opportunity set within the American market which now contains 3.2 million travellers.
Table 4 shows the top 10 origin states for these 3.2 million travellers. The border states and, to a certain extent California where the largest share of the wine market resides (16%), constitute Niagara’s primary markets.
Of the 3.2 million American travellers, or 2% of all American travellers, identified as the total opportunity set for the Niagara Region, 1.4 million (or 44%) have visited Ontario. The natural wonder segment is the largest segment of the total opportunity set, for both non-visitors to Ontario and visitors.
Table 4: State of Resident of U.S. opportunity set for Niagara Region (3.2 million travellers)
Not Been to Ontario in past 2 years (1.8 million)
Been to Ontario in past 2 years (1.4 million)
Top 10 states of Residence Wine Natural
Wonder Casino Wine
Natural
Wonder Casino
Total (000) 678 1,106 348 416 863 473
California 16% 12% N/A 9% 8% N/A
Illinois 7% - N/A 1% 5% N/A
Texas 7% 10% N/A 4% - N/A
Pennsylvania 6% 6% 30% 7% 12% 22%
New York State 5% 6% 39% 14% 12% 25%
Michigan 5% - 13% 13% 10% 23%
New Jersey 5% 3% N/A 3% 5% N/A
Georgia 4% 3% N/A - - N/A
Virginia 4% 3% N/A - - N/A
Arizona 4% 4% N/A - - N/A
Florida - 4% N/A 3% 5% N/A
Louisiana - 4% N/A - - N/A
Ohio - 4% 17% 10% 10% 30%
Minnesota - - N/A 6% 3% N/A
New Mexico - - N/A - 2% N/A
What other key activities do these segments engage in?
Listed below are the top activities (other than the segments’ primary activities) for each of the Niagara segments (the list combines those who had been to Ontario with those who had not):
• Wine segment: restaurants offering local ingredients and recipes; local outdoor cafes; shopping for clothing, shoes and jewellery, strolling around to see buildings and architecture, and going to a casino.
• Natural wonder segment: restaurants offering local ingredients and recipes, visiting well known historic sites/buildings, strolling around a city to see buildings and
architecture, and visiting “other” historic sites (i.e., not well-known).
• Casino segment: restaurants offering local ingredients and recipes; shopping for clothing, shoes and jewellery; going to amusement parks, strolling around to see buildings and architecture, and visiting well-known natural wonders.
There are three activities that are common to all three segments: restaurants offering local ingredients and recipes; strolling around a city to see buildings and architecture; and shopping for clothing, shoes and jewellery – though these are common to most travellers.
Table 5: Top activities for each of the Niagara segments (incidence of participation 50% plus)
Not Been to Ontario in past 2 years (1.8 million)
Been to Ontario in past 2 years (1.4 million)
Activities participated in Wine Wonder Natural Casino Wine Wonder Natural Casino
Well Known Natural Wonders - 100% - 62% 100% 52%
Day Visits to Wineries for Tasting 91% - - 95% - -
Casino 56% - 100% 71% 70% 100%
Stroll A City To See Buildings and
architecture 58% 71% - 73% 70% 50%
Dine – Restaurants offering local
ingredients and recipes - - - 87% 77% 66%
Dine - High-End Restaurants of
international reputation 78% 75% 63% 56% - -
Dine - Other High-End Restaurants - - - 63% - -
Shop - Books/Music Stores 57% 53% - 68% 54%
Shop – Antiques - - - 56% - -
Shop - Retail Gourmet Foods 50% - - 56% - -
Shop - Local Arts & Crafts 57% 60% - 60% 57% -
Shop- Clothing, Shoes, Jewellery 64% 61% 62% 80% 65% 65%
Local Outdoor Cafes 60% 59% - 73% 61% -
Live Theatre - - - 52% - -
Farmers' Markets/ Country Fair 50% - - 55% - -
Movies 53% - - 55% - -
Well-know Historic Sites/Buildings 53% 76% - 69% 70% -
Other Historic Sites/Buildings - 68% - 60% 66% -
Amusement Park 51% - - 55% 54% 57%
Art Galleries 50% - - 51% - -
National/Provincial Nature Park - 59% - - 52% -
Other complementary products
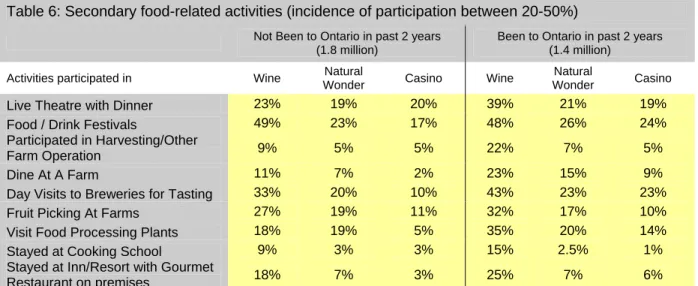
Since there appears to be a focus on food among the Niagara opportunity segments, Table 6 below shows other food-related activities that could be considered as complementary tourism products:
The primary target for these food-related activities is clearly the wine segment, but some of activities also have appeal within to the other segments. For example, live theatre with diner appeals to about 1-in-5 visitors within the casino and natural wonder segments.
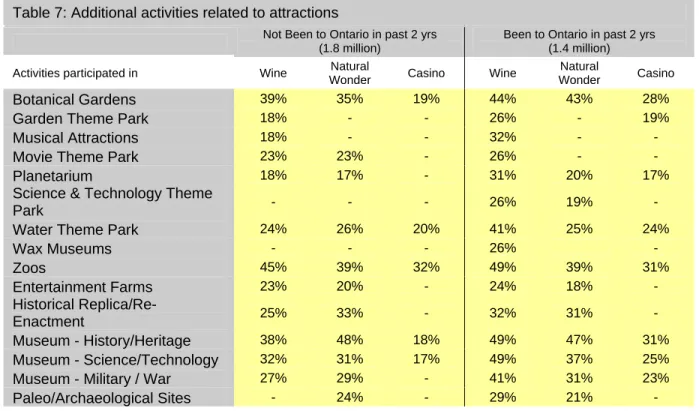
In looking at complementary products in the area of attractions and festivals which might have appeal among the three Niagara opportunity segments, Tables 7 and 8 suggest that, in fact, the American casino segment is very specialized in the types of activities that it pursues and that casino goers are less likely to engage in other forms of activities. The wine and natural wonder segments, however, are more flexible in the types of activities they participate in while travelling.
Table 6: Secondary food-related activities (incidence of participation between 20-50%)
Not Been to Ontario in past 2 years (1.8 million)
Been to Ontario in past 2 years (1.4 million)
Activities participated in Wine Natural
Wonder Casino Wine
Natural
Wonder Casino
Live Theatre with Dinner 23% 19% 20% 39% 21% 19%
Food / Drink Festivals 49% 23% 17% 48% 26% 24%
Participated in Harvesting/Other
Farm Operation 9% 5% 5% 22% 7% 5%
Dine At A Farm 11% 7% 2% 23% 15% 9%
Day Visits to Breweries for Tasting 33% 20% 10% 43% 23% 23%
Fruit Picking At Farms 27% 19% 11% 32% 17% 10%
Visit Food Processing Plants 18% 19% 5% 35% 20% 14%
Stayed at Cooking School 9% 3% 3% 15% 2.5% 1%
Stayed at Inn/Resort with Gourmet
Table 7: Additional activities related to attractions
Not Been to Ontario in past 2 yrs (1.8 million)
Been to Ontario in past 2 yrs (1.4 million) Activities participated in Wine Natural
Wonder Casino Wine
Natural
Wonder Casino
Botanical Gardens 39% 35% 19% 44% 43% 28%
Garden Theme Park 18% - - 26% - 19%
Musical Attractions 18% - - 32% - -
Movie Theme Park 23% 23% - 26% - -
Planetarium 18% 17% - 31% 20% 17%
Science & Technology Theme
Park - - - 26% 19% -
Water Theme Park 24% 26% 20% 41% 25% 24%
Wax Museums - - - 26% - Zoos 45% 39% 32% 49% 39% 31% Entertainment Farms 23% 20% - 24% 18% - Historical Replica/Re-Enactment 25% 33% - 32% 31% - Museum - History/Heritage 38% 48% 18% 49% 47% 31% Museum - Science/Technology 32% 31% 17% 49% 37% 25%
Museum - Military / War 27% 29% - 41% 31% 23%
Paleo/Archaeological Sites - 24% - 29% 21% -
Table 8: Additional activities related to festivals, fairs and performances
Not Been to Ontario in past 2 yrs (1.8 million)
Been to Ontario in past 2 yrs (1.4 million) Activities participated in Wine Natural
Wonder Casino Wine
Natural
Wonder Casino
Ballet/Other Dance Performances 17% - - 27% - -
Classical/Symphony Concert 21% - - 34% 17% -
Free Outdoor Performances 39% 33% 19% 40% 32% 30%
Jazz Concert 25% - 30% - -
Rock & Roll/Popular Concert 26% 25% 26% 47% 27% 29%
Stand-Up Comedy/Variety Shows 26% 17% 20% 41% 26% 33%
Circus - - - 24% - -
Carnivals 27% 20% - 37% 21% 17%
Music Festivals 24% - - 39% 21% -
Theatre Festivals - - - 20% - -
Farmers' Markets/ Country Fair 50% 37% 29% 55% 40% 39%
Exhibition Or Fairs 33% 30% 19% 35% 28% 23%
Food / Drink Festivals 49% 23% 17% 48% 26% 24%
Ethnic Festivals 28% 17% - 29% 23% 15%
Firework Displays 37% 32% 24% 47% 41% 30%
How well does the Niagara Region meet the Americans’ demand?
Table 9 shows the incidence of participation in various activities of overnight US visitors to Niagara Region and the incidence of participation in the same activities by the three segments (unfortunately, the International and Canadian Travel Surveys do not have the
detail captured by TAMS and as such activities have to be aggregated)7:
Although the Niagara Region appears to have many of the activities that overnight US visitors like to participate in when travelling, there is a very large discrepancy between what these travellers like to do and what they actually do when visiting the Niagara Region. Tables 9 and 10 would suggest that either the quality of the product or its awareness is not sufficient to induce US visitors to Niagara to participate in the local product offering or to visit the area for such an offering.
Table 10: Travellers’ Familiarity with Ontario’s Culinary Product
Americans Canadians I am not familiar with Ontario's culinary offerings 70.3% 37.4% I am aware of Ontario's culinary offerings, but have never considered
taking a culinary trip to Ontario 22.9% 45.4% I am aware of Ontario's culinary offerings, and I am considering taking a
culinary trip to Ontario in the future 2.2% 5.3%
I have taken a culinary trip to Ontario in the past 2.8% 10.2% Source: Travel Intentions Study, August 2004, Ontario Ministry of Tourism
7
The following activities were aggregated from the TAMS for Table 9: Shopping: all the “shop or browse” activities in
Table 9: Incidence of participation in activities – existing vs. potential Niagara visitors from the US
Existing overnight US visitors (1.8 million)
Potential market (3.2 million) Overall Casino
participants Park visitors Wine
Natural
Wonder Casino Activity
Activity Participation Rates
Shopping 69% 68% 77% 91% 88% 77% Theme parks 8% 3% 9% 71% 70% 62% National/Provincial parks 29% 24% 100% 59% 66% 41% Historic sites 39% 34% 60% 65% 80% 49% Zoos/botanical gardens/aquariums 9% 17% 15% 68% 63% 50% Museums/art galleries 26% 17% 37% 75% 69% 45%
Festivals and Fairs 8% 7% 7% 85% 71% 60%
Cultural performances 11% 13% 11% 79% 66% 67%
Further evidence of the disconnect between what US travellers like to do and what they actually do or think they could do in the Niagara Region is provided by the Travel Intentions Study. During the February 2007 wave of this study, 47% of Americans, 60% of Ontarians and 65% of Quebec travellers indicated that they were very or fairly interested in visiting Niagara Falls over the next two years for the following reasons:
Table 11: Reasons for being interested in visiting Niagara Falls over the next two years
Americans Canadians
To See the Falls 62% 55%
Its Beautiful 9% 4%
I Like Niagara 9% 3%
The Casino 7% 19%
To See the Sights 6% 6%
Scenery 5% 6%
Tourist Attractions 3% 7%
And when, in the same study, American travellers were asked to provide their “must see” destinations around the world, only 0.2% of them mentioned Niagara Falls.
Table 12: Niagara Falls’ Standing as a “Must See” Destination Mentions Of Niagara Falls Among Residents Of…
US Near Market 0.2%
Buffalo/New York/Syracuse/ Rochester 0.0%
US Mid market 0.4%
Overall US market 0.3%
Canadian Market 0.6%
What the preceding analysis appears to show is that the Niagara Region suffers from an awareness and/or quality problem as a destination overall, and as a supplier of specific tourism-related products. The only product that breaks through appears to be the Falls and as such it should be the Falls that act as the centerpiece of a much broader package of travellers experiences.
Core Products • The Falls • Wineries • Casino Secondary food products
• Local restaurants offering local ingredients and recipes • Outdoor cafes • High-end restaurants with or without an international reputation (52%-73% participation rates) Shopping/strolling • Clothes, shoes, jewellery
stores
• Local crafts & arts stores • Beautification of
sidewalks, shop frontages, buildings, pedestrian zones, etc. • Books and music stores (51%-63% participation rates) Other attractions • Secondary historic sites/buildings • Amusement parks (48%-54% participation rates)
Tertiary food products • Gourmet food stores • Food and drink festivals • Farmers’ markets (28%-38% participation rates) Secondary shopping • Antiques (40% participation rates) Tertiary attractions • History/heritage museum • Zoos and aquariums • Nature parks • Movie and IMAX
theatres • Art galleries • Firework displays • Botanical gardens • Live theatre • Free outdoor performances • Science/technology museum (30%-47% participation rates)
Related Niche-Products: Food • Cooking/wine tasting courses with or
without accommodations on site • Fruit picking at farms
• Visit food processing plants • Dining at farms
• Harvesting and other farm operations • Country inns/resorts with gourmet
restaurants
Related niche-products: Attractions • Lake/riverside resorts
• Rock/pop concerts • Campgrounds • Military museums • Water theme park
• Historical replica with re-enactments • Stand-up Comedy shows
• Carnivals
Product Development
The bricks and mortar of the tourism product
Putting all of the above together, here is a pictorial representation of a product strategy for the Niagara Region for the US market.
Infrastructure and the softer stuff
Apart from the bricks and mortar, however, the quality, scale and awareness of existing products in Niagara will need to be addressed and improved.
The proposed product strategy could also form the basis of a branding exercise since it is the various products and the related ‘softer stuff’ that form the dimensions of a destination’s brand.
In terms of the softer stuff, Table 13 shows that Niagara’s opportunity set expects that the destination should have certain “qualitative” dimensions and provide certain psychological “returns”.
Traveller Expectations
The American travellers that make up Niagara’s opportunity set are looking for destinations that:
• Offer lots of things for adults to do;
• Are hassle-free; and
• That allows them to relax and take a break.
Table 13: Expectations and benefits sought from a pleasure destination (% of travellers)
Segment
What is highly important to them when choosing a pleasure destination?
Total Opportunity Set
Primary importance
1. Feeling safe at the destination (76%)
2. Lots of things for adults to do (69%)
3. Convenient access by car (55%)
4. No health concerns at the destination (52%)
5. Availability of mid-range accommodation (37%)
Segment What are the highly important benefits sought for pleasure travel?
Total Opportunity Set
Primary importance
1. Get a break from the day-to-day environment (77%)
2. Relax and relieve stress (75%)
3. Create lasting memories (73%)
4. To see or do something new and different (70%)
5. Enrich relationship with spouse/partner/children (62%)
Challenges
Niagara Falls has limited “shielding” from the effects that are impeding overnight travel in virtually all of Ontario. According to the Travel Intentions Survey, these are some of the issues that the Niagara Region will also need to address:
• Passport requirements - this is the most significant issue that would make Americans
less inclined to visit Ontario;
• The rising Canadian dollar;
• Awareness, variety and quality issue - “I have been there before” (Canadians 55%,
Americans 34%) and “Not interested in visiting Niagara Falls” (Canadians 21%, Americans 21%)
Transportation
Finally, there is the issue of transportation that is central to tourism.
• Difficulties crossing the border will discourage some US visitors from visiting Ontario
(1.1% of all American travellers mention this as an issue in February of 2007, but 2.3% in August of 2004 when traffic jams are more acute).
• According to a recent study by the Ontario Ministry of Tourism (Ontario’s Tourism
Outlook, June 2007), same-day visits by Ontarians in Ontario may decline by as much as 4.8% in 2011 due to increased traffic on provincial highways. Highway volumes in Ontario have increased by 40% since 1990, and are projected to increase by another 7% by 2011. Since most of these traffic volumes occur in the horseshoe area, it will affect not only the Niagara Region’s same-day traffic from Ontario but also the US traffic across the border. Eventually, as travellers become aware of the
problem it may also affect overnight trips of a short duration.
• In 2005 (International Travel Survey), 44% of all US visitors who entered Canada
through one of the Niagara ports for an overnight trip visited places other than the Niagara Region while 3.4% of the overnight US visitors who entered Canada through Pearson International Airport visited the Niagara Region. As such, traffic on provincial highways in the horseshoe area affects Niagara as well as other parts of Ontario.
• A related issue around highway traffic and same-day visitors is that these visitors are
necessary to keep some of the area attractions profitable and, as such, they “cross-subsidize” overnight travellers who are looking for “lots of things to do”. In light of this, same-day travellers cannot be ignored in a product strategy.
Projections for 2015 and 2025: US Market
Table 14: Projected Future GrowthSegment 2015 2025
Total Opportunity Segment 3.3 million 3.5 million Wine 1.1 million 1.2 million Natural Wonder 2.0 million 2.1 million
Casino 841,000 858,000
Overall, a slight to moderate increase in the total opportunity segment is expected in 2015 and 2025 over current levels (3% and 9%, respectively). The wine segment is expected to grow the most in 2015 and 2025 (10% and 20%, respectively over current levels), followed by the natural wonder segment (5% and 11%, respectively) and the casino segment (2% and 4%, respectively).
Table 15: Growth of Specific Supplementary Products 2006 2015 over 2006 2025 over 2006 Total 3.2 million 3% 9% Wine 1.0 million 10% 20%
Natural Wonder 1.9 million 5% 11%
Casino 822,000 2% 4%
Food-Related Products Rate of change Rate of change
Local restaurants offering local ingredients and recipes 2,334 2% 8%
Outdoor cafes 1,671 3% 7%
High-end restaurants with or without an international reputation 1,658 2% 9%
Farmers’ markets 1,210 3% 10%
Gourmet food stores 1,100 1% 8%
Food and drink festivals 879 3% 11%
Fruit picking at farms 552 3% -1%
Visit food processing plants 507 6% 12%
Dining at farms 298 14% 10%
Country inns/resorts with gourmet restaurants 255 2% 11%
Harvesting and other farm operations 200 11% 18%
Shopping/ Strolling Rate of change Rate of change
Cloths, shoes, jewellery stores 2,020 1% 7%
Beautification of sidewalks, shop frontages, buildings, pedestrian
zones, etc. 1,927 2% 9%
Local crafts & arts stores 1,648 3% 8%
Books and music stores 1,641 2% 10%
Antiques 1,266 3% 10%
Greenhouse or garden centre - 4% 11%
Other Attractions Rate of
change
Rate of change
Secondary historic sites/buildings 1,710 2% 10%
Amusement parks 1,521 1% 4% Nature parks 1,492 1% 8% Movie theatres 1,333 2% 7% History/heritage museum 1,255 2% 12% Zoos 1,210 3% 7% Aquariums 1,173 2% 7% Art galleries 1,171 -1% 6% Firework displays 1,084 3% 7% Botanical gardens 1,053 0% 11% Live theatre 1,012 4% 12%
Free outdoor performances in a park setting 992 2% 13%
Imax Theatres 989 5% 12% Science/technology museum 948 3% 11% Lakeside/riverside resorts 910 3% 11% Rock/pop concerts 850 -5% -3% Campgrounds 835 5% 11% Military museums 805 3% 11%
Water theme park 789 5% 7%
Historical replica with re-enactments 765 4% 10%
Stand-up Comedy shows 714 0% 8%
Carnivals 644 5% 7%
Live theatre with diner 626 3% 13%
Music festivals 583 3% 12%
Golfing with or without a resort 561 -7% -2%
Health spa (day visit or overnight stay) 279 - -
Mini-golf 650 3% 1%
The Ontario Market
Core Activity Segments and Opportunities for Growth
The following section focuses on the Niagara Region’s second primary market – Ontario residents who travelled for an out-of-town trip of one or more nights during 2004-2005.
How large are these Ontario segments?
53% of Ontario travellers, or 4.2 million Ontarians, engaged in some of the offerings intrinsic to the Niagara Region during their trips in 2004-2005.
Table 16 shows the size of each of these three segments and their interaction with each other. Relative to the other two segments, the casino segment is the largest segment, accounting for 32% of all Ontario travellers.
Similar to their American counterparts, a large proportion of Ontarians who engage in wine-related activities and who visit natural wonders also engage in casino-wine-related activities (44% of the wine segment and 42% of the natural wonder segment). Conversely, the casino segment is less dedicated to wine and natural wonder activities (26% and 35%,
respectively).
Table 16: Ontario’s travellers who participate in Niagara’s core activities while on a trip Segment
Wine Natural
wonder Casino
Number of travellers engaging in activity (000s) 1,544 2,025 2,567
As % of total Ontario travellers 19% 25% 32%
Interaction with other segments
Wine- related activities 100% 32% 26%
Natural wonder activity 42% 100% 35%
Are these activities trip motivators for Ontario travellers?
While 4.2 million Ontario travellers engaged in some of the primary segment activities, only 15% of them, or 1.3 million Ontario travellers, reported that participating in these primary activities intrinsic offerings of the Niagara Region were the main reason for taking some of their trips in 2004-2005. 8
Table 17 shows that the natural wonder segment had the highest percentage of Ontario travellers who indicated that the activity was the main for taking at least one of their trips during 2004-2005 (29%).
• The Ontario wine segment had the highest percentage of travellers also travelling for
the main reason of viewing natural wonders and going to casinos (24% and 23%, respectively).
8
Travellers who participated in a same-day winery tour or same-day casino tour were excluded from the wine and casino
Table 17: Percent of Ontario’s travellers for whom an activity available in the Niagara Region was the main reason for taking some trips
Segment
Wine Natural
wonder Casino
Number of travellers engaging in
activity as a main reason (000s) 294 595 597
As % of total Ontario travellers
who participated in activity 19% 29% 23%
Interaction with the other segments
Wine-related activities 100% 12% 11%
Natural wonder activity 24% 100% 22%
Potential Opportunity Segments for Niagara
As with US market, an additional level of segmentation was undertaken since not all of the travellers who enjoy the type of activities that the Niagara Region has to offer necessarily constitute Niagara’s potential market.
Consider a portion of Ontario’s wine segment for example – approximately 19% of Ontario residents who were motivated to take trips for wine-related activities indicated they find Ontario unappealing or only somewhat appealing as a travel destination (1% and 18%, respectively). This market of travellers is more likely to substitute Ontario for other destinations, whereas those travellers who indicated Ontario is very appealing are more likely to travel within the province.
Therefore, in order to focus more specifically on the portion of the segments described in the previous section that represent the growth opportunities for the Niagara Region, the
following additional criteria were imposed:
• Motivation to travel;
• Destination appeal ;
• Willingness to travel; and
• Importance of destination choice.
Table 18 shows the number of Ontarians who meet each of the criteria set out above. The opportunity sets defined were further divided into those who had travelled in Ontario and those who did not, as these two groups of travellers would most likely require different strategies, especially from a marketing point of view.
Table 18: Criteria for developing Niagara’s opportunity set (000)
Travelled in Ontario in past 2 years (1.1 million)
Not travelled to Ontario in past 2 years (112,000)
Wine Natural
Wonder Casino Wine
Natural
Wonder Casino
Ontario travellers for whom one of Niagara’s core activities was a main reason for taking at least one trip anywhere in the world
(1.2 million) 271 556 532 22 38 65
Travelled in Ontario in past 2 years (4.6 million)
Not travelled to Ontario in past 2 years (714,000)
Ontario travellers for whom Ontario is a very appealing travel destination
(scores 8,9 or 10 out of a 10 point scale)
(5.3 million) 214 416 403 18 20 28
Travelled in Ontario in past 2 years (4.4 million)
Not travelled to Ontario in past 2 years (610,000)
Ontario travellers for whom there were many good reasons to travel to Ontario (5.0 million)
Applying all the above filters to the earlier wine, natural wonder and casino segments, provides us with Niagara’s potential opportunity set within Ontario. The segment comprises a total of 525,000 Ontario travellers.
Table 19 shows top 10 places of residence for these travellers.
Table 19: Place of Residence for Ontario opportunity set for Niagara Region (525,000 travellers)
Travelled in Ontario in past 2 years (484,000)
Not travelled in Ontario in past 2 years (41,000) Top 10 Places of Residence Wine Natural
Wonder Casino Wine
Natural Wonder Casino Total (000) 117 258 216 13 12 16 Toronto 46% 33% 40% 71% 43% 55% Other Ontario 20% 26% 24% 28% 17% 23% Hamilton 8% 7% 9% - 2% 4% Ottawa 6% 8% 7% 2% 5% 12% London 5% 5% 4% - - 2% Oshawa 5% 5% 6% - - - Windsor 4% 4% - - - - Kitchener 3% 4% 3% - 33% 5% St. Catharines-Niagara 1% - 3% - - - Kingston 1% 3% 2% - - - Greater Sudbury - 2% 1% - - -
The primary markets for the Niagara Region are Toronto and “Other Ontario” (which specifically excludes the municipalities of Ottawa, Kingston, Toronto, Hamilton, St. Catharines-Niagara, Kitchener, London, Windsor, Greater Sudbury and Thunder Bay.) Of the 525,000 Ontario travellers, or 6% of all Ontario travellers, identified as the total opportunity set for the Niagara Region, 484,000 (or 92%) have visited Ontario. The natural wonder segment is the largest segment of the total opportunity set for those who travel in Ontario and the casino segment is the largest segment for the non-visiting group.
What other key activities do these segments engage in?
Listed below are the top 5 other activities (other than the segments’ primary activities) for each of the Niagara segments:
• Wine segment: strolling around a city to see buildings and architecture; restaurants offering local ingredients and recipes; shopping for arts and crafts; shopping for clothing, shoes and jewellery; and sunbathing/sitting on a beach.
• Natural wonder segment: strolling around a city to see buildings and architecture, restaurants offering local ingredients and recipes, visited known historic sites/ buildings; shopping for clothing, shoes and jewellery; and shopping for books and music.
• Casino segment: restaurants offering local ingredients and recipes; shopping for
Table 20: Top activities for each of the Niagara segments (incidence of participation 50% plus)
Travelled in Ontario in past 2 years (484,000)
Not travelled in Ontario in past 2 years (41,000)
Activities participated in Wine Natural
Wonder Casino Wine
Natural
Wonder Casino
Visited well known natural ‘wonders’ - 100% - - 100% -
Strolled city observe bldgs & architecture 69% 77% - - - -
Restaurants – local ingredients/recipes 67% 71% 58% 53% 93% -
Visited known historic sites/ buildings - 69% - 51% 54% -
Shop/browse bookstores or music stores - 67% - - - -
Shop/browse clothing, shoes, jewellery 66% 66% 70% 69% 95% 54%
Shop local arts-crafts studio/exhibition 58% 61% - 51% - -
Went to local outdoor cafes 54% 56% - - 61% -
Nature park - 55% - - - -
Visited other historic
sites/monuments/buildings - 54% - - - -
Went to casino(s) - 52% 100% 34% 67% 100%
Sunbathing/sitting on beach 58% 51% 55% - - -
Swimming in lakes - 51% 50% - - -
Visited museum- general history/heritage - 51% - 54% - -
Visited wineries for day tastings 95% - - 100% - -
Attended ethnic festivals - - - 73% - -
Swimming in oceans - - - 61% - -
Golfing- played occasionally - - - 53% - -
Stayed in lakeside/riverside resort - - - 53% - -
Visited amusement parks - - - 50% - -
Visited botanical gardens - - - - 54% -
Attended classical or symphony concerts - - - - 52% -
Other complementary products
Since food-related activities appear to be of significant interest for these segments, Table 21 below shows other food-related activities that could be considered as complementary
tourism products in the Niagara Region’s product strategy:
The wine segment is the primary target for these food-related activities; however, all three segments that have travelled in Ontario are also important secondary targets. Shopping or browsing for gourmet foods appeals to all segments, followed closely by dining in other high-end restaurants and dining in restaurants with an international reputation.
Significantly, the travellers in the wine segment that had not travelled to Ontario showed significant interest in most of the food-related activities listed. This group would certainly merit further investigation given their interest in wine and food-related activities and their positive predisposition to Ontario to determine why they have not taken any overnight trips in their own province.
In terms of other complementary products in the area of festivals, fairs and attractions, Tables 22 and 23 suggest that the casino segment that has not travelled in Ontario is very specialized and activity-focused when they travel. They are less likely to engage in other forms of activities, whereas the wine and natural wonder segments are more flexible in the types of activities they participate in.
Table 21: Complementary food-related activities (incidence of participation between 20-50%)
Travelled in Ontario in past 2 years (484,000)
Not travelled in Ontario in past 2 years (41,000)
Activities participated in Wine Natural Wonder Casino Wine Natural Wonder Casino
Dining in other high-end
restaurants 41% 47% 37% 39% 36% -
Dining in restaurants with an
international reputation 37% 39% 23% 46% - 20%
Shop/browse gourmet food stores 33% 28% 23% 40% 33% 21%
Attending farmers markets/ country
fairs 48% 45% 33% - 20% -
Live theatre with dinner - - - 48% - -
Food/drink festivals 21% - - 39% - -
Table 22: Additional activities related to festivals, fairs and performances
Travelled in Ontario in past 2 years (484,000)
Not travelled in Ontario in past 2 years (41,000)
Activities participated in Wine Natural
Wonder Casino Wine
Natural
Wonder Casino
Ballet/Other Dance Performances 15% 16% 11% 35% 39% -
Classical/Symphony Concert 13% 12% 7% 37% 52% -
Free Outdoor Performances 31% 27% 23% 12% 38% 33%
Jazz Concert 12% 12% 10% 35% - -
Rock & Roll/Popular Concert 21% 27% 30% - 14% -
Stand-Up Comedy/Variety Shows 18% 17% 14% 35% 10% 7%
Circus 6% 7% 4% 10% - -
Carnivals 8% 9% 17% 35% 10% -
Music Festivals 18% 16% 11% - 38% 24%
Theatre Festivals 15% 12% 8% - - -
Farmers’ Markets/ Country Fair 48% 45% 33% - 20% -
Exhibition Or Fairs 21% 26% 17% 21% - -
Food / Drink Festivals 21% 16% 19% 38% 11% 21%
Ethnic Festivals 7% 15% 15% 73% 10% -
Firework Displays 22% 33% 25% - 13% 10%
Hot Air Balloon Festivals - - - -
Table 23: Additional activities related to attractions
Travelled in Ontario in past 2 years (484,000)
Not travelled in Ontario in past 2 years (41,000)
Activities participated in Wine Natural
Wonder Casino Wine Natural Wonder Casino
Botanical Gardens 27% 35% 21% - 54% 7%
Garden Theme Park 8% 19% 11% 35% 20% 5%
Musical Attractions 13% 15% 14% - 6% 5%
Movie Theme Park 8% 6% 7% 35% - 7%
Planetarium 4% 8% 6% 35% - -
Science & Technology Theme
Park 19% 21% 25% 45% 29% 5%
Water Theme Park 16% 22% 17% - - -
Wax Museums 6% 13% 12% 10% 29% - Zoos 23% 28% 20% 10% 49% 5% Entertainment Farms 13% 15% 15% - - - Historical Replica/Re-Enactment 16% 31% 15% 6% 4% 8% Museum – History/Heritage 31% 50% 29% 54% 15% 12%
How well does the Niagara Region meet the Ontario travellers’ demand?
The table below shows the incidence of participation in various activities of overnight Ontario visitors to the Niagara Region and the incidence of participation in the same activities among the three segments (unfortunately the International and Canadian Travel Surveys do not
have the detail captured by TAMS and as such activities have to be aggregated)9
Although the Niagara Region appears to have many of the travel products and activities that Ontarians taking overnight trips look for, there is a very large discrepancy between what these travellers do when they travel and what they actually do when visiting the Niagara Region (Table 24).
As discussed earlier with regards to the US market, the Travel Intentions Study provides further evidence that the variety, quality and/or awareness of the Niagara tourism offering is not sufficient to motivate Ontarians to visit the Region.
9The following activities were aggregated from the TAMS for Table 24: Shopping: all the “shop or browse” activities in TAMS; Theme Parks: amusement park, garden theme park, musical attraction, movie theme park, planetarium, science & technology theme park, water them park, wax museums and historical replica; National/Provincial nature park: national provincial nature park, public campground in a national provincial park and interpretive centre in a
national/provincial park; Historic Sites: archeological/paleontological sites, well known historic site or building, other historic sites or buildings; Zoos/Aquariums/Botanical gardens: only these three; Museums/art galleries: all 4-types of museums and art galleries; Festivals and Fairs: all activities under festivals and fairs; Casinos: went to a casino and same day tour to a casino; and Cultural Performance: all activities under performing arts.
Table 24: Incidence of participation in activities – existing vs. potential Niagara visitors from Ontario
Existing overnight Ontario visitors
(2.2 million) Potential market (525,000)
Overall Casino visitors Park visitors Wine Natural Wonder Casino Activity
Activity Participation Rates
Shopping 49% 53% 49% 81% 89% 78% Theme parks 13% 8% 21% 49% 66% 53% National/Provincial parks 11% 11% 100% 51% 63% 46% Historic sites 19% 21% 55% 58% 65% 46% Zoos/botanical gardens/aquariums 12% 15% 31% 42% 62% 38% Museums/art galleries 8% 11% 7% 57% 64% 41%
Festivals and Fairs 7% 7% 4% 75% 73% 59%
Cultural performances 6% 5% 4% 65% 68% 58%
Product Development
The bricks and mortar of the tourism product
Putting all of the above together, here is a pictorial representation of a product strategy for the Niagara Region for the Ontario market.
Core Products • The Falls • Wineries • Casino Secondary food products
• Local restaurants offering local
ingredients and recipes • Outdoor cafes • High-end restaurants with or without an international reputation (47%-64% participation rates) Shopping/strolling • Clothes, shoes, jewellery
stores
• Local crafts & arts stores • Beautification of sidewalks,
shop frontages, buildings, pedestrian zones, etc. • Books and music stores (49%-67% participation rates) Other attractions • Secondary historic sites/buildings • Nature parks (40%-42% participation rates)
Tertiary food products • Gourmet food stores • Farmers’ markets (26%-34% participation rates) Secondary shopping • Antiques • Garden centres/ greenhouses (26%-37% participation rates) Tertiary attractions • Lake/riverside resorts • History/heritage museum • Movie theatres • Campgrounds • Amusement parks • Art galleries • Live theatre • Science/technology museum (27%-37% participation rates)
Related Niche-Products: Food • Cooking/wine tasting courses with or
without accommodations on site • Food and drink festivals • Fruit picking at farms • Visit food processing plants • Dining at farms
• Harvesting and other farm operations • Country inns/resorts with gourmet
restaurants
Related niche-products: Attractions • Rock/pop concerts
• Botanical gardens
• Free outdoor performances in a park • Firework displays
• Zoos
• Military museums • Aquariums
• Historical replica with re-enactments • Mini golf
• Exhibitions or fairs • Imax Theatres
Infrastructure and the softer stuff
As Table 25 below shows, the Ontario market is very similar to the US market in terms of the “qualitative” dimensions that they are looking for when choosing a travel destination. The only additional dimension mentioned by Ontarians was the threat of violence and/or crime as a barrier to travel in Ontario10 (6.6%). This figure is substantially higher than the
corresponding figure in the US.
Table 25: Expectations and benefits sought from a pleasure destination % of travellers)
Segment What is highly important about pleasure destinations?
Total Opportunity Set Primary importance
1. Feeling safe at the destination (78%)
2. Lots of things for adults to do (66%)
3. Convenient access by car (53%)
4. No health concerns at the destination (52%)
5. Availability of mid-range accommodation (44%)
Segment What are the highly important benefits sought from pleasure travel?
Total Opportunity Set
Primary importance
1. Get a break from the day-to-day environment (74%)
2. Relax and relieve stress (74%)
3. Create lasting memories (68%)
4. Enrich relationship with spouse/partner/children (62%)
5. See or do something new and different (62%)
Projections for 2015 and 2025: Ontario Market
Table 26: Projected Future Growth
Segment 2015 2025
Total Opportunity Segment 577,000 632,000
Wine 145,000 168,000
Natural Wonder 296,000 315,000
Casino 232,000 262,000
Overall, moderate growth in the total opportunity segment is expected in 2015 and 2025 over current levels (10% and 20%, respectively). The wine segment is expected to grow the most in 2015 and 2025 over current levels (11% and 28%, respectively), followed by the natural wonder segment (10% and 17%, respectively) and the casino segment (5% and 13%, respectively).
Table 27 highlights the implications the projections for 2015 and 2025 would have on the Niagara Region’s tourism product strategy for the Ontario market. Those activities which show declining or increasing levels of interest as well as those which could be considered emerging interests relative to current 2006 levels are indicated.
Table 27: Growth of Supplementary Products 2006 2015 over 2006 2025 over 2006 Total 525,000 10% 20% Wine 131,000 11% 28% Natural Wonder 270,000 10% 17% Casino 232,000 5% 13% Food-Related Products
Rate of change Rate of change Local restaurants offering local ingredients and recipes 335 9% 19% High-end restaurants with or without an international
reputation 260 6% 16%
Outdoor cafes 245 8% 16%
Farmers’ markets 178 5% 14%
Gourmet food stores 136 11% 27%
Fruit picking at farms 94 1% 3%
Food and drink festivals 86 -9% -9%
Visit food processing plants 58 -1% 4%
Country inns/resorts with gourmet restaurants 48 4% 2%
Dining at farms 28 18% 21%
Harvesting and other farm operations 26 -11% -21%
Shopping/ Strolling Rate of change Rate of change
Cloths, shoes, jewellery stores 351 8% 17%
Beautification of sidewalks, shop frontages, buildings,
pedestrian zones, etc. 310 9% 17%
Local crafts & arts stores 260 10% 28%
Books and music stores 282 9% 22%
Antiques 195 7% 20%
Greenhouse or garden centre 134 12% 18%
Other Attractions Rate of change Rate of change
Nature parks 218 8% 15%
Secondary historic sites/buildings 210 5% 8%
Lakeside/riverside resorts 195 3% 14% History/heritage museum 192 9% 20% Movie theatres 185 4% 9% Campgrounds 172 6% 3% Amusement parks 169 0% -4% Art galleries 167 7% 13% Live theatre 158 13% 28% Science/technology museum 141 8% 11% Rock/pop concerts 130 1% 6% Botanical gardens 129 11% 18%
Free outdoor performances in a park setting 128 1% 7%
Firework displays 120 -3% -10%
Zoos 117 5% 9%
Golfing with or without a resort 108 13% 24%
Aquariums 105 11% 6%
Military museums 105 6% 1%
Historical replica with re-enactments 103 5% 22%
Mini-golf 98 -2% X