Western University
Scholarship@Western
Business Publications
Business (Richard Ivey School of Business)
2017
Discrete event simulation model for planning Level
2 “step-down” bed needs using NEMS
Felipe F. Rodrigues
Ivey Business School at Western University, [email protected]
Gregory S. Zaric
University of Western Ontario
David Stanford
Western University
Follow this and additional works at:
https://ir.lib.uwo.ca/iveypub
Part of the
Business Administration, Management, and Operations Commons
,
Health and
Medical Administration Commons
,
Health Services Administration Commons
, and the
Management Sciences and Quantitative Methods Commons
Citation of this paper:
F. Rodrigues, G.S. Zaric, D.A. Stanford, Discrete event simulation model for planning Level 2 “step-down” bed needs using NEMS, In Operations Research for Health Care, 2017, ISSN 2211-6923, https://doi.org/10.1016/j.orhc.2017.10.001.
Discrete event simulation model for
planning Level 2 “step-down” bed needs
using NEMS
F.Rodrigues, G.S.Zaric, D.A.Stanford
This is the peer reviewed version of the following article: F. Rodrigues, G.S. Zaric, D.A.
Stanford, Discrete event simulation model for planning Level 2 “step
-
down” bed needs using
NEMS, In Operations Research for Health Care, 2017, which has been published in final form
at
https://doi.org/10.1016/j.orhc.2017.10.001. This article may be used for non-commercial
purposes in accordance with Elsevier
’
s Terms and Conditions for Self-Archiving."
Discrete event simulation model for planning Level 2
step-down bed needs using NEMS
I,IIF. Rodriguesa,∗, G. S. Zarica, D. A. Stanfordb
aIvey Business School at Western University, London, Ontario, N6G 0N1, Canada bStatistical & Actuarial Sciences at Western University, London, Ontario, N6A 3K7,
Canada
Abstract
In highly congested hospitals it may be common for patients to overstay at In-tensive Care Units (ICU) due to blockages and imbalances in capacity. This is inadequate clinically, as patients occupy a service they no longer need; opera-tionally, as it disrupts ow from upstream units; and nancially as ICU beds are more expensive than ward beds. Step-down beds, also known as Level 2 beds, have become an increasingly popular and less expensive alternative to ICU beds to deal with this issue. We developed a discrete event simulation model that estimates Level 2 bed needs for a large university hospital. The model innovates by simulating the entirety of the hospital's inpatient ow and most importantly, the ICU's daily stochastic ows based on a nursing workload scoring metrics called "Nine Equivalents of Nursing Manpower Use Score" (NEMS). Using data from a large academic hospital, the model shows the benets of Level 2 beds in improving both patient ow and costs.
IThis work was supported by: The Ontario Trillium Scholarship program (OTS); The
Ivey International Centre for Health Innovation (IICHI); Natural Sciences and Engineering Research Council of Canada (NSERC), and the Universidade Federal do Parana (UFPR). These funding sources had no active role in the study design, collection, analysis, interpretation of data, writing of the report or decision to submit the article for publication. This research is approved by Western University's and LHSC's Research Ethics Board under the le # REB 105583.
IIWe would like to acknowledge the contribution of the following: J. Kojlak, Dr. C. Martin
and F. Priestap from London Health Sciences Center, London, Ontario, N6A 5W9, Canada
∗Corresponding author
Email address: [email protected] (F. Rodrigues)
2 Keywords: bed capacity planning, patient ow, step-down beds, Level 2 beds, discrete-event simulation, NEMS
2008 MSC: 68M20 Performance evaluation; queuing; scheduling, 90B15 Network models, 90B22 Queues and service, 90B90 Case-oriented studies, 91B70 Stochastic models, 91B74 Models of real-world systems
1. Introduction
1
Contemporary hospitals in developed countries strive to provide the best
2
possible patient care while keeping costs at reasonable levels (Doig [12],
Batche-3
lor [6], Hoyt [20]). Hospital beds are too costly to remain idle, while insucient
4
beds can be detrimental to in patient care (Harper [18]). Critical care in
par-5
ticular is very expensive: in the USA and Canada, ward beds cost as much
6
as $1,000/day while critical care beds surpass $3,500/day (Noseworthy et al.
7
[36], Halpern and Pastores [17]).
8
The University Hospital (UH) campus of the London Health Sciences
Cen-9
tre (LHSC) is a 400 bed hospital responsible for approximately 6,200 surgeries,
10
60,000 emergency visits, 300,000 ambulatory visits and 17,000 inpatient
admis-11
sions per year (LHSC [29]). It routinely experiences bed utilization rates above
12
85% which are high compared to the North American average of 67.6% for
com-13
parable sized hospitals (NCHS [34]). When the wards at UH become congested
14
there is pressure on the Medical-Surgical Intensive care unit (MSICU) to take
15
one of two actions: hold some patients in ICU longer than they care (overstay),
16
or transfer some patients to a ward other than their intended one ("o-service").
17
Overstay creates a ripple eect in upstream units such as the Operating Room
18
(OR) and the Emergency Department (ED), resulting in a disruption in
pa-19
tient ow upstream, delayed surgeries and lengthy ED visits. O-service is
20
sub-optimal clinically because of sta specialization, such as intensivist nurses
3 and physicians. O-service is also sub-optimal operationally because
special-22
ist doctors must visit dierent wards to see their patients, creating delays and
23
coordination issues. Thus, o-service treatment should be avoided whenever
24
possible (Shukla et al. [45]). LHSC estimates that up to 30% of patients at in
25
the specialized Multi-Organ Transplant unit are o-service patients.
26
To improve patient ow, provide adequate care and reduce costs, UH intends
27
to implement an intermediary care unit between the MSICU and its downstream
28
wards, called "step-down" or, "Level 2" unit (L2). These wards usually do not
29
support ventilation, but they can still provide some organ support (see Table 1).
30
They are less costly in technology and in the patient/nurse ratio, typically two
31
patients per nurse rather than one-on-one found in ICU. Among UH's primary
32
concerns is the determination of the ideal capacity a new L2 unit should have
33
if such unit were to be employed.
34
This research assesses the impact of step-down beds on a number of hospital
35
metrics including throughput, length of stay (LOS), o-service and cost. We
36
develop a DES model to analyze a hospital's L2 bed needs that incorporates the
37
changes in ICU patient health through time, where patient health is modeled
38
by the NEMS. We address the following research questions:
39
1. What is the impact of a L2 unit on throughput, o-service, inpatient LOS
40
and cost?
41
2. What is the optimal allocation of MSICU and Level 2 beds for UH?
42
2. Literature Review
43
2.1. Research streams
44
There ares two main streams of literature related to bed capacity
manage-45
ment and planning: queuing models and discrete-event simulation (DES) models
2.1 Research streams 4 T able 1: Le vels of care ch aracteristics at LH SC Lev el of care Bed characteristics P atien t/n urse ratio Estimated cost $/patien t-da y 1 NEMS 2 1 Standard W ard bed: No organ supp ort, no ven tilation 3 or more to 1 $600 ≤ 10 2 Step-do wn bed: Supp ort single failed organ system, no ven tilation 2 to 1 $2,000 11 to 25 3 In tensiv e care bed: In vasiv e ven tilatio n and m ultiple organ supp ort 1 to 1 $3,500 26 to 56 1 Estimated cost pro vided by LHSC Manageme nt; 2 Nine equiv alen ts of nursing manp ow er use score (Miranda et al. [32])
2.2 Discrete Event Simulation in Health Care Capacity Management 5 (Bountourelis et al. [7]). Queuing models range from analytical queuing
method-47
ology such as the use of theM/M/1(Green [15]) and Erlang loss models (Green
48
et al. [16], Rau et al. [38]) to the use of complex network models (Osorio and
49
Bierlaire [37], Bretthauer et al. [9], Noghani Ardestani [35], Zonderland et al.
50
[47]). Green [15] presents a survey of this stream of literature, and taxonomies
51
have been devised by Mielczarek and Uzialko-Mydlikowska [31], Lakshmi C.
52
[26], Bountourelis et al. [7].
53
2.2. Discrete Event Simulation in Health Care Capacity Management
54
DES is a popular alternative to queuing models because it is possible to
55
study applications with large scale and scope and to relax many of the
assump-56
tions necessary in queuing models. The DES literature most often focuses on
57
a single unit of a hospital (e.g. ED, OR) and/or on a single type of patients
58
(e.g. trauma, surgery, cardiac). Research is usually focused on designing a new
59
patient ow strategy (early transfers, faster service, better schedules) often in
60
combination with structural improvements, such as pooling, or increased
capac-61
ity. For example, Harper [18] tested pooling respiratory patients into a single
62
unit similar to a L2 unit. Harper [18] found pooling to show signicant
improve-63
ments in patient throughput and ow balance. Rohleder et al. [40], Rau et al.
64
[38] share those ndings, but stress that pooling patients seems to be
partic-65
ularly benecial in high variance service time settings such as ICU's. Shahani
66
et al. [44] simulate a high dependency unit (HDU) and they found that pooling
67
alone only managed to reduce transfers/o-service but kept similar
through-68
put and utilization levels. They could only achieve better results when pooling
69
was combined with earlier stepping-down of long stay patients. Van Berkel
70
and Blake [46] found that capacity increase alone is not enough to stabilize
71
OR patient ows, often requiring faster service times as well. Comparable
re-72
sults are found by Duguay and Chetouane [13], Khare et al. [23], Konrad et al.
2.3 Contributions of this paper 6 [25] in emergency department settings. Ridge et al. [39], Kolker [24], Marmor
74
et al. [30] investigated congestion by smoothing surgery schedules, which
en-75
abled performance gains in ICU utilization, LOS and o-service. Seung-Chul
76
et al. [43], Dobson et al. [11], Anderson et al. [4, 3], KC and Terwiesch [22]
77
suggest that highly congested health care systems may trigger other responses
-78
such as early discharges/transfers/o-service - in order to accommodate higher
79
demands, often with negative results.
80
2.3. Contributions of this paper
81
Our model attempts to correctly represent the complex ow and
interac-82
tions present in modern general hospitals without some of the simplications
83
found in the literature. Our DES model includes bounce-backs (patients
be-84
ing transferred back from wards to units upstream), overstay and o-service
85
endogenously. In other words, those phenomena are consequences of congestion
86
as opposed to exogenous parameters of the simulation. Thus, we are able to
87
observe congestion and the impact of changes in capacity and bed mix on
con-88
gestion. We nd a clear trade-o between added capacity and changes in bed
89
mix that might otherwise be absent in previous models due to simplifying
as-90
sumptions. A model that does not include all these characteristics may provide
91
little help in capacity planning problems.
92
In addition, we include in the ICU simulation the patient's daily health
93
changes in the form of a death/NEMS scoring routine. This stochastic process
94
provides a precise, realistic simulation of an ICU patient and endogenously
95
creates reliable LOS for bed capacity purposes.
7 3. Materials and Methods
97
3.1. Initial Steps
98
The rst step of the research was to meet with several managers at LHSC to
99
understand the problem and agree upon stakeholder involvement as suggested
100
by Brailsford et al. [8]. The research objective was dened during the rst three
101
exploratory meetings and validated after an initial research proposal draft was
102
presented. The research proposal was reviewed and approved by ethics boards
103
of LHSC and Western University. Management at LHSC were highly involved
104
with the research, periodically revising goals and methods and validating each
105
step to ensure meaningful and actionable results.
106
3.2. Model Overview
107
We built the DES model using the software package Simul8®. This software
108
was chosen for three main reasons. First, it has become a popular choice in the
109
healthcare DES literature (Almashra and Vanderbloemen [2], Mohiuddin et al.
110
[33], Salleh et al. [41]). Secondly, its ease of coding allows for exible modeling,
111
and it features a graphical interface that plays an important role in conveying
112
results to multiple stakeholders. Thirdly, and because of the former two, our
113
institution has experience in using this software for healthcare DES research.
114
We built the model representing the current capacity allocation of UH as
115
a baseline scenario (Figure 1; for a detailed model, see A.10). There are six
116
entry points for inpatients: Emergency Department (ED), Operating Room
117
(OR), Clinics, Victoria Hospital (the other major hospital in the LHSC
sys-118
tem), OneConsult (inpatient transfers from other hospitals outside of the LHSC
119
system), ADT (Admission/Discharge/Transfer). ADT is is a mock entry point
120
the hospital uses to temporarily admit patients while they are not assigned a
121
bed in a ward. Each entry point has its own inter-arrival time distributions
3.2 Model Overview 8 Figure 1: L2 patien t o w mo del
3.3 Patient Flow Data 9 (see AppendixA). Inpatients ow from the entry points to the remaining units.
123
There are two independent Level 3 units (MSICU and Cardiac-Surgical
Inten-124
sive Care Unit (CSRU), three existing Level 2 units (tailored to other specic
125
patient groups) and twelve specialized wards (Table A.8). Patients exit the
126
hospital via three routes: Discharge, Signed Out, or Death.
127
Since the level of care is closely related to patient/nurse ratio, LHSC has
128
historically used nursing workload as a proxy for patient readiness to step down
129
to a lower level of care. As part of the MSICU's routine, every patient is scored
130
daily in a 56 point scale known as "Nine equivalents of nursing manpower use
131
score" or "NEMS" (Miranda et al. [32]). The NEMS gives a measurement of the
132
workload a nurse has for each patient over time and is closely related to patient
133
health because as the patient's health improves, less nursing attention is needed,
134
resulting in a lower NEMS. Empirically, LHSC considers a score below 10 to be
135
a "Ward type" patient; scores between 11-25 would be "L2 type" patient, and
136
from 26-56 an "ICU type" patient (see Table 1).
137
3.3. Patient Flow Data
138
The model was t using the most recent one year of data in which UH's
139
bed allocation was stable (i.e., same number of beds in all units over the entire
140
year), from December 1st2013 to November 30th2014. Data was gathered from 141
the hospital's patient management system, including:
142
1. Inpatient arrivals: patient registry number, age, sex, diagnosis, entry
143
point, exit point, service at arrival, service at discharge, discharge category
144
(discharge, death, transfer), dates and time of arrival and of discharge.
145
2. Inpatient Transfers: all of the above plus the date and time of entry and
146
of exit of patients into each unit of UH, origin and destination unit.
147
3. Hospital bed capacity: number of available beds in each unit during the
148
research period
3.4 Transition Probabilities 10 4. Nursing workloads: patient registry number, age, sex, diagnosis, discharge
150
category (discharge, death, transfer), time and daily NEMS measurements
151
at MSICU
152
5. Costs: Estimated daily bed costs at each unit
153
We estimated length-of-stay (LOS) distributions for each unit, patient outcome
154
distributions and patient transfer matrix to represent transitions between
hospi-155
tal units. Note that LOS is ward-specic but does not depend on patient type.
156
For all cases, several distributions were considered (Banks [5]) and chosen on
157
basis of Akaike information criterion(AIC, Akaike [1]) and Bayesian
informa-158
tion criterion (BIC, Schwarz [42], Hastie et al. [19]), as is common in this line
159
of research (e.g. Shukla et al. [45], Rau et al. [38]).
160
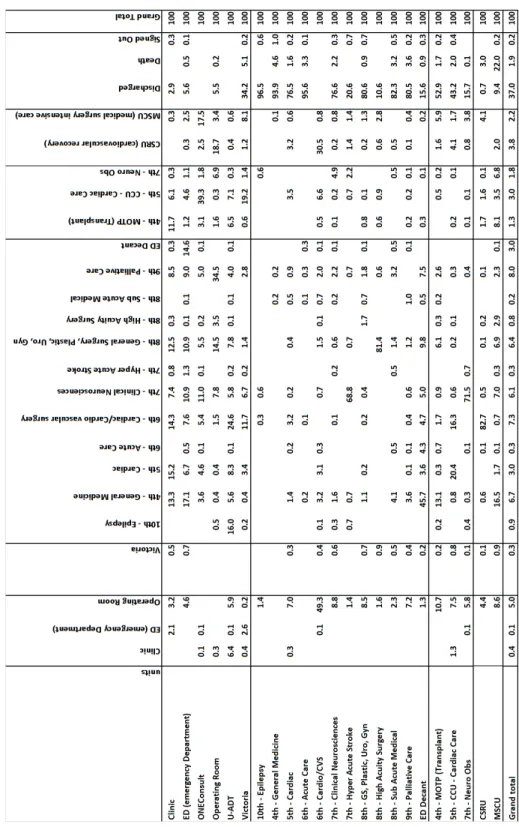
3.4. Transition Probabilities
161
There were 17,380 patients representing 42,012 internal movements (an
av-162
erage of 2.41 records/patient) represented in the patient ow matrix (Figure
163
A.11). Each transfer has an unique destination. However, if the intended unit
164
is full, then the practice is to transfer the patient to an alternate unit,
caus-165
ing o-service care. In this way, individual o-service decisions are determined
166
probabilistically. Deaths from the MSICU were modeled separately using a
167
logarithmic function (Figure A.13).
168
During the patient's stay at MSICU, patients receive a NEMS upon arrival
169
to MSICU, and a revised score every morning during their stay in MSICU.
170
Once the patient reaches a NEMS consistent with a L2 type, she attempts to
171
exit the MSICU and reach the new L2 unit. In the baseline scenario, patients
172
exit MSICU if they reach a ward type NEMS.
3.5 Cost Data 11 3.5. Cost Data
174
LHSC supplied cost per patient-day for each level of care (Table 1) as well
175
as capital expenditure estimates for 8 and 15 L2 beds (originated for a previous
176
investment in another site) . We calculated annualized capital expenditures for
177
the entire range from two to 28 L2 beds by linear extrapolation and 10 year
178
linear depreciation, consistent with Canadian accounting practice (Table A.10).
179
3.6. Simulation scenarios and runs
180
We evaluated the following scenarios:
181
1. Capacity increase with a L2 unit: Adding a range from 2 to 20 L2 beds
182
into the existing baseline model.
183
2. Capacity re-allocation: Maintain a total of 25 beds while shifting capacity
184
from MSICU into the new L2 unit.
185
3. Capacity re-allocation: Increase the total to 30 beds while shifting capacity
186
from MSICU into the new L2 unit.
187
Each conguration of each scenario was simulated 200 times, using a one year
188
warm-up period followed by a one year data collection period. A dierent
ran-189
dom seed number was used for each run. Trial run times varied from 20 to 40
190
minutes using an Intel® Core i5-2400 CPU 3.10GHz 8GB RAM server.
191
4. Results
192
4.1. Model Validation
193
Our simulation model captures the individual physician's and nurse's
deci-194
sions to transfer or discharge individual patients via a macro approach, using
195
LOS distributions for each ward and a probabilistic transition matrix for each
196
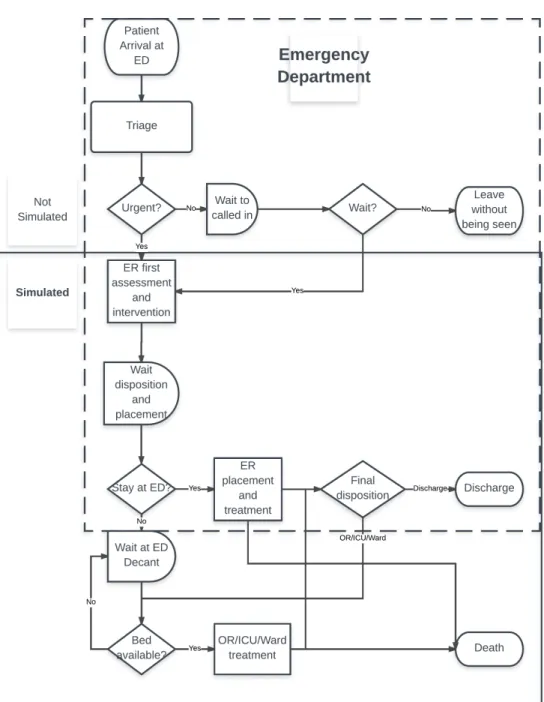
patient movement. To validate this approach, we compared patient arrival,
197
throughput, LOS and cost results from the baseline simulation with aggregate
4.2 Scenario 1: Capacity increase with a New L2 unit 12 empirical data and cost data from publicly available documents such as LHSC's
199
nancial statements LHSC [28] and the Canadian Institute for Health
Infor-200
mation yearly reportsCIHI [10]. The model is accurate in reproducing entry
201
data, MSICU LOS and cost data (Table 2). Average throughput is within 1%
202
of empirical data, while total LOS is within 0.4%. MSICU LOS is slightly
203
high (2.9%) but with a lower standard deviation, resulting in no statistically
204
signicant dierence compared to the empirical data. We concluded that the
205
simulation model is suciently valid to address the research questions. Results
206
for all scenarios are summarized in Table 4.
207
4.2. Scenario 1: Capacity increase with a New L2 unit
208
We evaluated the addition of extra beds in a general-purpose net new
ca-209
pacity step-down ward. We simulated a range of 2 to 20 L2 beds in a dedicated
210
unit immediately downstream from the MSICU and did not alter the capacity
211
of the MSICU (25 beds). We rst assessed the impact of the new capacity
212
on o-service utilization. In the base case (i.e. no new capacity), the existing
213
specialized Level 2 units (MOTP, CCU, NOBS) have a combined o-service
214
load of 573 patients/year. This value drops to 225 patients/year as we add L2
215
beds. In the base case, the Level 3 units (MSICU and CSRU) have a combined
216
o-service of 621 patients/year. As L2 beds are added, the o-service reduces
217
to approximately 110 patients/year, representing a reduction of 82%. This
re-218
duction may represent a signicant improvement in terms of patient care, as
219
approximately 500 more Level 3 patients are now able to be transferred to their
220
intended wards.
221
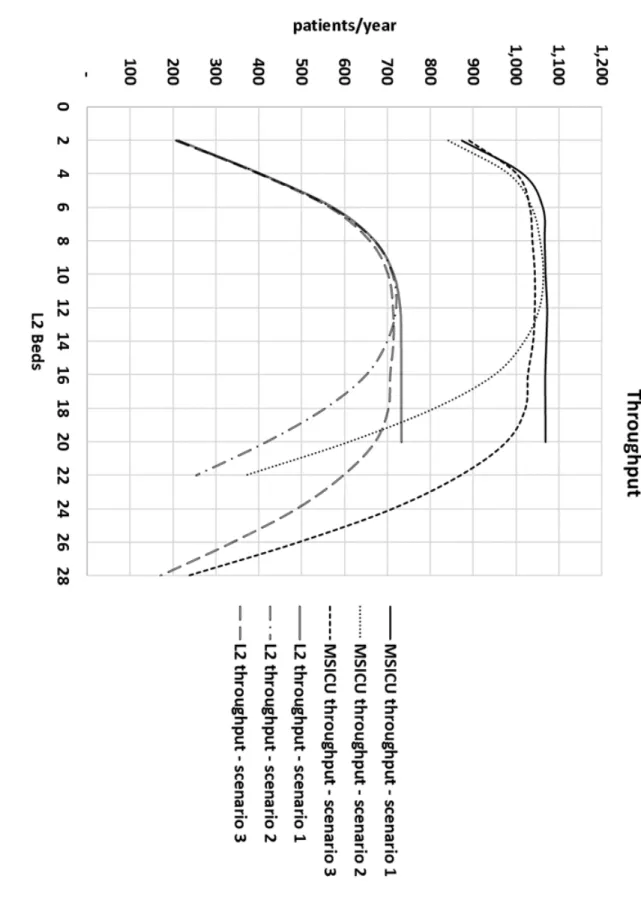
Next we evaluated the impact of the new L2 beds on throughput. The
ad-222
dition of an L2 unit increases MSICU throughput up until 8-10 new beds where
223
it stabilizes at approximately 1,068 patients/year (Figure 2). The L2 unit's
224
throughput grows until 12-14 beds are added, reaching 730-732 patients/year.
4.2 Scenario 1: Capacity increase with a New L2 unit 13 T able 2: Outp ut and Cost validation Indicator Sim ulation Empirical data Dierence -95% condence limit Av erage 95% condence limit Throughput (patien ts/y ear ) 17,128.05 17,194.00 17,159.95 17,380.00 -1.07% Av erage ov erall LOS (da ys/sta y) 6.84 6.87 6.90 6.90 (CIHI [10]) -0.40% Cost of hospital sta y $6,347.36 $6,345.41 $6,343.48 $6,123.00 (CIHI [10]) 3.63% Total op erational cost $108,717,845 $109,103,000 $109,488, 155 $106,417,740 (LHSC [28]) 2.52% MSICU Av erage LOS (hours) 162.12 164.24* 166.36 159.6* 2.91% MSICU Std De v of LOS (hours) 174.13 177. 96 181.80 201.8 -11.81% MSICU Long sta ys ( ≥ 504 hours) 5.53% 5.26% 4.90% 5% -0.27% *P value and statistical signicance:The tw o-tailed P value equals 0.5884 By con ven tional cr it er ia, this dierence is considered to b e not statistically signican t. The mean of sim ulation min us ra w input data equals 4.6400 Condence in terv al: 95% condence in terv al of this dieren ce: From -12.2025 to 21.4825 In te rme di at e values used in calculations: t = 0.5413 df = 1963 standard error of dierence = 8.572
4.2 Scenario 1: Capacity increase with a New L2 unit 14 Figure 2: MSICU and L2 throughput vs. num ber of New L2 beds add ed
4.3 Scenario 2: Capacity re-allocation 15 This suggests that until the L2 unit capacity reaches 12 beds, MSICU is still
226
hosting step-down ready patients but after that point there is little clinical
227
need for extra beds.
228
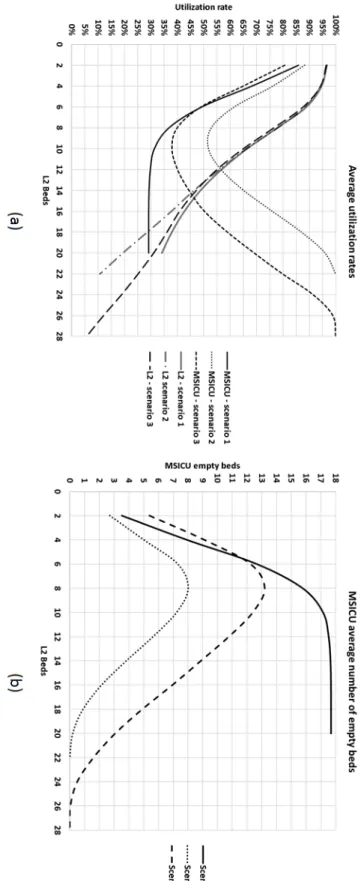
Utilization and LOS have a similar pattern (Figure 3). The MSICU has a
229
high initial utilization rate (above 85%) that drops dramatically as L2 capacity
230
is increased, eventually stabilizing around 29% at 12 beds. As L2 beds are
231
added, there is a rapid decline in MSICU LOS until we reach 12 beds, where
232
it stabilizes at approximately 59 hours (Figure 4). Moreover, the percentage of
233
patients who stay more than 21 days in the MSICU reduces to approximately
234
zero after 8 beds. This suggests that additional L2 capacity allows the MSICU
235
to return to its clinical role of intensive care.
236
Finally, we nd that a maximum of 29 total beds (MSICU and L2 beds
237
combined) are ever occupied, which exceeds MSICU's current capacity of 25
238
beds. This supports further investigation of increased capacity in MSICU in
239
Scenario 3 (Section 4.4).
240
4.3. Scenario 2: Capacity re-allocation
241
This scenario involves creating a new L2 unit, but rather than creating new
242
capacity, beds in the existing MSICU would be closed and reallocated to the L2
243
unit. This scenario would apply in case the hospital does not have additional
244
space to create a new L2 unit or budget for net new beds. O-service loads
245
are slightly higher than in Scenario 1. The minimum o-service load is reached
246
when there are 15 MSICU and 10 L2 beds, leading to total L3 o-service load
247
of 150 instances per year. This gure represents an improvement in terms of
248
patient care, as approximately 470 patients can now be transferred to their
249
intended wards. O-service performance then deteriorates as more beds are
250
shifted from MSICU to the L2 unit. MSICU becomes a bottleneck and upstream
251
units are forced to send o-service patients to CSRU. This situation represents
4.3 Scenario 2: Capacity re-allocation 16 Figure 3: MSICU and L2 av erage utilization rates
4.3 Scenario 2: Capacity re-allocation 17 Figure 4: MSICU av erage LOS
4.3 Scenario 2: Capacity re-allocation 18 a clear clinical mist, as CSRU is a cardiac surgery unit, where both nurses and
253
physicians are heavily specialized in cardiac care. The treatment of patients
254
intended for MSICU in CSRU could result in deterioration of patient care and
255
disruption of the cardiac surgery patient ow.
256
MSICU throughput improvements start when there are 4 beds reaching an
257
optimal value of 1,050 patients/year when there are 15 MSICU and 10 L2 beds
258
(Figure 2). The L2 unit reaches a peak throughput of 720 patient/year when
259
there are 13 MSICU and 12 L2 beds. This is similar to the maximum throughput
260
achieved when we evaluated net new capacity in Scenario 1. After that point,
261
as MSICU beds are converted into L2 beds, the smaller number of MSICU beds
262
becomes a bottleneck to upstream units such as the ED and OR. Patient ow
263
reduces signicantly and blockage becomes more frequent in those units due to
264
high utilization rates at MSICU. As the L2 unit is a dedicated downstream unit
265
of MSICU, its throughput is also reduced after 12 L2 beds.
266
MSICU LOS begins to improve after creating 4 L2 beds. The minimum LOS
267
of 60.66 h/patient occurs when there are 13 MSICU and 12 L2 beds, representing
268
a 63% improvement relative to the base case. As more capacity is shifted to L2
269
beds, the LOS rises back to the 70 h/patient mark. This reduction represents a
270
gain of at least 2,000 patient-days/year in the combined MSICU and L2 capacity.
271
This conrms our earlier nding in Scenario 1: a L2 unit provides opportunity
272
for MSICU to go back to its clinical role, with minimum overstay.
273
This result makes sense due to the drastic reduction in long-stay patients in
274
the MSICU (MSICU LOS above 21 days - Figure 5). Those patients often reach
275
a L2 NEMS, triggering their stepping-down into the New L2 unit. The result is
276
higher availability of MSICU beds (Figure 3 (b)) for patients originating from
277
upstream units, thus improving patient ow.
4.3 Scenario 2: Capacity re-allocation 19 Figure 5: MSICU Long-sta y patien ts
4.4 Scenario 3: New capacity and capacity reallocation 20 4.4. Scenario 3: New capacity and capacity reallocation
279
In this scenario we evaluated reallocation of beds along with net new capacity
280
of 5 beds. O-service loads are between the two previous scenarios, with lowest
281
values within a range of 20 to 16 MSICU beds. MSICU throughput is stable
282
at 1,050 patients/year anywhere from 20 to 16 beds reaching a peak of 1.063
283
patients/year (Figure 2), while L2 throughput is stable within the range of 10
284
to 18 beds, peaking at 720 patients/year. Therefore any mix from 20 MSICU
285
and 10 L2 beds to 12 MSICU and 18 L2 beds have comparable results with the
286
Scenario 2 while providing a stable combined throughput. MSICU utilization
287
rates are also signicantly lower than in the in Scenario 2, as seen in Figure 3.
288
With MSICU reaching a minimum slightly below 40% (20 MSICU and 10 L2)
289
and reaching a balanced utilization of approximately 45-47% at 16 MSICU and
290
14 L2 beds.
291
Any mix from 20 MSICU and 10 L2 beds to 12 MSICU and 18 L2 beds
292
yield approximately 60h LOS, similar of the previous scenarios (Figure 4). As
293
in previous analysis, the ability to step down long stay patients with low NEMS
294
plays an important role in improving patient ow (Figure 5).
295
4.5. Costs
296
In all three scenarios a signicant cost saving was possible relative to the
297
current cost of $3,500/patient-day in MSICU (Figure 6). Combined MSICU
298
and L2 costs decrease steadily in all scenarios until they reach a minimum of
299
$2,869.46/patient-day at 12 L2 beds under scenario 3. From that point on, under
300
all scenarios, costs escalate, but never reach the current baseline cost. This result
301
can be explained by two factors. First, L2 operational costs represent only 57%
302
of MSICU's. Initial increases in L2 capacity permit a timely step-down and
303
immediate savings occur. Second, after 12 L2 beds, the new L2 unit starts to
304
have idle capacity. This is due to lack of demand in Scenario 1 and to MSICU
4.6 Increased arrivals 21 constrained ow in Scenarios 2 and 3. Idle L2 beds carry high xed costs in the
306
form capital expenditure, thus forming the upward half of the curve.
307
4.6. Increased arrivals
308
By increasing throughput capacity, the hospital may receive more patients.
309
Thus, we simulated an increase in the inpatient ow from ED and OR to see
310
how well our optimal congurations stand a hypothetical surge in demand. For
311
Scenario 1, we focused on ED and OR, where inpatients spend relatively
lit-312
tle time waiting for their disposition from ED, or their scheduled surgeries in
313
OR1. A 10% increase in ED and OR demand, representing an extra 1,200 pa-314
tients/year, is enough to negate any gains achieved by the introduction of net
315
new L2 capacity (Table 3).
316
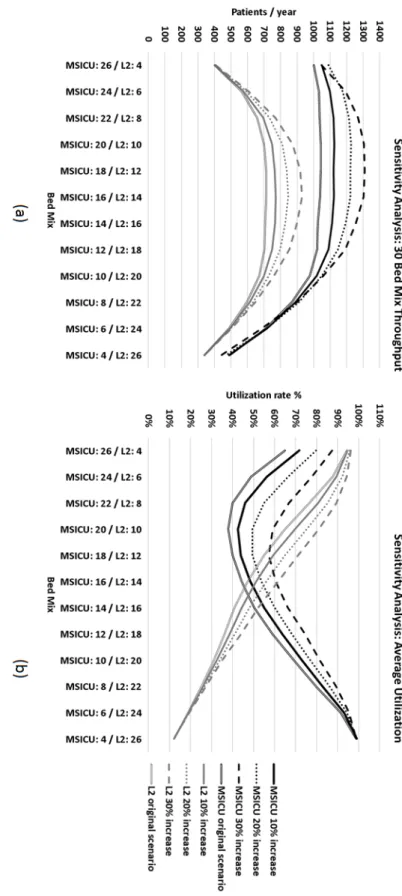
Next, we focused on MSICU performance in Scenario 3. The inpatient surge
317
is mostly absorbed by MSICU and L2, reaching maximums of 1,300 and 930
pa-318
tients/year respectively (Figure 7 (a)). There is a gradual shift in the optimum
319
bed mix to 16 MSICU and 14 L2 beds. Utilization rates increase accordingly,
320
reaching approximately 60% in the optimum throughput bed mix (Figure 7
321
(b)). MSICU LOS changes little with the increase in ED and OR demand
(Fig-322
ure 8(a)). At 30% increase in demand, MSICU LOS rises to approximately 65
323
hours/patient. In terms of LOS, the optimal conguration shifts slightly to 16
324
MSICU beds and 14 L2 beds. Thus, the increase in inpatient volume does aect
325
the values of MSICU patient ow indicators but the optimal solution is robust
326
to increased volumes.
327
Higher utilization in MSICU triggers congestion upstream. Particularly in
328
the ED, at the 30% demand increase, there is an increase of 317% in the use of
329
1This is not the wait time to enter the ED, as we simulated only inpatient ow. This wait
is for patient disposition, i.e. the moment the patient is ready to receive a decision to admit until the true admission and transfer to the intended location.
4.6 Increased arrivals 22 Figure 6: Com bined MSICU + L2 cost per patien t da y
4.6 Increased arrivals 23 T ab le 3: Sen sitivit y in Inp atient o w W ait for Disp osition ED Decan t Queue for W C OR Total LOS Scenario w ait (h) std (h) ≤ 5 min LOS (h) st d (LoS) ≤ 1 hour w ait (h ) std (h) ≤ 1 hour LOS std (h) Baseline 0.12 4.99 99% 1.27 7.95 90% 0.43 1.26 87% 164.93 212.83 25 MSICU and 12 L2 0.22 2.57 98% 2.07 6.33 84% 0.35 1.03 93% 162.69 196.77 5% increase 0.3 2.57 97% 2.08 6.35 82% 0.35 1.03 88% 163.69 194.67 10% increase 1. 13 6.34 94% 3.01 7.56 75% 0.75 1.69 79% 164.83 194.2 20% increase 2. 09 7.88 87% 3.22 7.36 69% 1.01 1.98 74% 165.2 194.3 30% increase 26.6 7 50.1 55% 5.26 8.96 52% 1.28 2.24 69% 173.25 189.65
4.6 Increased arrivals 24 Figure 7: Sensitivit y analysis -thro ughput and utilization
4.6 Increased arrivals 25 Figure 8: Sensitivit y A nalysis -LOS and Long sta ys
4.7 Management Feedback 26 temporary ED beds (the ED decant ward, with a capacity of 6 beds).
330
Combined MSICU and L2 patient-day costs remain similar even with a 30%
331
inpatient arrival increase (Figure 9 (a)), but the minimum shifts slightly from
332
18 MSICU beds and 12 L2 beds to 16 MSICU beds and 14 L2 beds. Figure 9 (b)
333
shows that Scenario 3 had a robust range in terms of total cost, with an
approx-334
imate value of $14.5 million/year for a range of 18 to 12 MSICU beds and 12
335
to 18 L2 beds. In the 30% demand increase, however, total cost is continuously
336
decreasing, with the optimal mix costing an extra $4.7 million/year, or 33.4%
337
more than Scenario 3. This a direct result of MSICU's diminishing capacity to
338
absorb the increased demand. However, even a 30% increase in ED and OR
339
volume in the optimal conguration is not enough to return total MSICU and
340
L2 cost to the level of the baseline scenario of $24 million, demonstrating the
341
impact the L2 unit has in UH's cost structure (Figure 9 (b)).
342
4.7. Management Feedback
343
Preliminary results from this analysis were presented to a team of managers
344
of LHSC in January 2017. The team consisted of the Vice President of Access
345
and Flow, the Director of Clinical Redesign, the Director of Critical Care, and
346
the City-wide Chair and Chief of Medicine, among others. Our research
con-347
rmed their intuition about the need for an L2 unit, but revealed unanticipated
348
ndings in terms of the L2 unit's ability to improve ow, reduce MSICU LOS
349
(63% from current levels) and reduce cost by approximately 40%.
Implementa-350
tion of the new L2 unit is likely to occur in the near future.
351
The managers in attendance stated that our model was the rst large scale
352
DES model to be used in UH. Our results led to questions about the need for
353
a clinical study about the MSICU long-stay population and their desired care
354
pathway, as well as about UH's capacity to deal with increased demand. They
355
concluded that our DES model provides support for further L2 capacity studies
4.7 Management Feedback 27 Figure 9: Sensitivit y An alysis -com bined MSICU and L2 cost per patien t da y
28 in other LHSC sites as well, such as Victoria Hospital's L2 clinical redesign.
357
5. Conclusions
358
We found that there are considerable performance gains to be made with the
359
addition of a step-down unit. In all scenarios, the optimal performance occurs
360
when there are approximately 12 L2 beds yielding MSICU LOS of approximately
361
60 hours/patient, a cost reduction of 18% per patient-day and 40% in total cost
362
per year (see Table 4).
363
It has been recognized for some time in health care simulation literature
364
that implementation does not necessarily follow the recommendations proposed
365
by researchers (Lane et al. [27], Bountourelis et al. [7], Brailsford et al. [8]).
366
Forsberg et al. [14] report that from 59 articles surveyed in the literature, only
367
14 mentioned implementation. Many reasons for this gap are possible, such as
368
lack of client involvement, lack of clear methodology and failure to communicate
369
results properly. To avoid such problems, we followed a general framework of
370
the methodology based on previous literature (Lane et al. [27], Bountourelis
371
et al. [7], Forsberg et al. [14]) and the best practices (Karnon et al. [21]). In
372
particular, stakeholders were involved right from the beginning of the study,
373
validating and providing input in every step of the research.
374
Our model has limitations. Our data represents only inpatient arrivals so
375
our model does not consider balking or reneging at any entry points. This means
376
that all ED and OR arrivals are admitted patients and must go through the
sys-377
tem. We use a simplied model of the ED and thus our model does not capture
378
ED congestion. However, we believe that this does not have signicant impact
379
on our analysis since ED arrivals that eventually visit MSICU are unlikely to
380
be turned down by UH due to their health status. Also, the
Death/Stay/Step-381
down routine has a minor drawback: once the patient is prevented from leaving
29 T able 4: Scenario comparison
Indicator
Baseline
Scenario
1
Scenario
2
Scenario
3
MSICU
capacit
y
(b
eds)
25
25
13
18
L2
Capacit
y
(b
eds)
0
12
12
12
Total
Capacit
y
(b
eds)
25
37
25
30
Mean
(b
eds)
19.1
14.4
14.32
14.29
Median
(b
eds)
19
14
14
14
Mo
de
(b
eds)
19
14
13
15
Max
(b
eds)
25
29
24
27
Std.
dev
(b
eds)
3.28
4.02
3.32
4.33
Av
erage
utilization
76.40%
38.92%
57.28%
47.63%
Max
utilization
100%
78.38%
96.00%
90.00%
Cum
ulativ
e
frequency
belo
w
75%
21
≈
17
≈
16
≈
17
Cum
ulativ
e
frequency
belo
w
95%
25
≈
25
≈
20
≈
21
LOS
in
M
SICU
(h)
164.24
60.37
60.66
60.06
Cost
CAD
$/patien
t-da
y
$3,477.44
$2,876.21
$2,873.83
$2,869.46
Total
Cost
MSICU+L2
CAD
$/y
ear
$24,019,830.00
$14,909
,503.75
$14,760,363.22
$14,503,103.34
30 MSICU due to blockage downstream, the patient has to wait for the next
morn-383
ing to have a new chance to leave the MSICU. In spite of this drawback, the
384
model validation found accurate MSICU LOS.
385
There are several directions for further research. First, we will explore
fur-386
ther the pooling eects that one might have from merging inpatient wards
387
and/or other specialized L2 units. These units are all highly congested and
388
susceptible to blockage, bounce-backs and grid-locks. Also, we modeled all
389
routing and discharge decisions between wards and other hospital units
proba-390
bilistically. An interesting avenue for future research would be to incorporate
391
decision rules for these occurrences. Second, we can use the data set to create
392
predictive models for LOS based on NEMS. These can then be used to create
393
dynamic stang models. Finally, we will develop an analytical model that
in-394
corporates MSICU's unique position in which it is squeezed between ED/OR's
395
eorts to minimize wait times and the wards eorts to avoid re-admissions. This
396
may involve a combination of queuing and game theory.
397
Glossary of Terms
398
ADT Admission/Discharge/Transfer temporary entry in pacient management
399
system
400
AIC Akaike information criterion
401
BIC Bayesian information criterion
402
CCU Coronary Care Unit
403
CSRU Cardiac-Surgical Intensive Care Unit
404
DES Discrete Event Simulation
405
ED Emergency Department
31 ICU Intensive Care Unit
407
ISPOR-SMDM International Society for Pharmacoeconomics and Outcomes
408
Research - Society for Medical Decision Making modeling good research
409
practices task force
410
L2 Level 2 unit
411
Level 2 Intermediary level of care, usually used as a step-dwon from an Intensive
412
Care Unit
413
LHSC London Health Sciences Centre
414
LOS Length of Stay
415
MOTP Multi-Organ Transplant Unit
416
MSICU Medical Surgical Intensive Care Unit
417
NEMS Nine Equivalents of Nursing Manpower Use Score
418
NOBS Neurological Observation Unit
419
OR Operating Room
420
UH University Hospital
421
AppendixA. Model design details
422
AppendixA.1. Overview
423
The Appendix contains a detailed explanations of the DES model (screenshot
424
in Figure A.10) and its input parameters.
AppendixA.1 Overview 32
AppendixA.1 Overview 33
AppendixA.2 ER and OR arrivals 34
Table A.5: Average number of scheduled surgery arrivals per working day
Hour Patients / hour
5 a.m. 2.8 6 a.m. 6.1 7 a.m. 1.3 8 a.m. 1.6 9 a.m. 2.3 10 a.m. 1.9 11 a.m. 0.9
AppendixA.2. ER and OR arrivals
426
We modeled seasonality in Emergency Department (ED) and Operating
427
Room (OR) arrivals. The OR performs both scheduled and emergency/unscheduled
428
surgeries. These unscheduled surgeries come from patients either in ED or in
429
other wards that require a surgical procedure and are then transferred to the
430
OR. After surgery they are transferred back to other units in the hospital
includ-431
ing MSICU. Unscheduled surgeries happen at any time of the day and any day
432
of the week. Because unscheduled surgeries are comprised of patients already
433
inside the hospital, we modeled the unscheduled surgeries as part of the
inpa-434
tient ow matrix so they are not part of the external inpatient arrival pattern
435
of the OR.
436
Scheduled surgeries are originated from outside of the hospital and have a
437
separate arrival pattern. They typically are scheduled between 5am and 11am
438
on weekdays. There was no signicant dierence between the months or days
439
of the week, but there was variation throughout the day (Table A.5).
440
ED arrivals had variation by day of the week and hour of the day. Our
441
simulation of the ED is simplied by not capturing ED waiting room congestion.
442
Instead, the process starts with the "ready for disposition" time, which is the
443
time when the rst assessment has been done and the patient is to be admitted
444
into one of the units of the hospital (Figure A.12).
AppendixA.2 ER and OR arrivals 35
AppendixA.3 UH structure and service time parameters 36 In our data set there were 8,793 ED inpatients with average daily arrivals
446
ranging from 21 on Sundays to 26 patients on Tuesdays. To avoid the possibility
447
of simulating no patients in a given hour, we divided the day into 4 parts: Late
448
night/Early morning (from 12am to 6am), Morning (6am to 12pm), Afternoon
449
(12pm to 6pm) and Evening (6pm to 12am). ED inpatients are then simulated
450
via Poisson process being sampled from the Table A.6.
451
AppendixA.3. UH structure and service time parameters
452
Ward capacities and service time parameters can be found in Table A.8.
453
AppendixA.4. Detailed MSICU simulation
454
The simulation model of the MSICU starts with a patient arrival from other
455
units (Figure A.14). Upon arrival, the patient receives a "Level 3" NEMS that
456
will represent her current status as a MSICU patient (Table A.9). We then
457
use a fork-join model and divide the patient into "physical" and "procedural"
458
entities. The "physical" entity occupies a bed in the MSICU to ensure that
459
MSICU capacity is not exceeded and that the appropriate queues form when
460
capacity is reached. The "procedural" entity goes to the Death/Stay/Step-down
461
process to model changes in health status and disposition from MSICU.
462
The rst part of the Death/Stay/Step-down process is a daily routine that
463
culminates in either death or survival. From our empirical data we built a
464
logarithmic regression to estimate the probability of death as a function of time
465
in MSICU (Figure A.13). We observed that no deaths occurred after 45 days, so
466
we truncated the function at that point. If the patient dies then the two entities
467
are joined and the patient exits the MSICU and exits the simulation. Thus,
468
MSICU LOS is a consequence of the patient's health progression over time, as
469
opposed to an exogenously generated parameter. If the patient survives, then
470
the "procedural" entity enters a NEMS scoring routine to sample a new NEMS.
AppendixA.4 Detailed MSICU simulation 37 T able A .6: ED inpatien t arriv als per da y of the w eek and time of the da y
Av
erage
arriv
als
per
6
hour
blo
ck
Time
Monda
y
Tuesda
y
W
ednesda
y
Th
ursda
y
Frida
y
Saturda
y
Sunda
y
00:00
to
06:00
5.9615
8.3461
6.9038
7.0385
7.0576
6.8845
6.077
06:00
to
12:00
3.25
3.0192
3.23
08
3.1923
2.5384
3.6732
2.8462
12:00
to
18:00
5.7884
6.3269
6.2116
6.2307
6.1347
5.077
5.6344
18:00
to
00:00
9.2307
8.7307
7.4232
8.8462
8.6346
7.6538
7.1539
total
24.2306
26.
4229
23.7694
25.3077
24.3653
23.
2885
21.7115
AppendixA.4 Detailed MSICU simulation 38 T ab le A.7: En try po in ts in ter -arriv al time distributions
Unit
In
ter-arriv
al
distribution
typ
e
P
arameter
(s),
in
hours
Clinic
Exp
one
ntial
22.17
OneConsult
Exp
onen
tial
8.2694
ADT
Exp
onen
tial
4.454
Victoria
Gamma
α
=
0.39314
;
θ
=
24.142
(
µ
=
9.491
;
σ
=
15.137)
ED
varies
by
da
y
of
the
w
eek
and
hour
of
the
da
y
(T
able
A.6)
OR
vari
es
by
hour
of
the
da
y
(T
able
A.5)
AppendixA.4 Detailed MSICU simulation 39
Table A.8: Ward capacities and service time parameters
Units T yp e N um ber of Beds Service time Distribution T yp e P arameters (s ) Mean, standard deviation (hours) Clinic en try poin t W eibull 1.402 ;3.539 3.225 ;2.331 OneConsult en try poin t Logno rm al 0.032 ;0.022 0.032 ;0. 022 ADT en try poin t Lognormal 0.040 ;0.032 0.040 ;0.032 Victoria Hospital en try po in t Gamm a 0.430 ;393.13 169.13 ;257. 86 Emergency Departmen t (ED) en try poin t / ED 40 stations Exp onen tial 11.694 11.694 ;11.694 Op erating Ro om (OR) en try poin t / OR 16 ro oms Gamma 3. 351 ;2.483 8.325 ;4. 547 Emergency departmen t Dec an t w ard 6 Lognormal 13.095 ;11.069 13.095 ;11.069 General Medicine (4th GM) w ard 72 Gam ma 1.143 ;107.47 122.91 ;114. 93 Cardiac W ard (5th Cardiac) w ard 20 Gamma 1.131 ;110 .49 125.02 ;117.53 A cute Care w ard 12 Gamma 1.383 ;85. 375 118.09 ;100.41 Cardiac/Cardio vascular Surgery (6th CVS) w ard 39 Gamma 1.374 ;84.163 115. 68 ;98.67 Clinical Neurosciences (7th Neuro) w ard 44 Lognormal 152.97 ;284.42 152.97 ;284.42 Hyp er A cute st rok e (7th Strok e) w ar d 5 Gamma 1.754 ;31.506 55.28 ;41.73 General Surgery ,Plastic, Uro and Gyn (8th GS) w ard 41 W eibull 0.967 ;110.88 112.39 ;115.90 High A cuit y Surgery (8th HAS) w ard 4 W eibull 1.281 ;74.959 69.43 ;54.59 Sub A cute Medic al (8th SAM) w ard 15 Gamma 1.136 ;3 72.69 423.41 ;397.24 P alliativ e Ca re (9th PC) w ard 60 Lognormal 117.09 ;178.76 117.09 ;178.7 6 Epilepsy (10th EP) w ard 11 Gamma 2.744 ;70.987 194.80 ;117.59 Multi-Organ Transplan t (MOTP) in termediary unit 12 Gamma 0.801 ;190.26 152.52 ;170.35 Coronary Care (CCU) in termediary unit 14 W eibull 1.331 ;79.456 73.04 ;55.38 Neurology Observ ation (NOBS) in terme di ary unit 6 Lognormal 62.806 ;95.381 62.806 ;95.381 Cardio vascular Surgery Reco very (CSR U) in tensiv e Care 15 Lognormal 57.325 ;71.966 57.33 ;71. 97 Medical Surgery In tensiv e Care (MSICU) in tensiv e Care 25 *sim ulated via Death/NEMS sto chastic ro uti ne Total Beds 401
AppendixA.4 Detailed MSICU simulation 40
AppendixA.4 Detailed MSICU simulation 41
Figure A.14: MSICU Death probability as a function of time. (*WC stands for Work Centre)
The score either stays as at "Level 3", or changes to "Level 2" or "Level 1".
472
In case of a "Level 3" NEMS, the procedural entity returns to the death process
473
to repeat the survival and NEMS routine, with updated survival probability
474
based on LOS (Figure A.13). In case of a Level 2 score, in the baseline scenario,
475
the patient still stays at the MSICU since there are no L2 beds available. In the
476
other scenarios, a "Level 2" NEMS will trigger the procedural entity to be joined
477
with its physical entity, exit the MSICU and move to a step-down unit. In the
478
case of a Level 1 NEMS, in both scenarios, the entities join and the patient is
479
transferred to a ward.
480
In case the patient is headed to a unit that is full or blocked, the
simula-481
tion forces the procedural entity to return to the death process and await the
482
next morning for new death odds and NEMS scoring. This procedure
guar-483
antees that every patient goes through the death/stay/step-down process once
484
every day inside MSICU . The process continues until a patient is able to move
485
downstream.
AppendixA.5 Capital expenditures estimates 42
Table A.9: NEMS probability NEMS Probability
Level 1 7%
Level 2 24%
Level 3 69%
Total 100%
Note that this captures the fact that a patient's health uctuates over time
487
and may improve or deteriorate. This model also allows for overstay patients
488
to have their health change due to congestion downstream and captures
sud-489
den deaths in the MSICU with a more detailed distribution than the one used
490
elsewhere in the hospital, reecting the high risk of the patient.
491
AppendixA.5. Capital expenditures estimates
492
Hospital stay cost data was retrieved from the Canadian Institute for Health
493
Information (CIHI [10]). Operational cost and capital expenditures were
ob-494
tained via consultation with LHSC Decision Support Sta and publicly available
495
nancial statements (LHSC [28]). Capital expenditures were linearly
extrapo-496
lated from estimates of 8 and 15 beds ($3 million and $5 million respectively)
497
and linearly depreciated over 10 years per Canadian accounting practice (Table
498
A.10).
499
AppendixA.6. Model validation
500
In the one year period of the data set, there were in total N = 17,380 inpatient
501
arrivals, while our simulation averages 17,350, well within the 95% condence
502
intervals (Table A.11).
503
504
[1] Akaike, H., 1974. A new look at the statistical model identication. IEEE
505
Transactions on Automatic Control 19 (6), 716723.
AppendixA.6 Model validation 43
Table A.10: Level 2 unit capital expenditure estimates
Number of beds Yearly capital expenditure Expenditure/bed
2 $128,571 $64,285.71 4 $185,714 $46,428.57 6 $242,857 $40,476.19 8 $300,000 $37,500.00 10 $357,143 $35,714.29 12 $414,286 $34,523.81 14 $471,429 $33,673.47 15 $500,000 $33,333.33 16 $528,571 $33,035.71 18 $585,714 $32,539.68 20 $642,857 $32,142.86 22 $700,000 $31,818.18 24 $757,143 $31,547.62 26 $814,286 $31,318.68
[2] Almashra, A., Vanderbloemen, L., 2016. Quantifying the eect of
compli-507
cations on patient ow, costs and surgical throughputs. BMC MEDICAL
508
INFORMATICS AND DECISION MAKING 16 (1), 115.
509
[3] Anderson, D., Golden, B., Jank, W., Wasil, E., 2012. The impact of hospital
510
utilization on patient readmission rate. Health Care Management Science
511
15 (1), 2936.
512
URL http://dx.doi.org/10.1007/s10729-011-9178-3
513
[4] Anderson, D., Price, C., Golden, B., Jank, W., Wasil, E., 2011. Examining
514
the discharge practices of surgeons at a large medical center. Health Care
515
Management Science 14 (4), 338347.
516
[5] Banks, J., 2005. Discrete-event system simulation, 4th Edition. Pearson
517
Prentice Hall, Upper Saddle River, N.J.
518
[6] Batchelor, A. M., 2013. United Kingdom: Where Have We Been?, 2013th
AppendixA.6 Model validation 44 T ab le A.11: Inpatien t arriv al validation Sim ulation Results Sim ulation Ob ject -95% av erage 95% Observ ed data E rror Emergency Departmen t 8,760.48 8,794.50 8,828.52 8,79 3 0.02% ADT 1,940.53 1,9 55.13 1,969.73 1,963 -0.40% OneConsult 1,047.00 1,054.83 1,062.66 1,058 -0.30% Clinic 266.05 271.37 276.68 275 -1 .32% Victoria Hospital 920.56 935 .53 950.50 927 0.92% Op erating Ro om sc heduled surgeries 4,308.84 4,338.93 4,369.03 4,364 Total 17,243.47 17,350. 30 17,457.13 17,380 -0.17%
AppendixA.6 Model validation 45 Edition. Vol. 9781461438663. Springer New York, New York, NY, pp. 89
520
96.
521
[7] Bountourelis, T., Ulukus, M., Kharoufeh, J., Nabors, S., 2013. The
mod-522
eling, analysis, and management of intensive care units. In: Denton, B. T.
523
(Ed.), Handbook of Healthcare Operations Management. Vol. 184 of
Inter-524
national Series in Operations Research & Management Science. Springer
525
New York, pp. 153182.
526
[8] Brailsford, S. C., Harper, P. R., Patel, B., Pitt, M., 2009. An analysis of
527
the academic literature on simulation and modelling in health care. Journal
528
of Simulation 3, 130140.
529
[9] Bretthauer, K. M., Heese, H. S., Pun, H., Coe, E., 2011. Blocking in
health-530
care operations: A new heuristic and an application. Production and
Op-531
erations Management 20 (3), 375391.
532
URL http://dx.doi.org/10.1111/j.1937-5956.2011.01230.x
533
[10] CIHI, 2015. Canadian institute for health information.
534
http://yourhealthsystem.cihi.ca.
535
URL http://yourhealthsystem.cihi.ca
536
[11] Dobson, G., Lee, H.-H., Pinker, E., 2010. A model of icu bumping.
Opera-537
tions Research 58 (6), 15641576.
538
[12] Doig, C. J., 2013. Canada: Where Have We Been?, 2013th Edition. Vol.
539
9781461438663. Springer New York, New York, NY, pp. 1724.
540
[13] Duguay, C., Chetouane, F., 2007. Modeling and improving emergency
de-541
partment systems using discrete event simulation. SIMULATION 83 (4),
542
311320.
543
URL http://sim.sagepub.com/content/83/4/311.abstract
AppendixA.6 Model validation 46 [14] Forsberg, H. H., Aronsson, H., Keller, C., Lindblad, S., 2011. Managing
545
health care decisions and improvement through simulation modeling.
Qual-546
ity Management in Health Care 20(1), 1529.
547
[15] Green, L., 2006. Queueing analysis in healthcare. In: Hall, R. W. (Ed.),
548
Patient Flow: Reducing Delay in Healthcare Delivery. Vol. 91 of
Interna-549
tional Series in Operations Research & Management Science. Springer US,
550
pp. 281307.
551
[16] Green, L. V., Soares, J., Giglio, J. F., Green, R. A., 2006. Using
queue-552
ing theory to increase the eectiveness of emergency department provider
553
stang. Academic Emergency Medicine 13 (1), 6168.
554
URL http://dx.doi.org/10.1197/j.aem.2005.07.034
555
[17] Halpern, N. A., Pastores, S. M., 2010. Critical care medicine in the united
556
states 2000-2005: An analysis of bed numbers, occupancy rates, payer mix,
557
and costs. Critical Care Medicine 38, 6571.
558
[18] Harper, P. R. & Shahani, A. K., 2002. Modelling for the planning and
559
management of bed capacities in hospitals. The Journal of the Operational
560
Research Society 53, 1118.
561
[19] Hastie, T., Tibshirani, R., Friedman, J. H., 2009. The elements of statistical
562
learning: data mining, inference, and prediction, 2nd Edition. Springer,
563
New York.
564
[20] Hoyt, J. W., 2013. United States - Private Practice: Where Have We Been?,
565
2013th Edition. Vol. 9781461438663. Springer New York, New York, NY,
566
pp. 97100.
567
[21] Karnon, J., Stahl, J., Brennan, A., Caro, J. J., Mar, J., Moller, J., 2012.
568
Modeling using discrete event simulation: A report of the ispor-smdm
AppendixA.6 Model validation 47 eling good research practices task force 4. Medical Decision Making 32 (5),
570
701711.
571
[22] KC, D. S., Terwiesch, C., 2012. An econometric analysis of patient ows
572
in the cardiac intensive care unit. Manufacturing & Service Operations
573
Management 14 (1), 5065.
574
URL http://pubsonline.informs.org/doi/abs/10.1287/msom.1110.0341
575
[23] Khare, R. K., Powell, E. S., Reinhardt, G., Lucenti, M., 2009. Adding more
576
beds to the emergency department or reducing admitted patient boarding
577
times: Which has a more signicant inuence on emergency department
578
congestion? Annals of Emergency Medicine 53 (5), 575 585.e2.
579
[24] Kolker, A., 2009. Process modeling of icu patient ow: Eect of daily load
580
leveling of elective surgeries on icu diversion. Journal of Medical Systems
581
33 (1), 2740.
582
[25] Konrad, R., DeSotto, K., Grocela, A., McAuley, P., Wang, J., Lyons, J.,
583
Bruin, M., 2013. Modeling the impact of changing patient ow processes
584
in an emergency department: Insights from a computer simulation study.
585
Operations Research for Health Care 2 (4), 66 74.
586
[26] Lakshmi C., Appa Iyer, S., 2013. Application of queueing theory in health
587
care: A literature review. Operations Research for Health Care 2, 25 39.
588
[27] Lane, D. C., Monefeldt, C., Husemann, E., 2003. Client involvement in
589
simulation model building: Hints and insights from a case study in a london
590
hospital. Health Care Management Science 6 (2), 105116.
591
[28] LHSC, 2015. Financial statement 2015. online.
592
URL http://www.lhsc.on.ca
AppendixA.6 Model validation 48 [29] LHSC, 2016. London health sciences centre facts and stats.
594
URL www.lhsc.on.ca
595
[30] Marmor, Y., Rohleder, T., Cook, D., Huschka, T., Thompson, J., 2013.
596
Recovery bed planning in cardiovascular surgery: a simulation case study.
597
Health Care Management Science 16, 314327.
598
[31] Mielczarek, B., Uzialko-Mydlikowska, J., 2012. Application of computer
599
simulation modeling in the health care sector: a survey. SIMULATION
600
88 (2), 197216.
601
[32] Miranda, R. D., Moreno, R., Iapichino, G., 1997. Nine equivalents of
nurs-602
ing manpower use score (nems). Intensive Care Medicine 23 (7), 760765.
603
URL http://dx.doi.org/10.1007/s001340050406
604
[33] Mohiuddin, S., Busby, J., Savovi¢, J., Richards, A., Northstone, K.,
605
Hollingworth, W., Donovan, J. L., Vasilakis, C., 2017. Patient ow within
606
uk emergency departments: a systematic review of the use of computer
607
simulation modelling methods. BMJ Open 7 (5).
608
URL http://bmjopen.bmj.com/content/7/5/e015007
609
[34] NCHS, 2015. Health, united states, 2015.
610
https://www.cdc.gov/nchs/data/hus/hus15.pdf.
611
URL https://www.cdc.gov/nchs/data/hus/hus15.pdf
612
[35] Noghani Ardestani, P., 2014. Modeling community care services for
613
alternative level of care (alc) patients: A queuing network approach.
614
mathesis, Systems Science - University of Ottawa, Canada.
615
URL http://search.proquest.com/docview/1520515966?accountid=15115
616
[36] Noseworthy, T. W., Konopad, E., Shustack, A., Johnston, R., Grace, M.
AppendixA.6 Model validation 49 P. E., 1996. Cost accounting of adult intensive care: Methods and human
618
and capital inputs. Critical Care Medicine 24 (7), 11681172.
619
[37] Osorio, C., Bierlaire, M., 2009. An analytic nite capacity queueing
620
network model capturing the propagation of congestion and blocking.
621
European Journal of Operational Research 196 (3), 996 1007.
622
URL http://www.sciencedirect.com/science/article/pii/S0377221708003871
623
[38] Rau, C.-L., Tsai, P.-F., Liang, S.-F., Tan, J.-C., Syu, H.-C., Jheng, Y.-L.,
624
Ciou, T.-S., Jaw, F.-S., 2013. Using discrete-event simulation in strategic
625
capacity planning for an outpatient physical therapy service. Health Care
626
Management Science 16 (4), 352365.
627
URL http://dx.doi.org/10.1007/s10729-013-9234-2
628
[39] Ridge, J., Jones, S., Nielsen, M., Shahani, A., 1998. Capacity planning for
629
intensive care units. European Journal of Operational Research 105 (2),
630
346 355.
631
URL http://www.sciencedirect.com/science/article/pii/S0377221797002403
632
[40] Rohleder, T. R., Bischak, D. P., Baskin, L. B., 2007. Modeling patient
633
service centers with simulation and system dynamics. Health Care
Man-634
agement Science 10 (1), 112.
635
URL http://dx.doi.org/10.1007/s10729-006-9001-8
636
[41] Salleh, S., Thokala, P., Brennan, A., Hughes, R., Booth, A., Sep 2017.
637
Simulation modelling in healthcare: An umbrella review of systematic
lit-638
erature reviews. PharmacoEconomics 35 (9), 937949.
639
URL https://doi.org/10.1007/s40273-017-0523-3
640
[42] Schwarz, G., 03 1978. Estimating the dimension of a model. Ann. Statist.
641
6 (2), 461464.
642
URL http://dx.doi.org/10.1214/aos/1176344136
AppendixA.6 Model validation 50 [43] Seung-Chul, K., Ira, H., K, Y. K., A, B. T., 2000. Flexible bed allocation
644
and performance in the intensive care unit. Journal of Operations
Man-645
agement 18 (4), 427 443.
646
URL http://www.sciencedirect.com/science/article/pii/S0272696300000279
647
[44] Shahani, A. K., Ridley, S. A., Nielsen, M. S., 2008. Modelling patient ows
648
as an aid to decision making for critical care capacities and organisation.
649
Anaesthesia 63 (10), 10741080.
650
URL http://dx.doi.org/10.1111/j.1365-2044.2008.05577.x
651
[45] Shukla, N., Lahiri, S., Ceglarek, D., 2015. Pathway variation analysis (pva):
652
Modelling and simulations. Operations Research for Health Care 6, 61 77.
653
URL http://www.sciencedirect.com/science/article/pii/S2211692315300072
654
[46] Van Berkel, P. T., Blake, J. T., 2007. A comprehensive simulation for wait
655
time reduction and capacity planning applied in general surgery. Health
656
Care Management Science 10 (4), 373385.
657
URL http://dx.doi.org/10.1007/s10729-007-9035-6
658
[47] Zonderland, M. E., Boucherie, R. J., Carter, M. W., Stanford, D. A., 2015.
659
Modeling the eect of short stay units on patient admissions. Operations
660
Research for Health Care 5, 21 27.
661
URL http://www.sciencedirect.com/science/article/pii/S2211692315000168