1ST CAMBRIDGE ACADEMIC DESIGN MANAGEMENT CONFERENCE, 7 – 8 SEPTEMBER 2011
Page 1 of 14
A Role-Based Design Performance
Measurement Matrix for Improving Design
Performance
1
Yuanyuan Yin, 2Shengfeng Qin, 2Ray Holland
Winchester School of Art, University of Southampton School of Engineering and Design, Brunel University [email protected]
Keywords: design performance measurement, design team roles
This paper describes an investigation of a role-based Design Performance Measurement (DPM) matrix that incorporates design performance measures with three design team role-players: the top design manager, the middle design manager and the designer. Based on the author’s previous research, a DPM matrix combining 25 criteria was developed to support DPM operation during a design process. A questionnaire survey was conducted to establish if different design team members would have diverse perceptions of the importance of 25 DPM criteria for the three types of design team roles. As a result, a role-based DPM matrix was developed, which demonstrated that the ‘clear team goal’ criterion should be regarded as the most important measure for the assessment of top design manager; the ‘problem solving’, ‘delivering to the brief’, ‘managing mistakes’, ‘build high morale within team’, ‘monitor team performance’
and ‘define design responsibilities’ for the middle design manager; the ‘high quality
product design’ and ‘adding perceived value to the design work’ for the designer.
Furthermore, a based DPM matrix application was developed that enables the role-based DPM matrix to be flexibly implemented in different design projects by matching a project’s features from three perspective: a design project strategies-based perspective, a stage-based design objectives perspective, and from a design staff role-based perspective.
INTRODUCTION
Design management is increasingly regarded as an important concept in the design industry, emphasizing the need for certain managerial activities and skills to optimize the design process and improve design performance (Chiva & Alegre, 2009). With the rapid growth of
Page 2 of 14
global competition, design process is becoming more and more complex, due largely to cross-functional team collaboration, dynamic design processes, and unpredictable design outcomes (Shen et al, 2008; Brookes and Backhous, 1998). Due to such complexity, many design management studies concentrated on supporting and improving design efficiency and effectiveness during a design process (Naveh 2005; Hull, 2004; Hertenstein et al, 2001). Among these studies, many researchers have stressed the potential benefits of appraisal in design project performance, such as motivating design staff to achieve a positive business outcome, supporting decision-making, fostering organisational learning and continuous improvement (Chiesa et al, 2009; Busseri & Palmer, 2000). Furthermore, the significance of appropriate design performance measures in the success of design projects has been particularly highlighted (Carbonell-Foulquié et al, 2004). Therefore, a number of Design Performance Measurement (DPM) criteria have been identified and investigated from diverse perspectives to support DPM operation (Moultrie et al, 2007). Although the contributions of the identified DPM criteria studies are notable, few of them have considered the influence of team-roles on performance measurement criteria design. A great deal of research has emphasised the importance of role theory in project management, and suggests that the features of team-roles should be utilized as the basis for job descriptions, as well as for specifying project expectations, performance requirements, and measurement (Van Dyne et al, 1995; Ilgen & Hollenbeck, 1992). Despite this recognition of the importance of team-roles, and the fact that employees choose to perform multiple roles in their design teams, research has continued to measure design performance as if only single roles apply. As a result, by relying on the evaluation of only those work behaviours defined by an organisation as relating to a specific job, performance systems may exhibit deficiencies (Welbourne et al, 1998). Bourne et al (2000) point out that, to correct this measurement error, performance management systems need to account for multiple roles at work. Thus, there is a significant need to incorporate the concept of the team-role into a theory of DPM, so as to improve the accuracy of design performance results.
RESEARCH AIM
The study presented in this paper, based on the authors’ previous research (Yin et al, 2011). It focused on the impact of diverse design team-roles on the design of DPM criteria. More specifically, in our previous research, a DPM matrix (Table 1) was established for key performance criteria, and this can be used for measuring design performance during a design process. 25 DPM criteria, which address five DPM indicators (efficiency, effectiveness, collaboration, management skill, and innovation) have been highlighted as the most critical factors for design performance measurement. Following the indicated suggestions of a possible significant impact from team-roles on DPM operation, the present study aims to develop a role-based DPM matrix, which can support design managers in improving the accuracy of performance measurement outcomes, by linking DPM criteria with three identifiable team-roles in a design team: those of the top manager, the middle manager, and the designer. These three roles were selected because they were broadly agreed to be the
Page 3 of 14
essential components of design project teams, both in the design industry and in academia (Prasad, 1996; Bullinger et al, 1994). In this study, design was interpreted as an integrated product design and development process, which involves many participants from different disciplines and requires team members with varied knowledge and experience to work together (Adopt from Girard & Robin, 2006). In practice, the research concentrated on measuring and improving design performance from a project-level perspective.
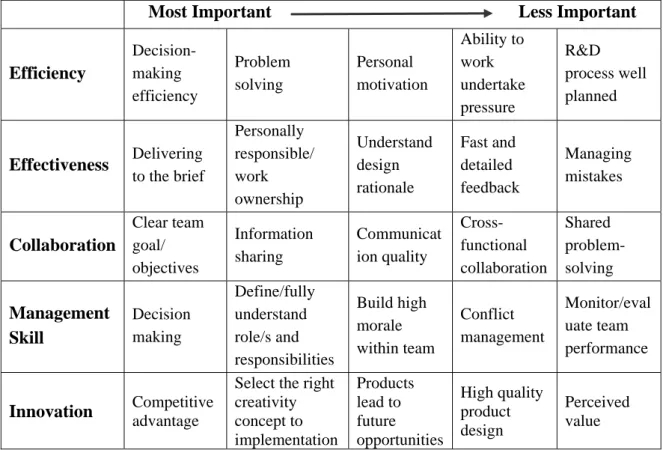
Table 1: Design Performance Measurement Matrix
Most Important Less Important
Efficiency Decision-making efficiency Problem solving Personal motivation Ability to work undertake pressure R&D process well planned Effectiveness Delivering to the brief Personally responsible/ work ownership Understand design rationale Fast and detailed feedback Managing mistakes Collaboration Clear team goal/ objectives Information sharing Communicat ion quality Cross-functional collaboration Shared problem-solving Management Skill Decision making Define/fully understand role/s and responsibilities Build high morale within team Conflict management Monitor/eval uate team performance Innovation Competitive advantage
Select the right creativity concept to implementation Products lead to future opportunities High quality product design Perceived value
LITERATURE REVIEW
Design performance measurement
In the design management research field, many researchers have emphasised the potential benefits of DPM on design projects and concentrated on improving design performance by operating performance measurement activities (Mallick et al., 2005; Bryant et al., 2004; Huang et al., 2003). Implementing appropriate performance measurement has many advantages, such as motivating people, supporting decision-making, fostering organisational learning and continuous improvement (Neely et al, 2005). Additionally, performance measurement can be operated to influence project staff’s behaviour to achieve a positive business outcome. For these reasons, many companies have spent considerable time and resources redesigning and implementing performance measurement positively to reflect their current environment and strategies (Kennerley & Neely, 2003).
Page 4 of 14
With the intention of developing a successful DPM method, many researchers have focused on investigations of DPM criteria, because well-defined criteria ensure an understanding of the intent and expectations of design tasks, and increase the quality of team communication in the design process (Hart et al, 2003; Suomala & Jokioinen, 2001). These studies can be divided into two categories: product-focused DPM criteria; and project-focused DPM criteria (O’Donnell and Duffy, 2002). The former concentrate on exploring key factors of success and failure in New Product Development (NPD) and essential DPM criteria, such as market share, investment return rate, and customer feedback (Loch et al, 1996); and the latter focus on an investigation of efficiency and effectiveness-based, planning-based and product life-cycle duration-based measurement (Buganza &Verganti, 2006; Kušar, 2004; Salter & Torbett, 2003; Nachum, 1999). Although the contributions of these existing DPM criteria studies are notable, few of them have considered the influence of team-roles on design performance measurement.
Design team roles
Role theory has been well discussed in psychology, social psychology, sociology, organization behaviour, and human resource management research fields (Willcocks, 2006; Welbourne et al, 1998). Related researchers from these various fields have concluded that roles play an important part in social structure, and roles have been recognized as central to understanding and appraising employee behaviour in organizations (Partington & Harris, 1999; Fondas & Stewart, 1994). Especially in the performance measurement research area, a great deal of research has highlighted the influence of role theory on performance measurement operation. For instance, Welbourne et al (1998) have emphasized that an important contribution of role theory to performance management was its ability to provide direction for avoiding measurement errors in performance appraisal tools. Consequently, role theory recommends that the design of performance measurement criteria should consider differences in organizational requirements of specific job-roles (Blenkinsop & Maddison, 2007).
In a design project team, there are three essential team roles: the top design manager, the middle design manager and the designer (Prasad, 1998). These roles have various responsibilities and work focuses during a design project development process. Cooper & Press (1995) summarised the key duties of these three design team roles from multiple perspectives such as strategy; policy; programmes and procedures; people; structure; culture; and climate. For example, top design managers are responsible for providing direction, in terms of the programmes to be followed, in order to achieve strategic goals. The middle design manager’s responsibilities involve setting design objectives for corporate communications, product and environments, having them approved by senior management, then developing strategies for achieving those objectives. Finally, designers at the design activity level can contribute to the project by setting up all procedures related to management control of design jobs, understanding the design needs of consumers, enabling the development of design objectives and strategies that are relevant and flexible, and responding
Page 5 of 14
to changes in the market place and in design trends. These variations in responsibility between the three design team-roles make it very clear that their design performance should be measured against their team-role responsibilities and based on customized DPM criteria rather than generic and uniform measures. Therefore, this study aims to explore a role-based DPM criteria matrix that can match different design team-role responsibilities in turn, to produce more precise DPM results. Practically, based on our previously develop DPM matrix, this study explored 1) if there is a need to differentiate the importance of the 25 DPM criteria for different DPM users, and 2) relationships between the three design team roles and the 25 DPM criteria.
METHODOLOGY
In order to explore the identified research questions, a questionnaire survey was conducted with design managers and designers from industry. More specifically, 30 questions were designed to explore participants’ opinions about the importance of 25 DPM criteria for each of the three design team roles. Four close-ended questions were designed to understand participants’ background, 25 ranking questions were designed to classify the priorities of 25 DPM criteria for the three role players, and one open-ended question was designed to collect participant’s suggestions and comments for this study. In addition, in the 25 close-ended classification questions, the participants were asked to rank the importance of the 25 DPM criteria with 1, 2, and 3 for the three design project team role players, where 1 denoted less important and 3 very important. A pilot study was then conducted with four participants to test and improve the questionnaire design. After the pilot study, the questionnaire survey was conducted via email, using contact details from web-based design company and research institute directories. 200 invitation emails were sent out, and 40 valid feedbacks were received, which comprised 14 from designers, 13 from middle design managers, and 13 from top design managers.
Among the 40 participants, 52.50% were working in design consultancies, and 47.50% were working in product design companies when they answered the questionnaire survey. Additionally, 40% of them focused on industrial design, 20% respondents concentrated on design management, 17.50% focused on design strategy, 15% focused on design research and the other 7.50% concentrated on engineering design.
FINDINGS
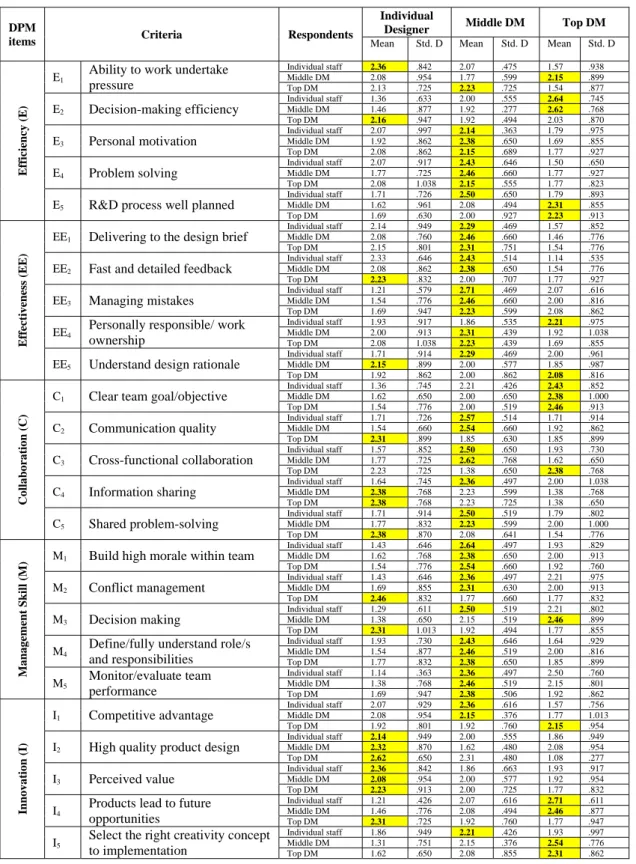
Based on the results of the questionnaire survey, Table 2 summarises feedback from the participants. Table 3 simplifies Table 2 in order to highlight the key results.
Page 6 of 14
Table 2 DPM results from different design project role players
DPM
items Criteria Respondents Individual
Designer Middle DM Top DM Mean Std. D Mean Std. D Mean Std. D
Efficiency (E)
E1
Ability to work undertake pressure Individual staff 2.36 .842 2.07 .475 1.57 .938 Middle DM 2.08 .954 1.77 .599 2.15 .899 Top DM 2.13 .725 2.23 .725 1.54 .877 E2 Decision-making efficiency Individual staff 1.36 .633 2.00 .555 2.64 .745 Middle DM 1.46 .877 1.92 .277 2.62 .768 Top DM 2.16 .947 1.92 .494 2.03 .870 E3 Personal motivation Individual staff 2.07 .997 2.14 .363 1.79 .975 Middle DM 1.92 .862 2.38 .650 1.69 .855 Top DM 2.08 .862 2.15 .689 1.77 .927 E4 Problem solving Individual staff 2.07 .917 2.43 .646 1.50 .650 Middle DM 1.77 .725 2.46 .660 1.77 .927 Top DM 2.08 1.038 2.15 .555 1.77 .823
E5 R&D process well planned
Individual staff 1.71 .726 2.50 .650 1.79 .893 Middle DM 1.62 .961 2.08 .494 2.31 .855 Top DM 1.69 .630 2.00 .927 2.23 .913 Effect iveness (EE )
EE1 Delivering to the design brief
Individual staff 2.14 .949 2.29 .469 1.57 .852 Middle DM 2.08 .760 2.46 .660 1.46 .776 Top DM 2.15 .801 2.31 .751 1.54 .776
EE2 Fast and detailed feedback
Individual staff 2.33 .646 2.43 .514 1.14 .535 Middle DM 2.08 .862 2.38 .650 1.54 .776 Top DM 2.23 .832 2.00 .707 1.77 .927 EE3 Managing mistakes Individual staff 1.21 .579 2.71 .469 2.07 .616 Middle DM 1.54 .776 2.46 .660 2.00 .816 Top DM 1.69 .947 2.23 .599 2.08 .862 EE4
Personally responsible/ work ownership
Individual staff 1.93 .917 1.86 .535 2.21 .975 Middle DM 2.00 .913 2.31 .439 1.92 1.038 Top DM 2.08 1.038 2.23 .439 1.69 .855
EE5 Understand design rationale
Individual staff 1.71 .914 2.29 .469 2.00 .961 Middle DM 2.15 .899 2.00 .577 1.85 .987 Top DM 1.92 .862 2.00 .862 2.08 .816 Co lla bo ra tio n (C)
C1 Clear team goal/objective
Individual staff 1.36 .745 2.21 .426 2.43 .852 Middle DM 1.62 .650 2.00 .650 2.38 1.000 Top DM 1.54 .776 2.00 .519 2.46 .913 C2 Communication quality Individual staff 1.71 .726 2.57 .514 1.71 .914 Middle DM 1.54 .660 2.54 .660 1.92 .862 Top DM 2.31 .899 1.85 .630 1.85 .899 C3 Cross-functional collaboration Individual staff 1.57 .852 2.50 .650 1.93 .730 Middle DM 1.77 .725 2.62 .768 1.62 .650 Top DM 2.23 .725 1.38 .650 2.38 .768 C4 Information sharing Individual staff 1.64 .745 2.36 .497 2.00 1.038 Middle DM 2.38 .768 2.23 .599 1.38 .768 Top DM 2.38 .768 2.23 .725 1.38 .650 C5 Shared problem-solving Individual staff 1.71 .914 2.50 .519 1.79 .802 Middle DM 1.77 .832 2.23 .599 2.00 1.000 Top DM 2.38 .870 2.08 .641 1.54 .776 Management Skil l (M)
M1 Build high morale within team
Individual staff 1.43 .646 2.64 .497 1.93 .829 Middle DM 1.62 .768 2.38 .650 2.00 .913 Top DM 1.54 .776 2.54 .660 1.92 .760 M2 Conflict management Individual staff 1.43 .646 2.36 .497 2.21 .975 Middle DM 1.69 .855 2.31 .630 2.00 .913 Top DM 2.46 .832 1.77 .660 1.77 .832 M3 Decision making Individual staff 1.29 .611 2.50 .519 2.21 .802 Middle DM 1.38 .650 2.15 .519 2.46 .899 Top DM 2.31 1.013 1.92 .494 1.77 .855
M4 Define/fully understand role/s and responsibilities Individual staff 1.93 .730 2.43 .646 1.64 .929 Middle DM 1.54 .877 2.46 .519 2.00 .816 Top DM 1.77 .832 2.38 .650 1.85 .899 M5 Monitor/evaluate team performance Individual staff 1.14 .363 2.36 .497 2.50 .760 Middle DM 1.38 .768 2.46 .519 2.15 .801 Top DM 1.69 .947 2.38 .506 1.92 .862 Innovat ion ( I) I1 Competitive advantage Individual staff 2.07 .929 2.36 .616 1.57 .756 Middle DM 2.08 .954 2.15 .376 1.77 1.013 Top DM 1.92 .801 1.92 .760 2.15 .954
I2 High quality product design
Individual staff 2.14 .949 2.00 .555 1.86 .949 Middle DM 2.32 .870 1.62 .480 2.08 .954 Top DM 2.62 .650 2.31 .480 1.08 .277 I3 Perceived value Individual staff 2.36 .842 1.86 .663 1.93 .917 Middle DM 2.08 .954 2.00 .577 1.92 .954 Top DM 2.23 .913 2.00 .725 1.77 .832 I4
Products lead to future opportunities
Individual staff 1.21 .426 2.07 .616 2.71 .611 Middle DM 1.46 .776 2.08 .494 2.46 .877 Top DM 2.31 .725 1.92 .760 1.77 .947
I5
Select the right creativity concept to implementation
Individual staff 1.86 .949 2.21 .426 1.93 .997 Middle DM 1.31 .751 2.15 .376 2.54 .776 Top DM 1.62 .650 2.08 .855 2.31 .862
As shown in Table 3, the three design team role players shared some common opinions. For example, they thought that delivering to the design brief was more important for the middle design manager in comparison with the other two roles. In contrast, they also had opposing opinions. For instance, the top design managers believed that ability to work under pressure
Page 7 of 14
was more important to the middle design managers, but the middle design managers thought it should be more essential for the top design managers. Moreover, the individual designers considered this DPM criterion was more important for them. The sections below present the details of their common and opposite opinions.
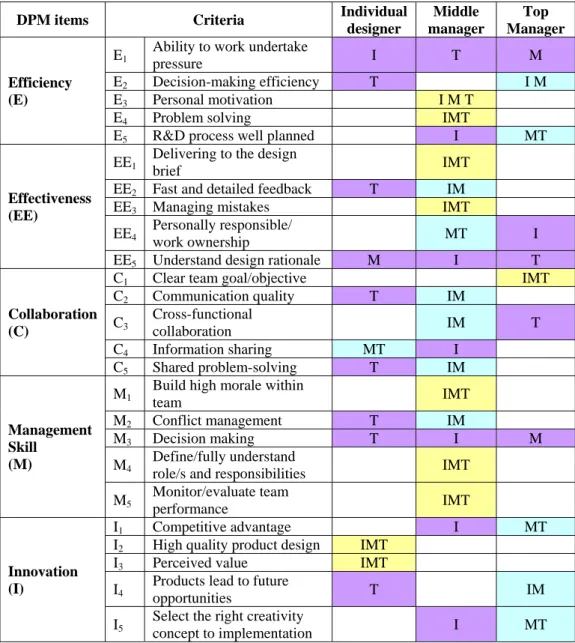
Table 3 Different perspectives for a role-based DPM matrix
DPM items Criteria Individual designer Middle manager Top Manager Efficiency (E)
E1 Ability to work undertake
pressure I T M
E2 Decision-making efficiency T I M
E3 Personal motivation I M T
E4 Problem solving IMT
E5 R&D process well planned I MT
Effectiveness (EE)
EE1 Delivering to the design
brief IMT
EE2 Fast and detailed feedback T IM
EE3 Managing mistakes IMT
EE4
Personally responsible/
work ownership MT I
EE5 Understand design rationale M I T
Collaboration (C)
C1 Clear team goal/objective IMT
C2 Communication quality T IM C3 Cross-functional collaboration IM T C4 Information sharing MT I C5 Shared problem-solving T IM Management Skill (M)
M1 Build high morale within
team IMT
M2 Conflict management T IM
M3 Decision making T I M
M4 Define/fully understand
role/s and responsibilities IMT
M5 Monitor/evaluate team performance IMT Innovation (I) I1 Competitive advantage I MT
I2 High quality product design IMT
I3 Perceived value IMT
I4
Products lead to future
opportunities T IM
I5 Select the right creativity
concept to implementation I MT
I=data from Individual designer, M= data from Middle manager, T= data from Top manager
Convergent opinions
As shown in Table 4, ten DPM criteria received the common opinions. Firstly, ‘Clear team goal/objective’ was selected specifically for top design managers because they usually took charge of a macro level of strategic management. More specifically, the top design managers are key decision-makers for project strategies and objectives, and their major responsibility is to orient teams towards common strategic objectives which could be achieved by having clearing team goal/objectives. In addition, top managers could clearly indicate team goals so
Page 8 of 14
that NPD cycle time could be reduced and the team members’ emotional reaction could be improved. Secondly, seven DPM criteria were identified for the middle design managers probably because they play a very crucial link between top design managers and individual designers. In addition, their responsibilities become more important as the complexity of the design projects increased. Moreover, the middle design managers, who are responsible for improving everyday tasks and supervising individual designers, play the most important part in design development and have a big impact on final design performance. Thus, the middle managers’ responsibilities are not replaceable by top design managers or individual designers, and the middle design managers are expected to satisfy both top managers and individual designers. Consequently, they should have high-quality skills in problem-solving, managing mistakes, monitoring/evaluating team performance, and so on. Ultimately, individual designers are those who effectively design the products, create and add design value to the products. Thus, their innovation performance has an important influence on final product design performance.
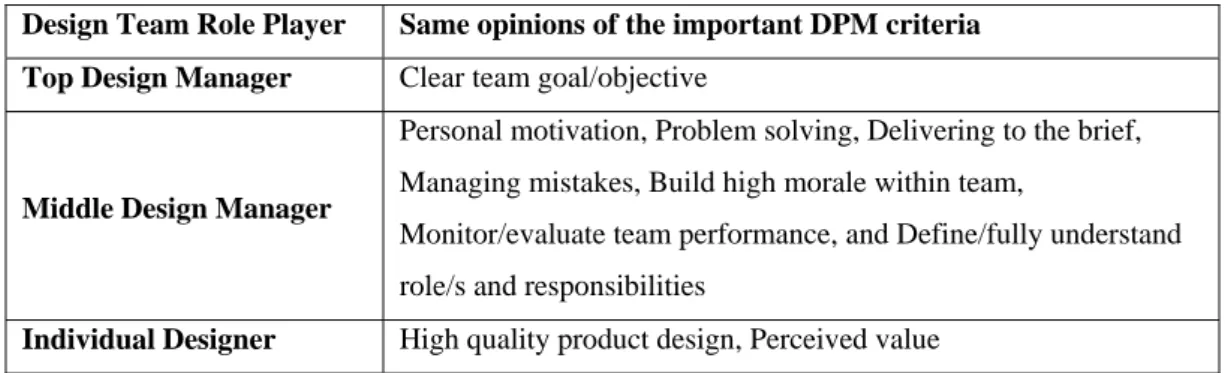
Table 4. The important DPM criteria with common opinions
Design Team Role Player Same opinions of the important DPM criteria Top Design Manager Clear team goal/objective
Middle Design Manager
Personal motivation, Problem solving, Delivering to the brief, Managing mistakes, Build high morale within team,
Monitor/evaluate team performance, and Define/fully understand role/s and responsibilities
Individual Designer High quality product design, Perceived value
Divergent Opinions
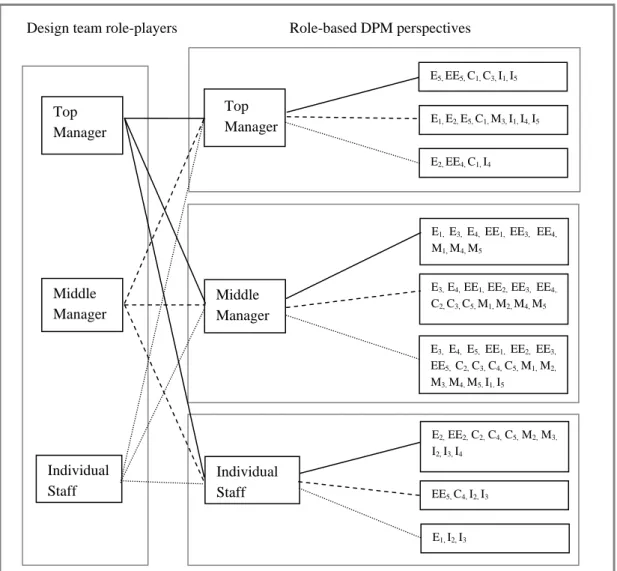
The diversity of these results indicates that the three design team role players had different opinions about the relative importance of DPM criteria and the three design team roles. It seems that experience in different roles raised different expectations of the other roles. For example, the top design managers believed that the ability to work under pressure was more important for the middle design managers, but the middle design managers considered it should be more important for the top design managers. This result implies that the middle design managers should have a high ability to work under pressure as they always work with a high level of responsibility. Conversely, the middle design managers believed that the top design managers were under higher pressure than them. Figure 1 presents various expectations from different design team role players. And the list below summarised key conflicting opinions from the three design role players.
Page 9 of 14
Figure 1. A role-based DPM matrix
¾ Efficiency performance- E1: Ability to work under pressure
Top design managers thought E1 was more important to middle design managers
when compared with individual designers and top design managers
Middle design managers regarded E1 was more important to top design managers
when compared with individual designers and middle design managers
Individual designers thought E1 was more important to them when compared with
top and middle design managers
¾ Effectiveness performance - EE5: Understand design rationale
Top design managers thought EE5 was more important to top design managers
when compared with individual designers and top design managers
Middle design managers thought EE5 was more important to individual designers
when compared with middle design managers and top design managers
Design team role-players Role-based DPM perspectives
Middle Manager Individual Staff E5, EE5, C1, C3, I1, I5 E1, E3, E4, EE1, EE3, EE4, M1, M4, M5 E2, EE2, C2, C4, C5, M2, M3, I2, I3, I4 E1, E2, E5, C1, M3, I1, I4, I5 E3, E4, EE1, EE2, EE3, EE4, C2, C3, C5, M1, M2, M4, M5 EE5, C4, I2, I3 E2, EE4, C1, I4 E3, E4, E5, EE1, EE2, EE3, EE5, C2, C3, C4, C5, M1, M2, M3, M4, M5, I1, I5 E1, I2, I3 Top Manager Top Manager Middle Manager Individual Staff
Page 10 of 14
Individual designers thought EE5 was more important to middle design managers
when compared with individual designers and top design managers
¾ Management skill performance - M3: Decision making
Top design managers thought M3 was more important to individual designers
when compared with middle design managers and top design managers
Middle design managers thought M3 was more important to top design managers
when compared with individual designers and middle design managers
Individual designers thought M3 was more important to middle design managers
when compared with individual designers and top design managers
DISCUSSION ON ROLE-BASED DPM MATRIX APPLICATION
MODEL
Based on the results of the questionnaire survey, it has been demonstrated that design team members do have diverse apprehensions of the 25 DPM criteria for the three design team role-players. Several convergent and divergent opinions referring to the significance of the criteria for the three design roles were summarised. These results offer design team members a better understanding of how their responsibilities have been perceived from within other roles, and may help to avoid potential communication conflicts and improve team collaboration. The matrix will support design managers in setting up role-specific DPM criteria for the top design manager, the middle manager and the designer, which could enable DPM operations to be linked to diverse design team role features, so as to produce more precise DPM results, with which to lead design performance.
A review of the literature indicates that many studies have pointed out that failure to link project strategy in this way is a recognised barrier to the success of the performance measurement tool (Bourne et al, 2002). One of the major challenges that has been discussed was defining a set of measures that were clearly linked to the operational strategies of the project (Reilly et al, 2002). Neely et al (1997) suggest how to link DPM operations with a project’s strategy from three levels: the set of criteria and performance measurement as a system; the relationship between the performance measurement system and its operational environment; and the individual performance measures. They also indicate the key to building up a successful DPM matrix is the assurance of a link between strategic objectives and performance criteria used at each level. Because complexity and uncertainty often feature in a design process, project strategies might need to be modified in the middle of the development process. Thus, if a DPM matrix could not be upgraded to match changes of project strategy, problems in project development could arise (Staw, 1981). A successful DPM matrix should be able to offer sufficient flexibility to match dynamic project strategies. Accordingly, based on the developed role-based DPM matrix and the foregoing recommendations, a role-based DPM matrix application model (Figure 2) was developed which addresses the application of the role-based DPM matrix at a design project system
Page 11 of 14
level, by involving design project strategies; at an operational environment level, by accounting for the dynamic feature of the design process; and at an individual level, by considering each design staff member’s role and responsibility.
Figure 2. Role-based DPM matrix application model
CONCLUSIONS
In summary, a role-based DPM matrix was developed which incorporated DPM criteria into the hieratical design team structure. In addition, it was found that clear team goal/objective is the most important DPM criterion for top design managers; problem solving, delivering to the
brief, and building high morale within team for middle design managers; and high quality
product design and perceived design value for individual designers. Furthermore, a
role-based DPM matrix application model was developed to enable the role-role-based DPM matrix to be flexibly implemented in different design projects by matching a project’s features from a design project strategies-based perspective (project system level), from a stage-based design objectives perspective (operation environment level), and from a design staff role-based perspective (individual level). The matrix and the application model will support design managers operating a role-based DPM implementation that can produce accurate DPM results, and in turn maximise support for improving design performance.
BIBLIOGRAPHY
Blenkinsop, N., Maddison, A. (2007). Team roles and team performance in defence acquisition. Journal of Management Development, 26(7), 667-682
Page 12 of 14
Bourne, M., Mills, J., Wilcox, M., Neely, A., Platts, K. (2000). Designing, Implementing and Updating Performance Measurement Systems. International Journal of Operations & Production Management, 20, 692-704
Brookes, N.J., Backhouse, C.J. (1998). Measuring the performance of product introduction. Journal of Engineering Manufacture, 212 (1), 1-11.
Bryant, L., Jones, D.A., Widener, S.K (2004). Managing value creation within the firm: an examination of multiple performance measures. Journal of Management Accounting Research, 16, 107-131
Buganza, T., Verganti, R. (2006). Life-Cycle Flexibility: How to Measure and Improve the Innovative Capability in Turbulent Environments. Journal of Product Innovation Management, 23, 393-407
Busseri, M.A., Palmer, J.M. (2000). Improving teamwork: the effect of self-assessment on construction design teams. Design Studies, 21(3), 223-238
Carbonell-Foulquié, P., Munuera-Alemán, J.L., Rodríguez-Escudero, A.I. (2004). Criteria employed for go/on-go decisions when developing successful highly innovative products. Industrial Marketing Management, 33, 307-316
Chiva, R., Alegre, J. (2009). Investment in design and firm performance: the mediating role of design management. Journal of Product Innovation Management, 26, 424-440
Chiesa, V., Frattini, F., Lazzarotti, V., Manzini, R. (2009). Performance measurement of research and development activities. European Journal of Innovation Management, 12, 1, 25-61
Cooper, R., Press, M. (1995). The design agenda: a guide to successful design management. England: John Wiley & Sons Ltd
Fondas, N., Stewart, R., (1994). Enactment in managerial jobs: a role analysis. Journal of Management Studies, 31(1), 83-103
Girard, P., Robin, V. (2006). Analysis of collaboration for project design management. Computers in Industry, 57, 817-826
Hart, S., Hultink, E.J., Tzokas, N., Commandeur, H.R (2003). Industrial companies’ evaluation criteria in new product development Gates. Journal of Product Innovation Management, 20, 22-36
Huang, X., Soutar, G.N., Brown, A. (2003). Measuring new product success: an empirical investigation of australian SMEs. Journal of Industrial Marketing Management, 33, 117-123 Hertenstein, J., Platt, M., Brown, D. (2001). Valuing design: enhancing corporate performance through design effectiveness. Design Management Journal, 12(3), 10-19
Hull, F.M. (2004). A composite model of product development effectiveness: application to services. IEEE Transactions on Engineering Management, 51(2), 162-172
Ilgen, D. R., Hollenbeck, J. R. (1992). The structure of work: Job design and roles. IN, Dunnette, M. D., Hough, L. M. (Eds.), Handbook of Industrial and Organizational Psychology, 2nd ed., pp. 165-207. Palo Alto, GA: Gonsulting Psychologists Press
Kennerley, M., Neely, A. (2003). Measuring performance in a changing business environment. International Journal of Operations & Production Management, 23, 213-229 Kušar, J., Dunovnik, J., Grum, J., Starbek, M. (2004). How to reduce new product development time. Journal of Robotics and Computer-Integrated Manufacturing, 20, 1-15 Loch, C., Stein, L., Terwiesch, C. (1996). Measuring development performance in the electronics industry. Journal of Product Innovation Management, 13, 3-20
Mallick, D.N., Schroeder, R.G. (2005). An integrated framework for measuring product development performance in high technology industries. Production and Operations Management. 14(2), 142-158
Page 13 of 14
Moultrie, J., Clarkson, P.J., Probert, D. (2007). Development of a design audit tool for SMEs. Product Innovation Management, 24, 335-368.
Nachum, L. (1999). Measurement of productivity of professional services an illustration on Swedish management consulting firms. International Journal of Operations & Production Management, 19(9), 922-949
Naveh, E. (2005). The effect of integrated product development on efficiency and innovation. International Journal of Production Research, 43(13), 2789-2801
Neely, A., Richards, H., Mills, J., Platts, K., Bourne, M. (1997). Designing performance measures: a structured approach. International Journal of Operations and Production Management, 17(11), 1131–1152.
Neely, A., Gregory, M., Platts, K. (2005). Performance measurement system design: a literature review and research agenda. International Journal of Operations & Production Management, 25(12), 1228-1263
O'Donnell, F.J., Duffy, A.H.B. (2002). Modelling design development performance. International Journal of Operations & Production Management, 22(11), 1198-1221
Partington, D., Harris, H. (1999). Team role balance and team performance: an empirical study. The Journal of Management Development, 18(8), 694-702.
Prasad, B., Wang, F., Degn, J. (1998). A concurrent workflow management process for integrated product development. Journal of Engineering Design, 9(2), 121-135
Reilly, R., Lynn, G., Aronson, Z. (2002). The role of personality in new product development team performance. Journal of Engineering and Technology Management, 19, 39-58
Salter, A., Torbett, R. (2003). Innovation and performance in engineering design. Journal of Construction Management and Economics, 21, 573-580
Shen, W., Hao, Q., Li, W. (2008). Computer supported collaborative design: retrospective and perspective. Computers in Industry, 59, 855-862.
Staw, B.M. (1981). The escalation of commitment to a course of action. Academy of Management Review, 6, 577-587
Suomala, P., Jokioinen, I. (2001). Minimum criteria in the new product development of capital goods from the concept to the product development phase. 8th International Product Development Management Conference Proceedings
Van Dyne, L., Gummings, L. L., Parks, J. M. (1995). Extra-role behaviors: In pursuit of construct and definitional clarity. Research in Organizational Behaviour, 17, 215-285
Welbourne, T.M., Johnson, D.E., Erez, A. (1998). The role-based performance scale: validity analysis of a theory-based measure. Academy of Management Journal, 41(5), 540-555
Willcocks, S. (2006). The clinical director in the NHS: utilizing a role-theory perspective. Journal of Management in Medicine, 8(5), 68-76
Y. Yin, S. Qin, R. Holland (2011). Development of a design performance measurement matrix for improving collaborative design during a design process. International Journal of Productivity and Performance Management, 60(2), 152-184
AUTHOR BIOGRAPHY
Dr. Yuanyuan Yin
Dr Yuanyuan Yin is a Lecturer in Design Management at Winchester School of Art, University of Southampton. She obtained her BEng degree in Industrial Design in China, her MA degree in Design Strategy & Innovation and PhD degree in Design research from Brunel University, UK. Her research has concentrated on promoting business performance through
Page 14 of 14
developing brand strategies, understanding customers and users, supporting design collaboration, improving product design, integrating design and market trends.
Dr. Shengfeng Qin
Dr Shengfeng Qin is a Senior Lecturer in the School of Engineering and Design, Brunel University, UK. He obtained his BSc and MSc degrees in China and his PhD degree in CAD from the University of Wales, UK. He was an academic visiting scholar in 1996-7 at the University of Birmingham. Following the visiting, he took a Research Assistant post in 1998 at the University of Wales Institute, Cardiff, and subsequently joined Loughborough University as a PostDoc Research Associate in 2000. His research interests include CAD, conceptual design, design management, sketch and visual computing, interaction and interface design. Dr Qin is a member of IEEE and Eurographics.
Dr Ray Holland
Dr Ray Holland directs the Masters Design Strategy programmes at Brunel University UK; multi-disciplinary design management courses attracting students from all over the world. Personal research reflects his conviction that design can find its direction through systems thinking and human/cultural issues. He was one of the pioneers of design management education and assists many overseas universities to develop masters and PhD programmes in design and branding. He spent his early career as a company lawyer and accountant until he found his home in design. As consultant, Ray has helped to implement large computer-based information systems and design-led change management programmes.