Prepared for
AAA Foundation for Traffic Safety 1440 New York Avenue, NW, Suite 201 Washington, DC 20005 Tel: 202-638-5944 Fax: 202-638-5943 www.aaafoundation.org May, 2002 Prepared by James H. Hedlund Anne T. McCartt
Preusser Research Group, Inc. 7100 Main Street Trumbull, CT 06611 Tel: 203-459-8700 Fax: 203-459-8312 email: [email protected]
DRUNK DRIVING:
SEEKING ADDITIONAL
SOLUTIONS
TABLE OF CONTENTS
List of Tables ... ii
List of Figures ... ii
Acknowledgements ...iii
Drunk driving today ... v
Drunk driving control strategies ... vi
Problems and solutions ... vii
Action — Implementing the recommendations... viii
Drunk driving tomorrow ... x
Chapter 1 1 Introduction Objectives ... 2 Methods ... 3 This report ... 5 Terminology ... 5 Chapter 2 7 History — Drunk driving in the United States since 1982 National forces and events... 7
Drunk driving changes by state ... 9
Comparison with Canada ... 11
Drivers under the age of 21 ... 12
Conclusions ... 16
Chapter 3 18 Status — Drunk driving in the United States 2000 Fatal crash data ... 18
Roadside survey data ... 21
DWI offender data... 22
Telephone survey data ... 24
Drunk driving priority as a social issue ... 25
Conclusions ... 26
Chapter 4 29 Strategies — Methods for controlling drunk driving Drunk driving control strategies ... 29
Deterrence ... 31
Young people under the age of 21 ... 33
Summary ... 34
Chapter 5 35 System — Drunk driving control operations and problems State and community drunk driving control systems ... 35
System problems ... 37
Summary ... 41
Chapter 6 43 Institutions — National drunk driving control activities and policies Organizations that affect drunk driving ... 43
Current drunk driving policy initiatives ... 49
Summary ... 51
Chapter 7 52 Solutions — Recommendations for improvement Laws ... 52
Enforcement ... 54
Adjudication and administration ... 58
Offender followup ... 63
System support ... 64
Summary ... 67
Chapter 8 68 Action — Implementing the recommendations Drunk driving control system monitoring program ... 68
State Drunk Driving Task Forces ... 70
State drunk driving grant reauthorization ... 71
Supporting activities ... 72
Concluding thoughts ... 73
Appendix A. References 75 Appendix B. Glossary of terms
List of Figures
Figure E-1 US Alcohol-related Traffic Fatalities
Figure E-2 US Drunk Drivers in Fatal Crashes Figure 1-1 US Alcohol-related Traffic
Fatalities
Figure 1-2 US Traffic Fatalities, Percent Alcohol-related
Figure 1-3 US Drunk Drivers in Fatal Crashes Figure 1-4 US Drivers in Fatal Crashes,
Percent Drunk
Figure 2-1 Alcohol-related Traffic Fatality Drop
Figure 2-2 US, Canada Percent Drunk Drivers
Figure 2-3 US, Canada Percent Drunk Drivers, Change from 1982 Figure 2-4 Drinking Drivers in Fatal Crashes,
Change from 1982
Figure 2-5 Drinking Drivers in Fatal Crashes, Rate per 100,000 Population Figure 2-6 Drinking Drivers in Fatal Crashes,
Population Rate, Change from 1982
Figure 2-7 Youth Drinking, Driving, Fatal Crashes, Change from 1984 Figure 2-8 US, Canada Young Drinking
Drivers, Fatal Crashes, Change from 1982
List of Tables
Table 3-1 Drunk Drivers in Fatal Crashes (BAC ≥ 0.10), 1982 and 1999 Table 3-2 Drinking Drivers in Fatal Crashes
(BAC > 0.00), 1982 and 1999 Table 3-3 BAC Levels for Driver Fatalities
(Age ≥ 21), 1982 and 1999, 15 Good Reporting States
Table 3-4 Drivers Involved in Fatal Crashes, by State and Alcohol Involvement, 1999
Table 3-5 Driver BAC Levels,
Weekend Nights, 1986 and 1996, National Roadside Surveys Table 3-6 Driver BAC Levels by Age,
Weekend Nights, 1986 and 1996, National Roadside Surveys Table 3-7 DWI Offender BAC levels and
Prior Offenses, State Data Table 3-8 Summary of Driver BAC Levels,
Prior Offenses, and Drinking Problems
Acknowledgements
The Traffic Injury Research Foundation (TIRF), Ottawa, has graciously pro-vided data on Canadian fatal crashes. The TIRF Fatality Database is supported financially by the Canadian Council of Motor Transport Administrators and Trans-port Canada.
Over 90 knowledgeable individuals across the country were interviewed in the course of this study. The authors thank each of them for sharing their knowledge and opinions. Their well-informed, thoughtful, passionate, and frank views all influenced the study.
The authors extend special thanks to three reviewers who read the study’s pre-liminary draft and provided valuable comments. We also thank Scott Osberg, Direc-tor of Research for the AAA Foundation for Traffic Safety, for his guidance in con-ducting the study and preparing this report.
Robert Ulmer, Preusser Research Group Vice-President, provided the report’s data analyses promptly and accurately and also shared his useful views on its methods and results. David Preusser, President, kept the work on track with his astute com-ments and advice.
The study’s findings, conclusions, recommendations, and opinions are those of the authors alone. The authors are solely responsible for all errors of fact or interpre-tation.
Executive Summary
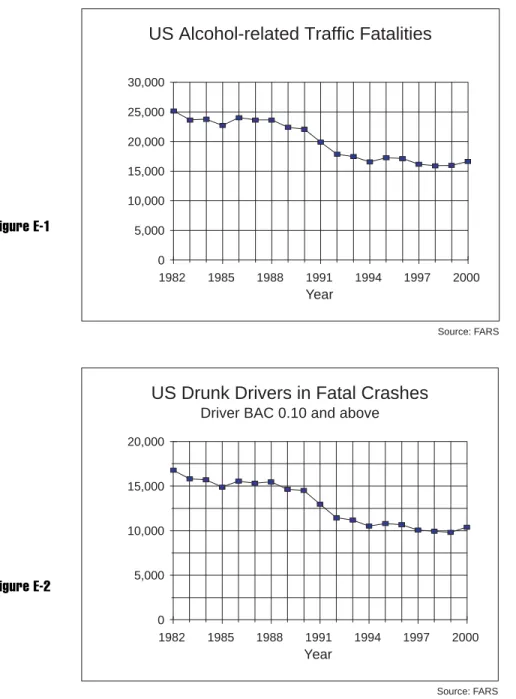
Drunk drivers continue to plague American highways. They crash, they injure, and they kill. In 2000, 16,653 traffic fatalities — 40 percent of all highway deaths — involved at least one drinking driver, pedestrian, or bicyclist. Of all drivers involved in fatal crashes, 10,408 had a blood alcohol level of 0.10 or above – a level that is illegal without any further evidence in every state except Massachusetts.
Drunk driving has dropped substantially over the past two decades. Traffic fatalities involving alcohol decreased by 37 percent between 1982 and 1999, and the number of drunk drivers in these crashes who had a blood alcohol level of 0.10 or higher decreased by 42 percent. However, as the figures below show, most of the
Figure E-1 0 5,000 10,000 15,000 20,000 25,000 30,000 1982 1985 1988 1991 1994 1997 2000 Year
US Alcohol-related Traffic Fatalities
Source: FARS Figure E-2 0 5,000 10,000 15,000 20,000 1982 1985 1988 1991 1994 1997 2000 Year
US Drunk Drivers in Fatal Crashes
Driver BAC 0.10 and above
progress ended by about 1994. In 2000, drunk driving deaths increased for the first time since 1995. Traffic fatalities involving alcohol rose by 4%, from 15,976 in 1999 to 16,653 in 2000. The number of drunk drivers in fatal crashes rose by 6%, from 9,818 in 1999 to 10,408 in 2000.
This study investigates why drunk driving has not decreased recently and what can be done to reduce it further. Data from traffic crashes and roadside and tele-phone surveys present a clear picture of drunk driving in the United States today. Research shows what is known about which drunk driving control methods are effective and which are not. Interviews with over 90 knowledgeable practitioners, managers, and researchers across the country describe what is happening on the streets and in communities, what changes are needed, and how these changes might be effected.
Every state has an elaborate system of drunk driving laws, enforcement, courts, and punishment, but these systems do not work as well as they should. Arrest rates are low. Complex laws allow some offenders to escape any punishment. Other offenders can avoid a drunk driving conviction through a plea bargain. Sanctions are not applied consistently. Sentence requirements are not completed. These problems are not well known because many states do not have good record systems. Drunk drivers have little fear of being stopped, arrested, convicted, and punished — so they continue to drink and drive.
This study recommends effective and practical actions to improve the drunk driving control system along with three specific strategies to implement these recom-mendations.
Drunk driving today
Drinking and driving is common.About 21 percent of driving-age Americans re-ported they had driven after drinking in the past year, making about 950 million drinking-driver trips. In about 9 percent of these trips, or about 80 million, the driver’s blood alcohol level (BAC) was 0.08 or above.
Drunk driving arrests are rare. With 1.55 million arrests for drunk driving (DWI) in 1999, the chances of arrest on any drunk driving trip were less than one in 50.
Drunk driving by young people has decreased substantially. Only 12 percent of drunk drivers in fatal crashes in 1999 were under 21, compared to 19 percent in 1982. Repeat offenders and drivers with high blood alcohol levels contribute prominently to
the problem. About one-third of all drivers arrested or convicted of DWI are repeat offenders. Over half of all drivers arrested for DWI and almost two-thirds of fatally injured drinking drivers had a BAC over 0.15 — a level that requires a typical 180lb man to drink seven beers in one hour. About 23 percent of all drinking drivers are problem drinkers, but they contribute over 40 percent of all drinking-driver trips. States differ substantially. In some states, only about 10 percent of all drivers in-volved in fatal crashes had BAC levels over 0.10. In other states, over 25 percent did. States that have reduced drunk driving the most over the past 20 years have effective laws, high-visibility enforcement, and substantial public education built on a founda-tion of strong leadership, secure funding, and firm commitment.
Attention to drunk driving has dropped. The public is more concerned with drugs and crime. Even within traffic safety, the spotlight is on aggressive driving, cell phone use, and tire defects rather than drunk driving.
Many drunk drivers are not deterred. While most of the public supports DWI laws and enforcement, a substantial minority of drivers believes it is unlikely that they would be stopped, arrested, or convicted if they drove after drinking too much. What is needed? An improved drunk driving control system will ensure that drunk drivers are consistently arrested, regularly convicted, and appropriately punished. When everyone understands that driving drunk is likely to bring certain and uncom-fortable consequences, then fewer people will drive drunk.
Drunk driving control strategies
Good laws, active enforcement, and effective punishment. Research over 40 years has shown conclusively that good laws that are strongly supported and enforced with meaningful penalties reduce drunk driving. Three other strategies support this system. Public education informs drivers, especially young drivers, about alcohol and drunk driving issues. Alcohol treatment is essential for problem drinkers. Alcohol control measures such as minimum legal drinking ages and alcohol server training help reduce drinking in situations that may lead to drunk driving. With strong laws, enforcement, and punishment at the center, these strategies reinforce and promote a community standard that drunk driving is not acceptable.
A strong system that affects everyone. Drunkdriving laws and enforcement send a message: drunk driving is not acceptable. A strong drunk driving control system increases both the public perception and the reality that drunk drivers will be fre-quently detected, arrested, convicted, and punished. A weak system sends the
oppo-site message: drunk driving is not a serious problem, drunk drivers usually will not be caught, and those caught will not be punished.
Problems and solutions
Research studies and interviews identified common problems in drunk driving control systems. They do not occur everywhere but are frequent enough that all states and communities should consider them. Research and interviews also identified solutions to these problems.
PROBLEM SOLUTION
State laws are complex and contain • Review and simplify laws; use the Uniform inconsistencies and loopholes Vehicle Code 2000 as a starting point Many drivers refuse to take BAC tests • Establish penalties for refusing to take the
BAC test that are more severe than the penalties for failing the BAC test
DWI enforcement levels and arrest • Simplify arrest procedures and paperwork
rates are low • Provide necessary equipment and training
• Enforce a drinking age of 21 and zero tolerance laws for drivers under 21 Many arrested drunk drivers are not • Eliminate plea bargains to non-alcohol
convicted offenses
• Eliminate diversion programs that allow offenders to escape punishment
• Ensure that administrative hearings do not interfere with criminal proceedings Many repeat offenders are not • Improve record systems to identify prior
identified drunk driving offenses
Problem drinkers are not identified or • Screen all drunk driving offenders for
treated effectively drinking problems
• Require treatment if needed Even convicted drunk drivers escape •Apply administrative and criminal
meaningful punishment sanctions consistently
Offenders frequently are not monitored • Control offenders closely during to assure they complete their sentences probation
• Use home detention, electronic monitoring, or jail as appropriate • Consider dedicated facilities if needed Offenders frequently drive in violation • Monitor offenders closely
of their license suspension or fail to • Establish and enforce stiff penalties for become re-licensed when eligible unlicensed driving
Law enforcement, courts, and • Provide steady, dedicated funding probation lack resources
States need strong leadership for all • Assure that state transportation, health, drunk driving control activities law enforcement, motor vehicle, and
justice departments work together Considering and addressing these issues will improve a state’s drunk driving control system, show the public that drunk driving will not be tolerated, and con-vince more drunk drivers to change their behavior.
Action — Implementing the recommendations
Three strategies provide an implementation framework that can link commu-nity, state, and national organizations and resources together for a renewed attack on drunk driving. While the strategies are far from unique, they establish a proven structure that in turn will supply the information, management, and funding needed for progress.
1. ESTABLISHAPROGRAM THATMONITORSTHE DRUNKDRIVINGCONTROL SYSTEMINEACH STATE.
Efforts to improve a state’s drunk driving control system should begin with good information on the system’s performance, from laws through enforcement, adminis-trative actions, adjudication, and offender follow-up. What is working well and what is not? What critical problem areas should be addressed? Some states collect some of this information regularly and report it to the public. Others do not or report only a portion. In particular, there is little information on the successes and problems experienced by judges and prosecutors in the courts. Partly as a result, the courts have not received the public attention, encouragement, or resources they need.
provide this information. The monitoring program could combine information from official records with data collected directly from communities, in a fashion similar to the court monitoring programs that operated so effectively in the 1980s. The media will eagerly report on the results of the monitoring program and may help with the program’s design and operation. The media also can highlight outstanding judges, prosecutors, law enforcement and probation officers, and motor vehicle department staff. Issues revealed by the monitoring program should easily get the attention of public officials and legislators.
MADD, AAA, and other citizen organizations can operate system monitoring programs. The National Highway Traffic Safety Administration (NHTSA) and the Department of Justice can work with organizations representing motor vehicle departments, prosecutors, judges, probation officers, and state highway safety organi-zations to design the program and help communities to implement it.
2. REINVIGORATESTATEDRUNKDRIVING TASKFORCES.
State task forces include representatives from all constituencies involved with drunk driving control. They have high-level access to the governor and legislature. They can identify problems, suggest solutions, and promote action. State task forces should examine the state’s drunk driving laws and procedures, its driver and offender record systems, its drunk driving enforcement and adjudication activities, its resource needs, and the ways authority, responsibility, and coordination are assigned among the state agencies involved in drunk driving control.
NHTSA, in cooperation with other Federal agencies, should help state task forces by defining a model state drunk driving control program, establishing perfor-mance measures for drunk driving enforcement and adjudication, and supporting states as they assist each other in reviewing and recommending improvements to their drunk driving control systems.
3. REVISE STATEDRUNKDRIVING GRANTS.
Section 402, 410, and other Federal grants are critical to state drunk driving activities. Federal grants provide funds for drunk driving control and also encourage states to adopt effective strategies. The current grant programs could be improved substantially to be less bureaucratic, more flexible, and more accountable. The next reauthorization should revise the grant programs so that they:
• Reward successful states and also encourage weaker states to improve • Provide flexibility along with accountability for results
• Ensure steady funding as long as state performance is equally steady
• Use performance-based criteria instead of requiring specific laws or programs • Provide substantial funding for state record systems to track each drunk driver
from arrest through prosecution, adjudication, sanction, and rehabilitation • Require states to establish or continue broad-based drunk driving task forces • Require the Federal departments of Transportation, Justice, and Health and
Human Services to work together in designing and operating these grant programs.
NHTSA is the organization best suited to provide leadership on all three action steps, in collaboration with the states, other Federal agencies, professional and citizen organizations, and others involved in drunk driving control.
Drunk driving tomorrow
The problems with state drunk driving control systems can be solved in many ways. The most effective will follow several principles: They will invest authority and responsibility in people and organizations at all levels, local to national, because drunk driving control requires action at all levels. They will operate in the public eye, using the media to report on problems and solutions, because ultimate decisions on priorities and resources to control drunk driving must have public support. They will not promise instant solutions based on a single action but rather will take steady steps towards long-term improvement. And they will establish mechanisms for identifying and solving problems rather than attempting to apply one-size-fits-all methods. The three specific recommendations suggest how to turn these principles into action.
Drunk driving control is a long, slow process of modifying social norms and practices regarding drinking and driving. These norms and practices have changed substantially over the past 20 years, and these changes are evident in the substantial reduction in drunk driving crashes, injuries, and fatalities. Very few social problems have been reduced by 37 percent over 18 years, as has drunk driving. Advocates for other issues with similar success rates might be pleased to declare victory and focus on maintaining their gains. However, advocates of drunk driving control are not content to rest on their laurels. The path to additional gains is clear. The goal is a drunk driving control system, extending from detection to rehabilitation, that is open, effective, consistent, and accountable. The result will be further reductions in alcohol-related deaths and injuries. All that is needed is leadership and commitment.
CHAPTER 1
Introduction
Drunk drivers continue to plague American highways. They crash, they injure, and they kill. In 2000, 16,653 traffic fatalities — 40 percent of all highway deaths — involved at least one drinking driver, pedestrian, or bicyclist. Of all drivers involved in fatal crashes, 10,408 had a blood alcohol level of 0.10 or above – a level that is illegal without any further evidence in every state except Massachusetts.
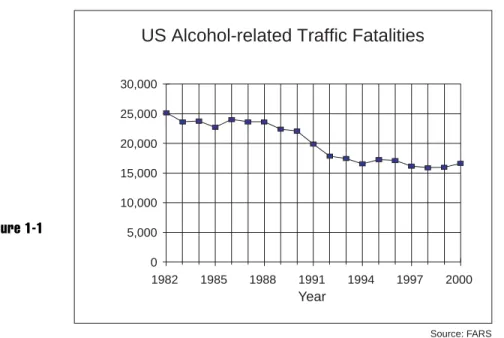
Traffic fatalities involving alcohol have dropped by 37% over the past two decades, from 25,165 in 1982 to 15,976 in 1999. However, as Figures 1-1 and 1-2 show, most of the progress ended by about 1994. In 2000, traffic fatalities involving alcohol increased by 4% to 16, 653, the first increase since 1995.
Figure 1-1 0 5,000 10,000 15,000 20,000 25,000 30,000 1982 1985 1988 1991 1994 1997 2000 Year
US Alcohol-related Traffic Fatalities
Source: FARS
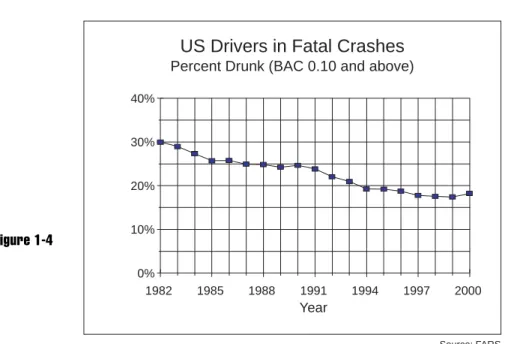
Different measures of the drunk driving problem show very similar trends. Figures 1-3 and 1-4 show the trends for drivers in fatal crashes who had a blood alcohol level (BAC) of 0.10 or higher. The number of these intoxicated drivers dropped by 42%, from 16,793 in 1982 to 9,818 in 1999 but then rose by 6% to 10,408 in 2000. The proportion of all drivers in fatal crashes with a BAC of 0.10 or higher dropped from 30% in 1982 to 17% in 1999 but rose to 18% in 2000.
This study investigates why drunk driving has not continued to decrease. Have current drunk driving programs and strategies reached the limits of their effective
Figure 1-2 0% 10% 20% 30% 40% 50% 60% 70% 1982 1985 1988 1991 1994 1997 2000 Year US Traffic Fatalities Percent Alcohol-related Source: FARS Figure 1-3 0 5,000 10,000 15,000 20,000 1982 1985 1988 1991 1994 1997 2000 Year
US Drunk Drivers in Fatal Crashes
Driver BAC 0.10 and above
Source: FARS
ness? Have some areas of the country lagged behind others? Above all, what can be done to reduce drunk driving even further?
Objectives
The study’s objectives are to analyze recent drunk driving control activities and policies in the United States and to recommend strategies to reduce drunk driving further. The strategies must satisfy three criteria.
• Effective: There must be convincing evidence that a specific strategy will reduce drunk driving. The evidence can come in different forms. Some strategies have been carefully evaluated to measure their direct effect on drunk driving crashes, arrests, or
Figure 1-4 0% 10% 20% 30% 40% 1982 1985 1988 1991 1994 1997 2000 Year
US Drivers in Fatal Crashes
Percent Drunk (BAC 0.10 and above)
Source: FARS
recidivism. Other, more experimental, strategies have suggestive but not conclusive evidence. Still other strategies are virtually impossible to evaluate in isolation and must be considered using different criteria, such as their contributions to the entire drunk driving control system.
• Practical: There must be a clear way to implement the recommended strategies. This means that a strategy cannot cost too much in political or economic terms, or require unlikely changes in laws or practices, or be unacceptable to the public.
• Short-term: The strategies must be able to be implemented within the next two to three years and must produce results soon after implementation. As an absolute limit, strategies that could not promise definite results by 2010 were not considered.
These three criteria limit the study’s scope substantially. The study does not attempt to consider or recommend everything that should be done to reduce drunk driving, but examines only strategies that can reduce drunk driving relatively soon. In particular, the study does not consider strategies that require research and develop-ment or strategies involving technology that would take many years to impledevelop-ment.
Methods
The study used three sources of information.
• Data: Traffic crash and roadside survey data describe the current drunk driving problem and how it has changed over the past 20 years. National telephone survey data capture the public’s knowledge and views on matters related to drunk driving.
• Research: The extensive research literature shows what is known about methods to control drunk driving and identifies strategies that are known to be effective.
• Interviews: Over 90 knowledgeable people across the country were interviewed. They provided extensive insight into the drunk driving research literature and current drunk driving control operations. They suggested what changes were needed and how these changes might be produced.
The traffic safety research literature on drunk driving issues is extensive. Its quality varies widely. Basic research on the effects of alcohol on skills related to driving has been conducted under controlled scientific conditions; this research has produced broadly accepted conclusions that the performance of driving-related skills degrades as blood alcohol concentration increases (see, for example, Moskowitz and Fiorentino, 2000). However, research on the effects of laws, programs, and strategies to reduce drunk driving must necessarily be conducted in real-world settings, where many potential influences on drunk driving cannot be controlled. Conclusions drawn from this research almost always contain an element of judgment.
Rather than attempting to review the entire research literature anew, the study relied heavily on several recent summaries of drunk driving research in key areas, supplemented with research that has appeared recently or has not been included in the available summaries.
The interviews were conducted in four stages. First, Regional Administrators or key staff in each of the 10 National Highway Traffic Safety Administration (NHTSA) regions were interviewed. Next, based on suggestions received from these interviews and from key national traffic safety experts, intrerviews were conducted with Governor’s Highway Safety Representatives or key staff in 16 states. Then, using suggestions from many sources, 24 people in states and communities were inter-viewed, including representatives from law enforcement, prosecution, the courts, probation and treatment, state liquor control, state legislative offices, community traffic safety programs, education, the media, American Automobile Association (AAA) clubs, and Mothers Against Drunk Driving (MADD). Finally, 34 people with extensive national-level knowledge and experience in drunk driving issues were interviewed. These included policymakers, administrators, practitioners, and re-searchers from Federal and state government, academia, industry, nonprofit organiza-tions, and associations that represent disciplines including law enforcement, courts, the states, citizen groups, insurance companies, and alcohol producers.
Interviews in the first three stages followed a uniform structure. Interviewees were sent a brief description of the study’s scope, a short data summary, and a set of questions requesting their views on drunk driving problems and solutions. After the interviewees gave their views on these questions they were invited to add any other information or suggestions. In the final stage, interviewees were sent the same study description and data summary as well as a one-page summary of interview results from the first three stages. These experts were asked for their comments on the interview results, their overall recommendations on drunk driving strategies, and their suggestions for implementing their recommendations.
All interviewees in each stage were assured that their responses would be confi-dential. Their frank discussion and comments provided insights that could not be obtained from written sources. Because of this confidentiality, the report contains no direct quotations from any interviews. When similar suggestions were provided frequently they are reported in words such as “Many interviewees noted that ...” or “Several judges said that ...”
The interviewees do not form a representative sample in any statistical sense. However, they include people from over half the states and from a wide range of disciplines that deal with drunk driving issues every day. Their collective voice on many issues carried substantial weight in shaping this report’s conclusions and recom-mendations.
This report
This report first reviews major drunk driving trends and activities over the past 20 years. Five states that reduced drunk driving considerably more than similar states are compared with states that were less successful. The current drunk driving situa-tion is then described in detail. The main approaches to controlling drunk driving are discussed and compared. A review of the characteristics of state drunk driving control systems is followed by an overview of national drunk driving activities, current policy initiatives, and national opinion regarding drunk driving.
Information from all sources leads to a clear statement of the key current ob-stacles to reducing drunk driving and suggests effective strategies for overcoming these obstacles. An action agenda proposes methods for implementing the strategies with roles for Federal, state, and local organizations.
Terminology
The following terms and abbreviations are used throughout the report. Addi-tional terms and abbreviations are collected in Appendix B.
Alcohol-related traffic fatality — a traffic fatality in which at least one driver or non-motorist was estimated to have a positive blood alcohol concentration (as reported by the Fatality Analysis Reporting System, or FARS).
BAC — alcohol concentration in the body. BAC stands for Blood Alcohol Concen-tration. BAC was originally measured by determining the percentage of alcohol in a person’s blood, but now typically involves measuring alcohol in breath. However, it is still expressed in terms of milligrams of alcohol per 100 milliliters of blood. Drinking driver — a driver with any positive BAC.
Drunk driving — driving with a BAC level exceeding a state’s per se level or while sufficiently impaired by alcohol to be guilty of DWI.
DWI — the offense of driving while impaired by alcohol. The formal offense differs from state to state and may be called Driving While Impaired, Driving While Intoxi-cated, and Driving Under the Influence. Here, DWI is used to describe each state’s primary impaired driving offense.
CHAPTER 2
History — Drunk driving in the
United States since 1982
Two events make 1982 an appropriate year to begin a review of drunk driving activities and progress in the United States. First, 1982 was the year in which NHTSA’s FARS began estimating alcohol involvement in fatal traffic crashes in a consistent manner across all the states. Second, by 1982 two citizens’ organizations, Mothers Against Drunk Driving (MADD) and Remove Intoxicated Drivers (RID), were beginning to affect the national debate. MADD and RID produced substantial changes; FARS allowed the effects of these changes to be measured. Following a brief review of important events, this chapter examines and draws important conclusions from the differences in drunk driving reductions among states, between younger and older drivers, and between the United States and Canada.
National forces and events
Several events in the 1960s and 1970s laid the groundwork for subsequent progress (Jacobs, 1989, and Preusser et al, 1993, both contain short accounts of the early history). The Department of Transportation was created with safety as one of its key priorities. States began to receive regular funding for drunk driving control and prevention, as well as other highway safety activities, under Section 402 of the Highway Safety Act. Each state appointed a Governor’s Highway Safety Representa-tive to manage these activities. The National Highway Safety Bureau, the agency that was to become NHTSA, was formed in 1966. In its 1968 Report to Congress, Alcohol and Highway Safety, the agency raised public concern for drunk driving. It began to conduct research on controlling drunk driving, initiate demonstrations, and develop programs.
In the 1970s, NHTSA implemented Alcohol Safety Action Projects (ASAPs) in 35 communities at a cost of $88 million. These ASAPs used drunk driving enforce-ment, public information, and alcohol treatment on a scale not previously seen. While the ASAPs failed to demonstrate a significant impact on drunk driving (Jacobs, 1989), they laid the foundation for subsequent progress.
In 1978, Doris Aiken founded RID in Schenectady, New York, after a drunk driver killed a local teenager. In 1980, Candy Lightner founded MADD in Sacra-mento, California, after a repeat drunk driver killed her daughter. During the 1980s,
MADD and RID brought drunk driving to the top of the social policy agenda. By focusing public attention on the innocent victims of drunk driving crashes, they effectively criminalized drunk drivers in the public eye. Crashes were no longer “accidents,” the unintended consequences of normal everyday behavior, but were premeditated crimes that deserved jail and other harsh punishment. In 1982, Presi-dent Reagan appointed the PresiPresi-dential Commission on Drunk Driving, showing how important the issue had become on the national agenda. In 1988, Surgeon General C. Everett Koop held his Surgeon General’s Workshop, which summarized progress to date, reviewed current problems, and produced a host of recommenda-tions.
In the 1980s, legislative changes begun in the 1970s continued rapidly. States enacted laws including per se statutes, administrative license revocation, mandatory driver’s license suspension, and required mandatory time in jail or community service. In 1982, Congress established Section 408 grants that provided funds for drunk driving control to states that implemented or already had in place certain drunk driving control laws or programs. In 1984, Congress required all states to raise their minimum legal drinking age to 21 or lose a portion of their Federal highway construction funds. Many states established drunk driving task forces to develop legislation and coordinate drunk driving control activities (NHTSA, 1991-1998). Perhaps most important, the understanding grew that drunk driving control requires more than individual laws and programs. It needs a coordinated system, with all of the parts working together.
Drunk driving enforcement changed markedly over this period. Accurate and widely used breath test equipment at police stations provided BAC evidence that was acceptable in court. Police were routinely trained in standard field sobriety test procedures and some began to use hand-held preliminary breath test devices at the roadside. Sobriety checkpoints and special drunk driving saturation patrols in-creased. As a result, drunk driving arrests rose from about 1.27 million in 1979 to 1.92 million in 1983 and remained at over 1.70 million every year through 1990.
NHTSA played a major role in the 1980s as it assisted MADD and RID, helped to plan and guide the Surgeon General’s Workshop, implemented the Section 408 grants, advised and assisted state programs, developed law enforcement training, and conducted extensive research on drunk driving issues.
In the 1990s, states continued to implement the laws and programs developed in the 1980s. The one new law was zero tolerance for youth; Maryland enacted the first state zero tolerance law in 1990 and by the end of 1998 all 50 states and the District of Columbia had zero tolerance laws in effect. Thirteen states and the Dis-trict of Columbia lowered their BAC limits to 0.08 in the 1990s, joining the four states that had established 0.08 limits in the 1980s. Congress replaced the Section 408 grant program with the similar Section 410 grants and NHTSA continued its programs of extensive research, program development, and technical assistance. In
1995, NHTSA sponsored Partners in Progress, a national meeting of over 30 organi-zations to review progress in reducing drunk driving, establish goals, and plan actions for achieving further reductions.
Drunk driving changes by state
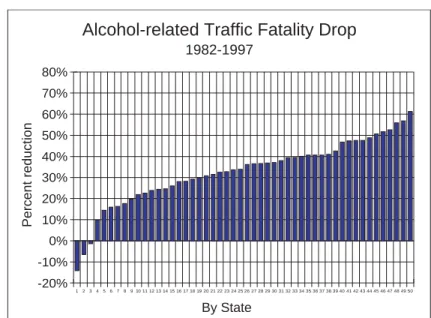
From 1982 to 1997, alcohol-related traffic fatalities nationwide dropped by 36%, but this reduction varied substantially by state. As Figure 2-1 shows, during this period six states reduced their alcohol-related traffic fatalities by more than 50%, while in three states alcohol-related traffic fatalities increased.
Figure 2-1 -20% -10% 0% 10% 20% 30% 40% 50% 60% 70% 80% MO AL NVMS GA IA FL SCMT OR SD MI IN MD WA MN TX RI PA AR NDCO VT NJ CT Source: FARS 1 2 3 4 5 6 7 8 9 10 11 12 13 14 15 16 17 18 19 20 21 22 23 24 25 26 27 28 29 30 31 32 33 34 35 36 37 38 39 40 41 42 43 44 45 46 47 48 49 50 1 MO 2 AZ 3 AL 4 ID 5 NV 6 NE 7 MS 8 VA 9 GA 10 ME 11 IA 12 DE 13 FL 14 TN 15 SC 16 AK 17 MT 18 LA 19 OR 20 WI 21 SD 22 NC 23 MI 24 UT 25 IN 26 WV 27 MD 28 KS 29 WA 30 KY 31 MN 32 IL 33 TX 34 NM 35 RI 36 NH 37 PA 38 HI 39 AR 40 MA 41 ND 42 OH 43 CO 44 OK 45 VT 46 CA 47 NJ 48 NY 49 CT 50 WY By State Alcohol-related Traffic Fatality Drop
1982-1997
Percent reductio
n
By State
A recent study for NHTSA (Ulmer et al, forthcoming) investigated the reasons underlying these substantial differences in performance. Since alcohol-related traffic fatalities have changed little since 1997, the observations and conclusions summa-rized below are equally relevant today.
The factors influencing state alcohol-related traffic fatalities fall into three broad categories, of which two are easy to measure and were evaluated using statistical models. The first is growth: States with greater growth in either vehicle travel or employment showed smaller alcohol-related fatality decreases. The second is laws: some laws, in particular administrative license revocation and zero tolerance laws for youth, helped some states to reduce alcohol-related fatalities.
The third category contains more subjective data. To investigate effectiveness, the report looked at five successful states: California, Colorado, New Jersey, Ohio, and Oklahoma. Each state reduced alcohol-related traffic fatalities more than pre-dicted by its travel and economic changes and also substantially exceeded the average state reduction in alcohol-related traffic fatalities from 1982 to 1997. Data from seven states that did not perform as well were aggregated to serve as a comparison.
Information on study and comparison states was obtained from published sources and interviews.
Both the successful and the comparison states reduced alcohol-related traffic fatalities. The successful states had an average reduction of 48% and the comparison states 14%. Every state passed and enforced impaired driving laws, educated the public, and conducted impaired driving prevention programs. The key differences were effective leadership, secure funding, and fortunate circumstances.
EFFECTIVELEADERSHIP.
Each of the five successful states enjoyed effective leadership at a critical time. Typically a high-profile drunk driving bill in the legislature served as the rallying point for action. Leadership in the state highway patrol and highway safety office was critical in implementing effective drunk driving enforcement, education, and preven-tion programs. State leadership established drunk driving as a high priority on the public agenda, captured media attention, promoted legislation, provided necessary funding, and got results. Comparison states appeared to exhibit considerably less leadership on drunk driving issues.
SECURE FUNDING.
Four of the five successful states have provided dedicated, off-budget funding to enforcement and treatment. In contrast, none of the comparison states appeared to have substantial resources dedicated to drunk driving programs. The limited dedi-cated funds in comparison states were devoted almost exclusively to alcohol screening and treatment rather than to drunk driving prevention or enforcement.
FORTUNATE CIRCUMSTANCES.
Even after statistically controlling for travel, population, and employment, these factors each grew more than twice as fast in the comparison states than in the success-ful states. Certain aspects of a state’s geography, road system, or population affected outcomes in several comparison states, some of which appeared to do everything right to reduce drunk driving but still failed to achieve substantial reductions.
Enforcement also was important but was difficult to evaluate. DWI arrests dropped in three of the five successful states during the study period and remained roughly constant in the other two. In contrast, arrests were relatively stable in all the comparison states. In addition, the average arrest rate per population was higher in the comparison states than in the successful states. All successful states employed highly visible DWI enforcement. Some used checkpoints extensively; others did not. The comparison states as a whole appeared not to conduct coordinated, statewide, high-visibility DWI enforcement as effectively as did the successful states.
CONCLUSIONS.
Once a state has effective laws, high-visibility enforcement, and substantial public education, it appears that no single law, enforcement practice, or education
strategy is critical. Rather, precisely what a state does is less important than how well it is done — with leadership, commitment, and adequate funding.
Comparison with Canada.
The Canadian experience provides an interesting comparison to drinking and driving control practices and results in the United States. Simpson et al (1994) review the record from 1973 through 1991, while Mayhew et al (2000) provide a brief update through 1997. Canada had a BAC limit of 0.08 throughout this period, so 0.08 BAC is used to define drunk driving in the Canadian data.
Since 1982, the percentage of Canadian driver fatalities that were drunk has dropped fairly steadily except for a two-year rise in 1992 and 1993. The same mea-sure in the United States dropped from 1982 to 1985, remained essentially flat through 1990, dropped again through 1994, and has remained flat since then. Figure 2-2 compares the two trends, using Canadian data from the seven provinces with complete information in the TIRF database from 1982 to date. It shows that the proportion of drunk drivers among driver fatalities is slightly higher in Canada (as might be expected, since the BAC limit is lower in Canada). The year-to-year
changes differ somewhat, but the overall decrease from 1982 to 1998 is quite similar. Figure 2-3 illustrates the latter two patterns more vividly. It plots the change since 1982 in the percentage of driver fatalities who were drunk. From 1982 to 1998, this proportion dropped by about 35% in each country.
Figure 2-2 0% 10% 20% 30% 40% 50% 82 86 90 94 98 Year US Canada
US, Canada Percent Drunk Drivers
Driver fatalities US 0.10, Canada 0.08
Sources: US – FARS, Canada – TIRF
The same factors operated in Canada as in the United States: active citizen groups, stronger drunk driving legislation, more active enforcement, and vigorous public education (Simpson et al, 1994). However, as in the United States, no one factor is responsible for the drop. In particular, the reasons for the two-year rise in 1992 and 1993 are not understood.
Figure 2-3 50% 60% 70% 80% 90% 100% 82 86 90 94 98 Year US Canada
US, Canada Percent Drunk Drivers
Change from 1982
Sources: US – FARS, Canada – TIRF
Drivers under the age of 21
The age distribution of drinking drivers in FARS changed considerably between 1982 and 1999. The number of drinking drivers under the age of 21 in fatal crashes dropped by 62%, from 4,393 in 1982 to 1,687 in 1999. In comparison, drinking drivers aged 21-34 dropped by 50% while drinking drivers aged 35-54 increased by 3%.
A second study for NHTSA (Hedlund et al, 2001) investigated the drop in young drinking drivers in more detail. Its results, summarized below, provide useful background information for the consideration of overall drunk driving strategies.
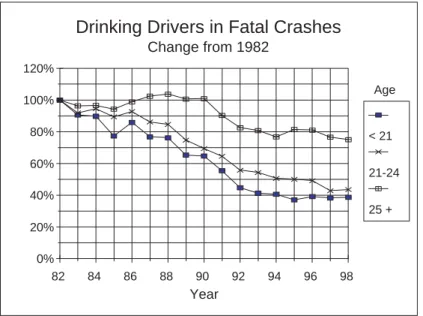
Figure 2-4 0% 20% 40% 60% 80% 100% 120% 82 84 86 88 90 92 94 96 98 Year < 21 21-24 25 +
Drinking Drivers in Fatal Crashes
Change from 1982
Age
Figure 2-4 shows the percentage drop by age group over time. Drinking drivers under 25 years of age decreased substantially from 1982 until 1990, while drinking drivers over 25 remained roughly constant. Drinking drivers in all age groups de-creased between 1990 and 1994 but have changed little since then. Young drivers of all ages below 21 reduced their drinking and driving by similar amounts.
Young drinking drivers’ involvement in fatal crashes decreased substantially in all regions of the country and in most states, in contrast to the substantial state-to-state differences observed for all drinking drivers. Drinking driver involvements per population aged 15-20 decreased by more than 50 percent in 45 states.
Some of the decrease occurred simply because there were fewer young drivers. Between 1982 and 1998, the United States population aged 16 to 20 dropped by 6%, while the population aged 25 to 54 rose 31%. Figures 2-5 and 2-6 control for these changes by plotting drinking drivers per 100,000 population. Figure 2-5 shows that the fatal crash involvement rate for drinking drivers aged 16 to 20 is still higher than for older drivers but has dropped substantially since 1982. Figure 2-6 quantifies this drop; the involvement rate for drivers aged 16-20 in 1998 was only 41% of its 1982 level, while the rate for drivers aged 25-54 was 57% of its 1982 level.
Figure 2-5 Age 0 10 20 30 82 84 86 88 90 92 94 96 98 Year 16-20 21-24 25-54
Drinking Drivers in Fatal Crashes
Rate per 100,000 population
Source: FARS
Youth drinking also decreased from 1982 to 1998 but not by as much as youth drinking and driving. Evidence from Monitoring the Future(Johnson et al, 1999) and other surveys shows a consistent drop in self-reported drinking across the coun-try by both high school and college students. However, while most young people drink less than they used to, they do continue to drink. A majority drink at least monthly and a substantial minority binge drink regularly.
This decline in drinking accounts for some, but by no means all, of the decline in drinking and driving. Young people separated their drinking from their driving
Figure 2-6 0% 20% 40% 60% 80% 100% 82 84 86 88 90 92 94 96 98 Year 16-20 21-24 25-54
Drinking Drivers in Fatal Crashes
Population rate - change from 1982
Source: FARS
Age
more in 1998 than they did in 1982 and more than have drivers over 21. Drinking and driving has become less socially acceptable among young people as measured by student attitudes and by the use and acceptance of designated drivers.
Figure 2-7 illustrates these conclusions. Beginning in 1984, the Monitoring the Future surveys included questions on drinking and driving behavior. These data make it possible to compare self-reported drinking, self-reported drinking and driving, and fatal crash involvement. Figure 2-7 shows that self-reported drinking and driving followed the fatal crash involvement trend very closely through about 1995. Since 1995, self-reported drinking and driving has increased somewhat but fatal crash involvements have not. Both have decreased considerably more than has drinking. Figure 2-7 20% 40% 60% 80% 100% 84 86 88 90 92 94 96 98 Year Fatal crashes
Drive after drinking 30 day drinking
Youth Drinking, Driving, Fatal Crashes
Change from 1984
Two laws affecting young people helped to reduce their drinking and driving. Between 1983 and 1987, 36 states raised their minimum legal drinking age to 21 (the other 14 states had age 21 laws in effect before 1983). By 1988, all states had a legal drinking age of 21. These laws reduced youth drinking and driving (USGAO, 1987 and Toomey et al, 1996) even though young people can still obtain alcohol relatively easily and underage drinkers are rarely detected and punished. However, age 21 laws could not have been the only influence during the 1980s: Youth drinking and driving decreased substantially more than youth drinking, and throughout the 1980s both youth drinking and driving after drinking decreased in states that had age 21 laws.
Zero tolerance laws establish a maximum BAC of 0.02 or less for youth and suspend or revoke an offender’s driver’s license. Between 1990 and 1998, all states adopted zero tolerance laws covering all drivers under the age of 21. Zero tolerance laws also helped to reduce youth drinking and driving (Zwerling and Jones, 1999).
States, communities, and private organizations such as SADD (Students Against Driving Drunk, now Students Against Destructive Decisions) conducted extensive anti-drinking and driving programs aimed at young people during the past two decades. Few of their programs have been evaluated and there is no direct proof that most of the youth traffic safety programs that do not involve laws and enforcement had any direct effect on youth drinking and driving. However, there also is no proof that they did not. The accumulation of information, skills, role models, and the like may have been a crucial influence in the changes in young people’s attitudes, behav-ior, and crash statistics .
In general, states that reduced overall drinking and driving the most from 1982 to 1998 also reduced youth drinking and driving the most. This suggests that effec-tive measures to reduce overall drinking and driving also affect youth drinking and driving. In addition, the travel, employment, and unemployment trends that influ-enced overall drinking and driving probably also influinflu-enced youth drinking and driving.
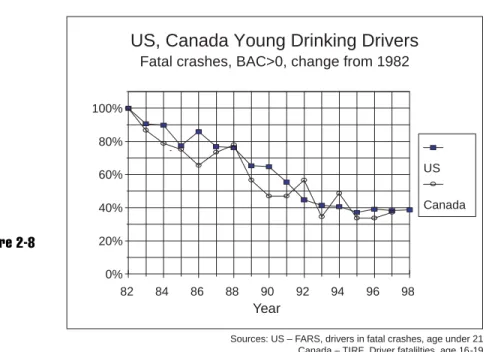
Decreases in youth drinking and driving in Canada, measured both by fatal crash data and surveys, were very similar to those in the United States as Figure 2-8 shows. However, the Canadian drinking age did not change and Canadian zero tolerance laws were implemented after the reduction had occurred. The changes must have resulted from some combination of the difficult-to-assess educational and motivational programs and from other factors not related to traffic safety. These same causes probably produced a substantial portion of the United States reduction.
In all, three influences on youth drinking and driving are well documented and understood: changes in population, increases in the legal drinking age, and zero tolerance laws. However, these three account for only part of the observed decrease in
Figure 2-8 0% 20% 40% 60% 80% 100% 82 84 86 88 90 92 94 96 98 Year US Canada
US, Canada Young Drinking Drivers
Fatal crashes, BAC>0, change from 1982
Sources: US – FARS, drivers in fatal crashes, age under 21 Canada – TIRF, Driver fatalilties, age 16-19
youth drinking and driving. Other factors, such as youth programs, other drunk driving measures, and factors unrelated to driving or drinking, must also have been important even though their effects have not been measured.
Conclusions
The different experiences across states and age groups suggest three important conclusions.
INTANGIBLEINFLUENCES.
Not all important factors have been measured and evaluated. Some, such as population changes, economic influences, laws, sanctions, and enforcement activity, are measurable, but other factors that cannot be quantified or evaluated as precisely must also have been influential. The state comparisons explicitly concluded that leadership, funding, and overall commitment to reducing drunk driving were impor-tant. The age group comparisons showed that Canadian reductions in youth drinking and driving were very similar to those in the United States but cannot be explained by drinking age or zero tolerance laws, the two factors given credit for much of the decrease in the United States. Recommendations for future policies and programs should build on measures with solid evidence of effectiveness but must also include intangible factors such as leadership and commitment.
MULTIPLESTRATEGIES.
There is no single solution to drunk driving. No one law, policy, or program will “solve” the problem. No single factor explained why some states were more successful than others or why drinking and driving decreased more among young people than among adults. Progress was, and will continue to be, made through the accumulated effects of many strategies, each adding its bit to the whole.
PUBLICPRIORITY.
The most critical factor may be public priority and urgency. During the 1980s, reducing drunk driving became a key social priority. Media attention, political leadership, legislation, funding, and increased law enforcement soon followed. There are complex causal relationships among these forces; for example, social priorities influence media attention and political leadership, which in turn influence media coverage. The single most important conclusion from the drunk driving experiences of the past 20 years may well be that the best way to achieve substantial reductions is to make drunk driving once again a burning, urgent social issue.
CHAPTER 3
Status — Drunk driving in the
United States 2000
This chapter describes the current drunk driving problem in the United States and examines how it has changed over the past 20 years. The chapter is based on data from fatal crashes, DWI offenders, and roadside and telephone surveys.
Fatal crash data
The most extensive data on drunk drivers come from NHTSA’s FARS and describe drivers involved in fatal crashes. These data provide the best evidence on drunk driving levels and trends from 1982, when FARS began reporting alcohol information on all fatal crashes, through 1999, the last year available. FARS uses actual BAC test data when available and estimates BAC levels in three categories, 0.00, between 0.01 and 0.09, and 0.10 and above, for drivers and non-occupants with no known BAC test results. See Klein (1986) for details on FARS estimation methods.
FARS reports alcohol involvement in several ways. The broadest is by counting all alcohol-related traffic fatalities — those in which at least one driver or non-occupant (usually a fatally injured pedestrian) was estimated to have a positive BAC. In 1999, 38% of all traffic fatalities were alcohol-related as shown in Figure 1-2.
Since this report studies drunk drivers, a more useful way is to count drunk drivers in fatal crashes. The best approximation of drunk drivers in FARS is those drivers with a BAC of 0.10 or above. In 1999, 17% of all drivers in fatal crashes had a BAC of 0.10 or above as shown in Figure 1-4.
DRUNKDRIVERSIN FATAL CRASHES, 1982 AND 1999.
Drunk drivers in fatal crashes had a higher average age in 1999 than they did in 1982 but were otherwise quite similar. Table 3-1 compares drunk drivers in fatal crashes in 1982 and 1999. The table gives both the absolute number of drunk drivers in each category and also the distribution of drunk drivers across the categories.
The greatest change from 1982 to 1999 was a substantial decrease in young drunk drivers, as noted in Chapter 2. The number of drunk drivers under the age of 21 in fatal crashes fell by 64% from 1982 to 1999 and the number of drunk drivers
Table 3-1
Number of Drivers Driver Distribution
Driver Characteristics 1982 1999 1982 1999 Age: < 21 3,100 1,110 19 % 12 % 21-34 8,793 4,281 54 % 45 % 35-54 3,386 3,440 21 % 36 % > – 55 1,069 741 7 % 8 % Gender: male 14,377 8,126 87 % 85 % female 2,016 1,470 13 % 15 % Prior DWI: 0 14,230 8,313 91 % 89 % 1 1,179 899 8 % 10 % 2 285 167 2 % 2 % Drunk Drivers in Fatal Crashes (BAC >– 0.10), 1982 and 1999
> – Table 3-2 Age: < 21 4,393 1,687 21 % 13 % 21-34 11,144 5,583 53 % 44 % 35-54 4,240 4,367 20 % 34 % 55 1,430 1,079 7 % 8 % Gender: male 18,531 10,702 87 % 84 % female 2,738 2,062 13 % 16 % Prior DWI: 0 18,683 11,226 92 % 90 % 1 1,378 1,060 7 % 8 % 2 316 194 1 % 2 % Drinking Drivers in Fatal Crashes (BAC > 0.00), 1982 and 1999
Number of Drivers Driver Distribution
Driver
Characteristics 1982 1999 1982 1999
>–
> –
aged 21 to 34 dropped by 51%, while the number of drunk drivers aged 35-54 rose by 2%. In 1999, less than one-eighth of drunk drivers in fatal crashes were under 21 years old.
Table 3-2 provides similar data for drivers in fatal crashes that have any positive BAC. The trends are virtually identical as are the distributions. Note that the number of drivers in each category of Table 3-1 is about three-quarters as large as the corre-sponding number in Table 3-2 in both 1982 and 1999. This means that about three-quarters of the drinking drivers in fatal crashes had a BAC of 0.10 or above. As expected, the youngest drivers more frequently had low BACs, while drivers with prior DWI convictions more frequently had high BACs.
The prior DWI data in these tables require some explanation. FARS counts only DWI convictions. It does not count drivers who were arrested but not convicted or those convicted of some lesser offense. In addition, it counts only convictions on the state’s records for the preceding three years. States that record DWI convictions over a longer period of time or convictions for lesser offenses can show considerably higher repeat offender levels. For example, California reported that 28% of all drivers in related fatal crashes in 1997 had a prior conviction for DWI or alcohol-related reckless driving (Tashima and Helander, 2000).
Both the number of drinking drivers in fatal crashes and the proportion of all drivers in fatal crashes who had been drinking dropped substantially from 1982 to 1999. However, the BAC distribution of drinking drivers changed very little as the comparison of Tables 3-1 and 3-2 suggests. To investigate the BAC distributions more closely, Table 3-3 gives data for drivers aged 21 and older from 15 states that consistently report high BACs.
BAC Levels for Driver Fatalities (Age >– 21), 1982 and 1999, 15 Good Reporting States Number of Drivers % Change .01 - .09 444 291 - 34 % 18 % 20 % .10 - .14 398 247 - 38 % 16 % 17 % .15 - .19 604 352 - 42 % 24 % 24 % .20 1035 598 - 42 % 42 % 40 % Driver Distribution Driver BAC 1982 1999 1982 1999 >– Table 3-3
Table 3-3 shows that the reductions for drivers age 21 and older occurred at all BAC levels. The number of drivers at high and low BAC levels decreased at similar rates, with the number of high-BAC drivers decreasing slightly more.
In summary, while the number of drunk drivers involved in fatal crashes was substantially less in 1999 than in 1982, driver characteristics over this period were largely unchanged. The one substantial difference was the remarkable drop in young drunk drivers.
DRUNKDRIVERSIN FATAL CRASHES BYSTATE, 1999.
Drunk driver involvement in fatal crashes differed substantially from state to state. In 1999, only 9.1% of drivers in fatal crashes in New York State were drunk (with a BAC of 0.10 or above). Table 3-4 shows that seven states had proportions below 15%: five along the eastern seaboard from New York to Florida, Iowa in the mid-west, and Utah in the mountains. Most are fairly large states measured both by land area and population.
Drivers Involved in Fatal Crashes, by State and Alcohol Involvement, 1999
State Total Drunk Pct State Total Drunk Pct
1 New York 2,077 190 9.1 27 Oregon 568 106 18.7
2 Utah 434 47 10.8 28 Missouri 1,489 278 18.7
3 Maryland 859 103 12.0 29 Rhode Island 117 22 18.8
4 Georgia 2,077 280 13.5 30 Alabama 1,513 286 18.9
5 Florida 4,201 587 14.0 31 Tennessee 1,748 332 19.0
6 Iowa 701 98 14.0 32 Nebraska 398 76 19.1
7 North Carolina 2,114 309 14.6 33 District of Columbia 57 11 19.3
8 New Jersey 989 150 15.2 34 Idaho 347 67 19.3
9 Arkansas 784 120 15.3 35 Pennsylvania 2,124 415 19.5
10 California 4,590 712 15.5 36 Illinois 2,030 401 19.8
11 South Carolina 1,410 219 15.5 37 New Hampshire 188 38 20.2
12 Indiana 1,395 217 15.6 38 Connecticut 397 82 20.7
13 Minnesota 912 142 15.6 39 Wyoming 210 45 21.4
14 Ohio 2,014 315 15.6 40 Massachusetts 570 123 21.6
15 Oklahoma 961 154 16.0 41 Mississippi 1,214 262 21.6
16 Arizona 1,383 226 16.3 42 Washington 841 185 22.0
17 Kansas 700 115 16.4 43 New Mexico 559 125 22.4
18 Colorado 839 138 16.4 44 Louisiana 1,208 275 22.8
19 Delaware 152 26 17.1 45 Wisconsin 1,012 233 23.0
20 Virginia 1,159 199 17.2 46 Texas 4,782 1,102 23.0
21 Maine 256 44 17.2 47 Hawaii 141 33 23.4
22 Michigan 2,000 347 17.4 48 South Dakota 193 49 25.4
23 Vermont 112 20 17.9 49 North Dakota 143 37 25.9
24 Nevada 458 82 17.9 50 Alaska 101 27 26.7
25 Kentucky 1,057 193 18.3 51 Montana 254 80 31.5
26 West Virginia 513 95 18.5
United States 56,351 9,818 17.4
Table 3-4
of New York. Seven states had proportions above 23%: four across the northern border from Wisconsin to Montana, Texas in the southwest, and Alaska and Hawaii in the Pacific Rim. The four states with the highest proportions have small popula-tions (each well under 1 million) spread thinly across large geographic areas.
Many states acquire BAC test data only for a small portion of surviving drivers in fatal crashes. Thus, the results for individual states may not be completely accu-rate. However, the patterns in Table 3-4 suggest that there are geographic and demo-graphic differences between states with low and high proportions of drunk drivers in fatal crashes, in addition to the factors of drunk driving laws, enforcement, educa-tion, leadership, and commitment that were identified in Chapter 2.
Roadside survey data
Three national roadside surveys over the past 25 years have provided the best objective data on drunk drivers who were not involved in crashes (Voas et al, 1998). The surveys were conducted in 1973, 1986, and 1996 in similar locations across the country selected through a multistage probability sample. In each location, each survey interviewed and breath-tested a random sample of drivers between 10:00 pm and 3:00 am on Friday and Saturday nights when heavy drinking is most likely to occur and when alcohol-related crashes are most frequent. The 1996 survey obtained breath tests for 96% of the 6,298 drivers who were stopped. Passive alcohol sensor readings were used to estimate BAC levels for those drivers for whom breath tests were not obtained.
Table 3-5
Driver BAC Levels, Weekend Nights, 1986 and 1996, National Roadside Surveys
Percent of Drivers BAC Interval 1986 1996 < 0.004 74.1 % 83.1 %* 0.005 - 0.04 17.6 % 9.2 %* 0.05 - 0.09 5.2 % 5.0 % >– 0.10 3.2 % 2.8 % * p<0.05, 1986 v. 1996
Table 3-5 compares the 1986 and 1996 survey results. The number of drinking drivers decreased substantially, from 25.9% in 1983 to 16.9% in 1996, but most of the change was at BAC levels below 0.05. The proportion of drivers above 0.05 decreased only slightly, and the change was not statistically significant. Table 3-5 also shows that in 1996 about 16% of the drivers with any positive BAC had a level of 0.10 or above.
Table 3-6
Driver BAC Levels by Age, Weekend Nights, 1986 and 1996, National Roadside Surveys
Percent of Drivers BAC >– 0.05 Driver Age 1986 1996 1986 1996 < 21 4.6 % 2.8 % 2.7 % 0.3 %* 21-34 9.9 % 11.3 % 3.3 % 3.8 % 35-44 9.4 % 6.9 % 4.7 % 3.7 % >– 45 6.8 % 5.2 % 1.8 % 1.7 % * p<0.05, 1986 v. 1996 BAC >– 0.10
The roadside surveys recorded drivers’ ages. Table 3-6 compares the proportions of drinking drivers by age in 1986 and 1996. Table 3-6 shows a very substantial and statistically significant decrease in the proportion of drivers under the age of 21 with BACs above 0.10, with no significant changes for other age groups. This adds to the evidence from FARS that drunk driving has dropped more among drivers under the age of 21 than among older drivers.
DWI offender data
Between 1995 and 1997 the Bureau of Justice Statistics (USDOJ, 1999) con-ducted nationwide personal interview surveys of DWI offenders on probation, in
local jails, and in state prisons. The Bureau also reported national and statewide DWI arrest data.
The number of DWI arrests nationwide dropped 24% from 1,810,800 in 1990 to 1,384,600 in 1994. Arrests have increased steadily since then to 1,549,500 in 1999, still 14% below the 1990 level. Across the states, arrests per 100,000 licensed drivers in 1997 ranged from 306 to 1385. Arrest rates per licensed driver decreased from 1991 to 1997 in 30 of the 33 states with available data.
The Bureau of Justice Statistics estimated that 513,200 DWI offenders were on probation or incarcerated in 1997, compared to 1,477,300 DWI arrests. The Bureau’s survey results thus describe the approximately one-third of DWI offenders who received the most severe sanctions.
In 1997, one-third (33%) of all DWI offenders on probation or in jail reported at least one prior DWI conviction. Based on their reported drinking prior to their DWI arrest, their average estimated BAC level when arrested was about 0.20.
About 37% of all offenders reported signs of alcohol dependency, determined by three or more “yes” responses on the CAGE scale used to screen for drinking prob-lems (defined in the Glossary). Many had a history of alcohol probprob-lems not related to driving; over three-quarters had been arrested or detained at a police station because of drinking, and about 60% had received some form of alcohol treatment or had participated in a self-help program.
More detailed studies have found higher alcohol dependency rates among DWI offenders. For example, Lapham et al (forthcoming) found that 85% of all female
DWI Offender BAC Levels and Prior Offenses, State Data
State Year Population Average BAC Prior DWI
California 1997 Convicted 95 % 0.16 29 % Connecticut 1997 Arrested 0.17 Delaware 1999 Arrested 93 % Illinois 1998 Arrested 92 % 0.16 Maine 1998 0.16 Minnesota 1999 Incidents: 10 years Lifetime 35 % 43 % New York 1999 Arrested
Convicted 91 % 27 % Wisconsin 1999 Arrested Convicted 95 % 35 % BAC >– 0.10 Arrested Table 3-7
and 91% of all male convicted DWI offenders in Bernalillo County, New Mexico, were or had been alcohol abusers or alcohol dependent.
State data provide additional information on these issues. Table 3-7 presents data from eight arbitrarily selected state annual reports. The data show that virtually all drivers arrested for or convicted of DWI had BAC levels above 0.10, with an average BAC across the states of about 0.16. The proportion with a prior alcohol-related offense ranged from about 25% to 45%. Some of this variation is caused by differing procedures among the states, including how long records are retained, whether a DWI conviction can be removed in certain circumstances, and whether lesser of-fenses to which a DWI charge may be reduced or implied consent violations are recorded as prior offenses. Proportions of BAC levels and prior offenses generally agree with the Bureau of Justice Statistics survey results. Minnesota reported that 10% of all licensed drivers had one or more impaired driving incidents on their record (Minnesota, 2001).
Telephone survey data
NHTSA has conducted a national telephone survey of drinking and driving attitudes and behavior every two years since 1991. The 1999 survey report (Royal, 2000) provides a snapshot of the public’s current views and how they have changed over the past eight years. Reported drinking and driving frequencies may be underes-timated if some respondents have not answered accurately.
DRINKINGANDDRIVING FREQUENCYAND CHARACTERISTICS.
About 21% of the respondents reported that they had driven after drinking in the preceding two hours at least once in the past year, and 12% reported driving after drinking in the previous month. As a comparison, 27% of the respondents reported driving after drinking in the previous year in the 1996 household survey of drug abuse (Townsend et al, 1998). In 1999, drinking drivers made an estimated 957 million drinking-driver trips.
Most of the drinking drivers reported drinking in amounts that produce BAC levels below legal limits. Royal estimated that 5% of the drinking drivers would have been at or above 0.08 BAC the last time they drove after drinking and another 8% would have been between 0.05 and 0.08. (Townsend, et al., estimated that 7% of the drivers exceeded 0.08.) Measured by trips instead of drivers, 10% of the drinking-driver trips were at or above 0.08 BAC and another 8% were between 0.05 and 0.08. Drivers with a BAC of 0.08 or above made about 82 million trips in 1999.
About 23% of the drinking drivers, or about 5% of all drivers, were estimated to be problem drinkers, determined by two or more “yes” responses on the CAGE scale or by frequent binge drinking. They accounted for 41% of all drinking-driver trips. The proportion of drinking drivers aged 16-64 who are problem drinkers has risen steadily and substantially from 12% in 1993 to 18% in 1995 and 1997 to 23% in 1999.