i
Improvement and remission of prediabetes and type 2 diabetes mellitus following laparoscopic sleeve gastrectomy
by
© Kendra Kristina Lester A Thesis submitted to the School of Graduate Studies
in partial fulfillment of the requirements for the degree of
Master of Science in Medicine
Clinical Epidemiology Unit, Faculty of Medicine Memorial University of Newfoundland
October 2014
ii
ABSTRACT
Purpose: To determine the proportion of patients experiencing improvement or remission of prediabetes or type 2 diabetes mellitus (T2DM) 12 months following laparoscopic sleeve gastrectomy (LSG).
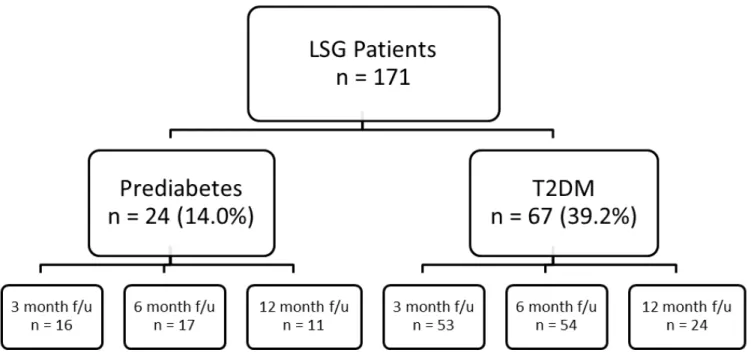
Methods: From May 2011 to September 2013, 171 patients underwent LSG and consented to participate in the study. Based on laboratory values, medical history, and antidiabetic medication use, 24 (14.0%) patients had prediabetes and 67 (39.2%) had T2DM. Re-evaluation of laboratory values and medication use was conducted at 3, 6, and 12 months post-surgery to assess for changes in glycemic control and diabetes status.
Results: Of 11 prediabetic patients that returned 12 months post-surgery, 9 (81.8%) achieved remission of prediabetes. 6 of 24 (25%) T2DM patients that returned for 12 month follow-up achieved remission and 5 (20.8%) experienced improvement of T2DM.
Conclusions: Obese patients may experience improvement or remission of prediabetes or T2DM within 12 months following LSG. The mechanisms by which improvement or remission occur are not fully understood. More research is needed to determine the long-term implications of LSG on T2DM complications, prevalence, mortality, etc. before it can be considered as a treatment for prediabetes or T2DM.
iii
ACKNOWLEDGEMENTS
I would like to sincerely thank everybody who supported me over the course of my graduate program.
A sincere and heartfelt thank you to my supervisor, Dr. Laurie Twells and my co-supervisor, Dr. Debbie Gregory for your support and encouragement over the last two years. You have both provided me with a truly unique and well-rounded experience as a graduate student and have helped me grow both professionally and personally. I have learned more than I ever thought possible in just two years! Thank you.
I acknowledge the assistance and expertise provided to me by the members of my supervisory committee, Dr. Christopher S. Kovacs and Dr. J.M. Gamble, who provided me with feedback and direction throughout this project.
I would like to acknowledge the Newfoundland and Labrador Centre for Applied Health Research for funding this research project through a Master’s Fellowship. I also thank the team at the Major’s Path Diabetes Clinic for allowing me to attend educational sessions to learn more about type 2 diabetes mellitus.
I would also like to acknowledge Dr. William Midodzi for helping to guide me with my statistical analysis throughout the course of this project.
I would like to acknowledge the assistance provided to me by the Bariatric Surgery Multi-Disciplinary Care Clinic at Eastern Health and the Translational Research Program in Bariatric Care, particularly Kimberly Manning and Dr. Justin Peddle for
iv
working closely with me to provide me with patient data and to help with data entry surrounding medication use.
A sincere thank you to all the bariatric surgery patients who consented to participate in this study and made this research possible.
I would also like to thank everyone who works in the Patient Research Centre for coffee breaks, support, and friendship. I would not have gotten through writing without all of you!
This thesis is dedicated to my parents, Wade and Patricia Lester who have provided me with endless support throughout my academic endeavors and have always believed in me. I couldn’t have done this without you. And to John for your patience and support while I was writing my thesis and who has learned more about obesity, diabetes, and bariatric surgery than he ever thought he would!
v
TABLE OF CONTENTS
ABSTRACT ... ii
ACKNOWLEDGEMENTS ... iii
TABLE OF CONTENTS ... v
LIST OF TABLES ... viii
LIST OF FIGURES ... x
LIST OF ABBREVIATIONS ... xi
Chapter 1: Introduction ... 1
1.1 Background and Rationale ... 1
1.2 Purpose ... 9
Chapter 2: Literature Review ... 11
2.1 Epidemiology of Obesity ... 11
2.1.1 Global trends. ... 11
2.1.2 Obesity in Canada. ... 12
2.1.3 Obesity in Newfoundland and Labrador... 13
2.2 Obesity: Etiology & Health Risk ... 14
2.3 Epidemiology of Prediabetes & Type 2 Diabetes Mellitus ... 18
2.3.1 Global Trends in T2DM. ... 18
2.3.2 T2DM in Canada. ... 19
2.3.3 T2DM in Newfoundland and Labrador. ... 20
2.4 Prediabetes & Type 2 Diabetes Mellitus: Diagnostic Criteria, Etiology, & Health Risk. ... 20
2.5 Obesity & Type 2 Diabetes Mellitus ... 28
2.6 Weight Management in Prediabetes & Type 2 Diabetes Mellitus ... 30
2.7 Bariatric Surgery ... 31
2.7.1 Bariatric Surgery in Newfoundland and Labrador. ... 34
vi
2.7.3 Effects of LSG vs. LAGB & RYGB on Improvement or Remission of T2DM.
... 35
2.7.4 LSG & Remission of T2DM. ... 38
2.7.5 How Does LSG Work? ... 43
2.7.6 Remission of Type 2 Diabetes Mellitus: Definition & Predictors. ... 46
2.8 Summary of Gaps in the Clinical Literature ... 50
Chapter 3: Methods ... 51
3.1 Population and Sample ... 51
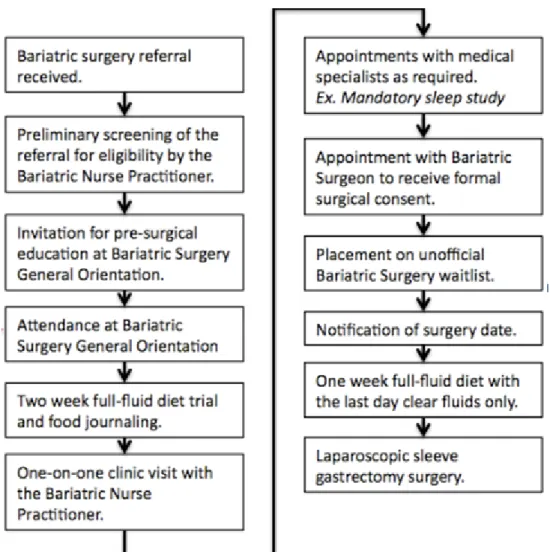
3.2 Procedure ... 52
3.3 Defining Primary Outcome Measures of Prediabetes & T2DM ... 56
3.3.1 Prediabetes. ... 57
3.3.2 T2DM. ... 57
3.3.3 Case Definitions of Improvement and Remission of Prediabetes and T2DM... 58
3.4 Data Analysis ... 61
3.4.1. Baseline Demographics. ... 61
3.4.2. Analysis of the Primary Outcomes. ... 61
3.4.3 Analysis of the Secondary Outcomes. ... 62
3.5 Privacy & Ethical Considerations ... 65
Chapter 4: Results ... 67
4.1 Baseline Demographics, Comorbidity Profile, & Laboratory Values ... 67
4.2 Prediabetes: Results ... 73
4.2.1 Proportion of Patients Achieving Improvement or Remission. ... 73
4.2.2 Changes in Glycemic Measures... 73
4.3 T2DM: Results ... 76
4.3.1 Proportion of Patients Achieving Improvement or Remission. ... 76
4.3.2 Changes in Glycemic Measures... 77
4.4 Baseline Factors Associated with Remission of Prediabetes and T2DM ... 79
4.5 Association of weight loss with changes in FPG, A1c, triglycerides, HDL, LDL, and total cholesterol and overall remission of prediabetes and T2DM ... 82
vii
4.6 Secondary Outcomes: Changes in Weight, Blood Pressure, Triglycerides and
Cholesterol, and Changes in Antidiabetic Medication Use ... 86
Chapter 5: Discussion ... 96
5.1 Baseline Demographics, Comorbidity Profile, & Laboratory Values ... 96
5.2 Prediabetes ... 98
5.2.1 Proportion of Patients Achieving Improvement or Remission of Prediabetes. . 98
5.2.2 Changes in Glycemic Measures... 99
5.3 T2DM ... 100
5.3.1 Proportion of Patients Achieving Improvement or Remission of T2DM... 100
5.3.2 Changes in Glycemic Measures... 102
5.4 Factors Associated with Remission of Prediabetes and T2DM ... 105
5.5 Secondary Outcomes: Changes in Weight, Blood Pressure, Triglycerides, Cholesterol, and Antidiabetic Medication Use... 106
Chapter 6: Strengths and Limitations, Clinical Implications and Knowledge Translation, Future Research, and Conclusions ... 114
6.1 Strengths and Limitations ... 114
6.2 Clinical Implications and Knowledge Translation ... 118
6.3 Future Research ... 120
6.4 Conclusions ... 120
REFERENCES ... 122
viii
LIST OF TABLES
Table 2.1 BMI Classification for Adults and Associated Risk of Comorbidities…..17
Table 2.2 Diagnostic Criteria for Prediabetes………22
Table 2.3 Diagnostic Criteria for Type 2 Diabetes Mellitus………..23
Table 2.4 Baseline Characteristics of Studies Included in the Systematic Review and Recent Studies………41
Table 2.5 Laparoscopic Sleeve Gastrectomy Outcomes for Studies Included in the Systematic Review and Recent Studies………..42
Table 2.6 Summary of Consensus Group Definitions of Remission of Type 2
Diabetes Mellitus………47
Table 3.1 Case Definitions of Improvement and Remission of Prediabetes………..59
Table 3.2 Case Definitions of Improvement and Remission of Type 2 Diabetes Mellitus………...60
Table 4.1 Baseline Demographics………..70
ix
Table 4.3 Univariate Association of Selected Baseline Factors with Remission of Prediabetes Following LSG (n=11)………80
Table 4.4 Univariate Association of Selected Baseline Factors with Remission of T2DM Following LSG (n=24)………...81
Table 4.5 Univariate Association of changes in blood pressure and selected laboratory values with weight loss 12 months following LSG in
prediabetic patients (n=11)………...……..84
Table 4.6 Univariate Association of changes in blood pressure and selected
laboratory values with weight loss 12 months following LSG in diabetic patients (n=24)………...……….85
Table 4.7 Changes in Weight, BMI, Blood Pressure, Triglycerides, and Fasting Lipid Panel in Patients with Prediabetes and T2DM………...88
Table 4.8 Changes in Antidiabetic Medication Use Before and After Patients with T2DM Underwent LSG………..93
Table 4.9 Changes in Statin Use Before and After Patients with T2DM Underwent LSG………..……..95
x
LIST OF FIGURES
Figure 3.1 The pre-surgical process for patients from referral for bariatric surgery to undergoing laparoscopic sleeve gastrectomy……….55
Figure 4.1 Patients who had undergone LSG by the end of September 2013 divided into prediabetes and T2DM cohorts and their attendance of follow-up appointments………..69
Figure 4.2 Changes in fasting plasma glucose (FPG, mmol/L) and glycated
hemoglobin (A1c, %) in prediabetic patients……….75
Figure 4.3 Changes in fasting plasma glucose (FPG, mmol/L) and glycated
hemoglobin (A1c, %) in patients with T2DM………78
Figure 4.4 T2DM cohort, changes in: a) BMI (kg/m2), b) A1c (%), and c)
xi
LIST OF ABBREVIATIONS
%AWL percent absolute weight loss %EWL percent excess weight loss 2hPG two hour plasma glucose A1c glycated hemoglobin
ADA American Diabetes Association BMI body mass index
BPD biliopancreatic diversion CDA Canadian Diabetes Association CK Dr. Christopher S. Kovacs DPP-4 dipeptidyl-peptidase-4 DS duodenal switch FPG fasting plasma glucose GIP gastric inhibitory polypeptide GLP-1 glucagon-like peptide-1 HDL high-density lipoprotein
IDF International Diabetes Federation IFG impaired fasting glucose
IGT impaired glucose tolerance
kg kilograms
KL Kendra Lester
LAGB laparoscopic adjustable gastric banding LDL low-density lipoprotein
xii
LRYGB laparoscopic Roux-en-Y gastric bypass
MONICA Monitoring of Trends and Cardiovascular Disease NL Newfoundland and Labrador
NL BaSco Newfoundland and Labrador Bariatric Surgery Cohort OGTT oral glucose tolerance test
p probability value PYY peptide-YY
RCT randomized controlled trial RYGB Roux-en-Y gastric bypass SD standard deviation
SPSS Statistical Package for the Social Sciences T2DM type 2 diabetes mellitus
TRPBC Translational Research Program in Bariatric Care WHO World Health Organization
1
Chapter 1: Introduction 1.1 Background and Rationale
Obesity is defined as a condition of abnormal or excessive fat accumulation in adipose tissue to such an extent that health may be adversely affected (WHO Consultation on Obesity, 2000). Obesity was recently recognized as a disease by the American Medical Association (American Medical Association, 2013) and is a risk factor for the
development of comorbid conditions such as hypertension, type 2 diabetes mellitus (T2DM), cardiovascular disease, osteoarthritis, sleep apnea, certain cancers, and premature mortality (Picot et al., 2009). The amount of excess fat, its distribution throughout the body, and the associated comorbidities can vary between individuals living with obesity (WHO Consultation on Obesity, 2000). Overweight and obesity are most commonly classified by an individual’s body mass index (BMI) and is calculated using an individual’s height and weight with units kg/m2 (WHO Consultation on Obesity, 2000). Overweight is defined as 25 kg/m2≤ BMI < 30 kg/m2, whereas obesity is defined as BMI ≥ 30 kg/m2
and is broken down by Health Canada into three separate classes, Class I (30 kg/m2≤ BMI < 35 kg/m2), II (35 kg/m2≤ BMI < 40 kg/m2), and III (BMI ≥ 40 kg/m2), with an increased risk of developing health problems as BMI increases (Health Canada, 2003).
BMI is an indirect surrogate measure of body fat commonly used in clinical settings and epidemiological studies (WHO Consultation on Obesity, 2000). It is useful as a crude measure of population-level weight status and a reasonably reliable screening tool, as it correlates highly with direct measure of excess fat and health risk (Belle et al.,
2
2007). However, the accuracy of BMI may vary on an individual level as it does not distinguish between fluid retention versus adiposity, cases of extreme height or muscle mass, ethnic differences on body composition, or the location of fat (WHO, 1995; Wellens et al., 1996). Alternatively, waist circumference is a convenient and simple measurement that correlates closely with BMI but is unrelated to height and is an approximate measurement of intra-abdominal fat mass and total body fat (WHO Consultation on Obesity, 2000).
Excess abdominal fat is a risk factor for high blood pressure, high cholesterol, T2DM, heart disease, and stroke (Heart & Stroke Foundation, 2010). Males and females with waist circumferences greater than 102 cm and 88 cm, respectively are at an
increased risk for developing health problems (Heart & Stroke Foundation, 2010). Decreases in waist circumference reflect decreases in risk factors for cardiovascular disease and other chronic diseases as mentioned above, though the risks vary in different populations (WHO Consultation on Obesity, 2000). Obesity, particularly abdominal obesity, is a well-known risk factor for the development of prediabetes and T2DM. Abdominal fat promotes the secretion of inflammatory chemicals from adipose cells which decreases insulin sensitivity by disrupting the function of insulin responsive cells and their ability to respond to insulin (Diabetes UK, 2014). Adipose tissue also secretes a large number of proteins such as adipsin/ASP and resistin, which decrease insulin
sensitivity (Lazar, 2005). This condition is known as insulin resistance and is a trigger for the development of T2DM (Diabetes UK, 2014).
3
Diabetes is a chronic condition considered by many to be the model chronic disease; it is progressive, managed rather than cured, and creates a burden on both patients and the health care system (Purnell & Flum, 2009). Diabetes can lead to long-term complications affecting the eyes, kidneys, and nerves (Goldenberg & Punthakee, 2013; Maggio & Pi-Sunyer, 2003) and adults with diabetes are two to four times more likely to have a stroke or develop heart disease (American Heart Association, 2012). The Canadian Diabetes Association (CDA) defines the clinical diagnosis of diabetes as based on blood glucose levels, specifically a 2-hour plasma glucose in a 75g oral glucose tolerance test (2hPG in a 75g OGTT) ≥ 11.1 mmol/L, or levels of fasting plasma glucose (FPG) ≥ 7.0 mmol/L, or glycated haemoglobin (A1c) ≥ 6.5% (Goldenberg & Punthakee, 2013). There are three main types of diabetes, type 1 diabetes, T2DM, and gestational diabetes with T2DM being the most common worldwide [International Diabetes Federation (IDF), 2013].
T2DM is a multifactorial disease characterized by high blood glucose levels resulting from the body’s inability to produce, secrete, or use insulin properly (Abbatini et al., 2012; Canadian Diabetes Association, 2014; Goldenberg & Punthakee, 2013). The development of T2DM is characterized by resistance to insulin action but it is also associated with progressive β-cell failure in the pancreas and impaired actions of the incretin hormones (Abbatini et al., 2012; Opinto et al., 2013; Zimmet & Alberti, 2012). Incretins, namely glucagon-like-peptide-1 (GLP-1) and glucose-dependent insulinotropic polypeptide (GIP), are gastrointestinal hormones that stimulate a decrease in blood glucose levels by causing the β-cells in the pancreas to secrete insulin (Opinto et al.,
4
2013). Incretins also regulate postprandial glucose disposal through the inhibition of glucagon secretion and delayed gastric emptying (Opinto et al., 2013). Furthermore, GLP-1 has an inhibitory effect on appetite and food intake and its impaired effects in individuals with T2DM may explain why the majority of patients with diabetes are overweight or obese (Gutzwiller et al., 1999). While there does not appear to be a major secretory defect in GIP secretion in diabetic patients, the actions of GIP are severely impaired (Opinto et al., 2013). On the other hand, there is a decreased secretion of GLP-1 in diabetic patients, particularly following ingestion of a mixed meal as well as a reduced potency in the insulinotropic effects of GLP-1 in patients with T2DM (Opinto et al., 2013).
In both 1997 and again in 2003, the American Diabetes Association’s Expert Committee on Diagnosis and Classification of Diabetes Mellitus identified a group of individuals whose glucose levels were elevated from normal but not enough to meet the criteria for the diagnosis of T2DM [American Diabetes Association (ADA), 2013]. These individuals were referred to as having impaired fasting glucose (IFG) or impaired glucose tolerance (IGT). IFG is defined as FPG levels ranging from 6.1 mmol/L to 6.9 mmol/L while IGT is defined as 2hPG in a 75g OGTT levels between 7.8 mmol/L and 11.0 mmol/L (Goldenberg & Punthakee, 2013). The condition of IGT is more strongly associated with cardiovascular disease outcomes than is IFG (Goldenberg & Punthakee, 2013). These conditions of IFG and IGT are now commonly known as prediabetes (ADA, 2013; Goldenberg & Punthakee, 2013). Individuals living with prediabetes are considered to be at a relatively high risk for developing T2DM and cardiovascular disease in the
5
future; however, not all individuals with prediabetes will progress to T2DM (ADA, 2013; Goldenberg & Punthakee, 2013).
Preventing, or delaying, the onset of T2DM in high-risk individuals and those living with prediabetes is possible. The Diabetes Prevention Program research group studied the effects of lifestyle modifications and metformin use in reducing the incidence of T2DM in patients with elevated glycemic levels (Knowler et al., 2002). The results of this study found that both lifestyle modification and the use of metformin reduced the incidence of T2DM in prediabetic patients with lifestyle modification being more effective than the use of metformin (Knowler et al., 2002). It follows that both the CDA and the American Diabetes Association (ADA) recommend lifestyle modifications including a 5-7% loss of body weight as well as regular physical activity (150min/week) to prevent the progression of prediabetes to T2DM, with the use of metformin being recommended for very high-risk individuals (ADA, 2013; Ransom et al., 2013).
A patient-centred approach to the management of T2DM is stressed by organizations worldwide. While some individuals are able to manage their diabetes through lifestyle modifications, particularly weight loss and physical activity, the majority of individuals require pharmacological intervention (Zimmet & Alberti, 2012). The initial recommended treatment, if not contraindicated, is metformin; but due to the progressive nature of T2DM most individuals will require the use of multiple medications and then eventually insulin therapy (ADA, 2013; Harper et al., 2013).
6
T2DM is closely associated with obesity. The prevalence of T2DM and obesity are increasing in parallel worldwide and an estimated 90% of individuals living with T2DM are overweight or obese (Abbatini et al., 2012; Maggio & Pi-Sunyer, 2003; Zimmet & Alberti, 2012). From a global perspective, it is estimated that 382 million people or 8.3% of the adult population worldwide are living with diabetes (IDF, 2013) while 35% of the world’s adults are overweight and 12% are obese (WHO Global Health Observatory, 2014). From a Canadian perspective, Newfoundland and Labrador (NL) has the highest prevalence of both diabetes [Canadian Diabetes Association (CDA), 2010a] and obesity (Twells et al., 2014) in the country, 9.3% and 27.7% respectively. Recently, bariatric surgery was recommended as an innovative treatment option for the
management of T2DM in obese patients (Buchwald & Oien, 2013; Mechanick et al., 2013; Wharton et al., 2013).
Bariatric surgery is currently the most effective and sustainable treatment for obesity and is one of the most commonly performed gastrointestinal procedures
worldwide (Buchwald & Oien, 2013; Mechanick et al., 2013). There are many different types of bariatric surgical procedures and they can be classified as being restrictive, malabsorptive, or a combination of both. With respect to surgical technique, there has been a shift towards performing surgeries laparoscopically as opposed to open surgery as it decreases time spent in the hospital as well as recovery time for patients. Some of the more popular procedures are gastric bypass, biliopancreatic diversion, adjustable gastric banding, and laparoscopic sleeve gastrectomy (LSG).
7
LSG is a non-reversible, restrictive surgical procedure in which approximately 75%-80% of the stomach is removed, leaving behind a “sleeve” with a reduced gastric volume of 60-100 mL (Karmali et al., 2010; Porier et al., 2011). Once considered to be an investigational procedure, LSG has been growing in popularity amongst surgeons and patients and in 2013 was recommended as a primary bariatric and metabolic procedure to be performed in patients requiring weight loss and/or metabolic control (Mechanick et al., 2013). LSG has been shown to produce good short-term weight loss in patients. One randomized controlled trial found that patients lost 27.9% of their total body weight one year post-surgery (Victorzon, 2012). Clinically expected percent excess weight loss (%EWL) within 6 to 36 months following LSG is 45-60%, and occurs rapidly after surgery (Victorzon, 2012). A Canadian study, with an average follow-up time of 10 months (range: 2–23 months) found that patients had an average weight loss of 27.4 kg and experienced an average change in BMI of 10.4 kg/m2 (Behrens et al., 2011). In Canada, eligible patients for bariatric surgery are those with class II obesity (35 kg/m2≤ BMI ≤ 40 kg/m2
) and one or more obesity-related comorbidity or those with class III obesity (BMI ≥ 40 kg/m2
; Lau et al., 2007).
While the mechanism by which improvement or remission of T2DM occurs following bariatric surgery is complex and not fully understood, it appears to be due, in part, to weight loss. However, the degree of improvement does not always correlate with the amount of weight lost increasing the likelihood of the involvement of gut hormones and diet in comorbid resolution following surgery (Poirier & Auclair, 2014).
8
In May 2011, a new bariatric surgery program began offering residents of NL access to LSG in their own province. At the same time the Translational Research Program in Bariatric Care commenced with the aim of bringing together a team of
researchers, health care professionals, and policy and decision makers to design and carry out meaningful research projects to address gaps in the literature surrounding LSG, a relatively new stand-alone bariatric procedure. One of the emerging research projects was an inception cohort study [i.e., Newfoundland and Labrador Bariatric Surgery Cohort Study (NL BaSco study)]. The overall purpose of the study was to examine short-, mid-, and long-term clinical (weight loss and resolution of comorbidities), economic (health services use and costs), and quality of life outcomes in patients undergoing LSG in NL.
In 2011, when this study began, LSG was considered to be an investigational procedure with limited research on the outcomes of LSG with respect to weight loss, complications, and the effect on comorbid conditions such as T2DM (Mechanick et al., 2008). Although there are an increasing number of studies published on LSG outcomes there is a lack of Canadian data on this relatively new procedure. With the start of a bariatric program in NL there is a unique opportunity to study the short-, mid-, and long-term outcomes of LSG. With the recent shift in thinking of bariatric surgery as not only a treatment for obesity but also as a potential treatment for T2DM, this research will add to the current literature on the effectiveness of LSG in treating T2DM from a Canadian health care perspective.
9
1.2 Purpose
The primary purpose of this arm of the larger cohort study was to investigate the effectiveness of LSG in improving or inducing remission of prediabetes or T2DM in bariatric surgery patients living in NL by determining the proportion of patients
experiencing improvement or remission of prediabetes or T2DM 12 months post-surgery, taking into consideration the concomitant use of diabetes medications. A second purpose was to investigate changes in: (1) laboratory values including: FPG, A1c, fasting lipid panel, triglycerides; (2) blood pressure, weight; and (3) dosage and number of antidiabetic medications prescribed.
The study was designed to answer the following primary research questions:
1. What proportion of patients experience improvement or remission of prediabetes 12 months following LSG? What changes, if any, occur in levels of FPG and A1c in prediabetic patients 12 months following surgery?
2. What proportion of patients experience improvement or remission of T2DM 12 months following LSG? What changes, if any, occur in levels of FPG and A1c in patients with T2DM 12 months following surgery?
The secondary research questions addressed by this study were:
1. What baseline factors, if any, can be used to predict the likelihood of a patient achieving remission of prediabetes or T2DM 12 months post-surgery?
2. Is the amount of weight lost 12 months post-surgery associated with changes in blood pressure or levels of FPG, A1c, triglycerides, high-density lipoprotein
10
(HDL), low-density lipoprotein (LDL), or total cholesterol post-surgery? Is the amount of weight lost associated with remission of prediabetes or T2DM 12 months post-surgery?
3. What changes, if any, occur in weight, blood pressure, triglycerides, and fasting lipid panel levels, and dose and number of antidiabetic medications prescribed 12 months post-surgery?
11
Chapter 2: Literature Review
The purpose of this literature review is to review and summarize the gaps in the clinical literature on the remission or improvement of prediabetes and T2DM following LSG. First will be an overview of obesity, prediabetes, T2DM, and bariatric surgery from a global, national, and provincial perspective. Second will be a review of the literature comparing the effectiveness of LSG to other types of bariatric surgery in resolving T2DM followed by a review of the existing literature on the efficacy of LSG in resolving T2DM.
2.1 Epidemiology of Obesity
2.1.1 Global trends. The prevalence of overweight and obesity is increasing in both developed and developing countries (Stevens et al., 2012; WHO Consultation on Obesity, 2000). In 2008, 1 in 3 adults worldwide was overweight and 1 in 9 was obese (Stevens et al., 2012). A paper by Stevens et al. (2012) estimated trends in overweight and obesity in 199 countries and found that the age-standardized prevalence of obesity nearly doubled from 6.4% to 12.0% between 1980 and 2008, with half of this increase occurring in the last 8 years, from 2000 to 2008. During this same period, the global prevalence of overweight increased from 24.4% to 34.4%. Not only are obesity rates continuously rising globally, but the rate of growth appears to have accelerated in the last decade (Stevens et al., 2012).
Obesity rates vary by country and region. In 2008, the highest obesity prevalence was found in the regions of North Africa and Middle East, Central and Southern Latin America, Southern Sub-Saharan Africa, and North America with prevalences ranging from 27.4% to 31.1% (Stevens et al., 2012). Based on the most recent data available from
12
the World Health Organization (WHO), the countries with the highest percentage of obese adults (BMI ≥ 30 kg/m2
) were Nauru (78.5%), American Samoa (74.6%), and Tokelau (63.4%) (WHO, 2012a). The lowest percentage of obese adults was found in Vietnam (0.5%), India (0.7%), and Lao People’s Democratic Republic (1.2%) (WHO, 2012a). The WHO Monitoring of Trends and Cardiovascular Disease (MONICA) study reported that, in general, women have higher rates of obesity than men whereas men may have higher rates of overweight than women (WHO Consultation on Obesity, 2012).
2.1.2 Obesity in Canada. Obesity rates are rising in Canada. The prevalence of adult obesity (BMI ≥ 30 kg/m2
) increased from 6.1% in 1985 to 18.3% in 2011 (Twells et al., 2014). During this time the prevalence of all obese classes increased and
disproportionate increases were seen in the higher classes of obesity (Twells et al., 2014). Rates of overweight in Canada are also rising with an increase from 27.8% in 1985 to 33.6% in 2011 (Twells et al., 2014). Based on the most recent self-reported data available from Statistics Canada (2013), 62.0% of males and 45.1% of females in Canada are overweight or obese.
Just as obesity rates vary globally between countries and within regions, obesity rates in Canada vary by province and territory. Data of self-reported obesity rates in 2011 varied from a low of 14.5% in British Columbia to a high of 27.7% in Newfoundland and Labrador (Twells et al., 2014). In fact, the prevalence of obesity in all provinces and territories increased in the period between 2000/1 and 2011 (Twells et al., 2014). In general, lower prevalence rates of obesity were observed in western Canada compared to eastern Canada and from a regional perspective, the prevalence of obesity tends to be
13
lower in urban areas compared to rural areas (Twells et al., 2014). Similar trends have been reported in the prevalence of overweight in Canada, the lowest prevalence being 31.3% in British Columbia and the highest being 41.8% in Newfoundland and Labrador. In contrast, between 2000/1 and 2011 the provinces of Prince Edward Island, New Brunswick, and Alberta have experienced slight decreases in the prevalence of overweight individuals (Twells et al., 2014).
2.1.3 Obesity in Newfoundland and Labrador. NL has the highest prevalence of overweight and obesity in the country. In 2013, self-reported data from Statistics Canada indicated that 69.2% of the population was overweight or obese (Statistics Canada, 2013). A recent study by Twells et al. (2014) using data from the Statistics Canada Canadian Community Health Surveys reported that in 2011 the prevalence of obesity in NL was 27.7%, indicating that approximately 1 in 3 adults was obese (BMI ≥ 30 kg/m2). In ten years, between 2000/1 and 2011, the prevalence of overweight increased from 38.2% to 41.8% and the prevalence of obesity increased from 21.7% to 27.7% (Twells et al., 2014). This increase in the prevalence of obesity in the province was accompanied by an
increase in all three classes of obesity between 2000/1 and 2011 from 16.1% to 20.5% for obese class I, 4.1% to 4.6% for obese class II, and 1.5% to 2.6% for obese class III
(Twells et al., 2014). The most alarming prediction in the study by Twells and colleagues is that by 2019 an estimated 71% of the adult population in NL will be overweight or obese and increases in the prevalence of all obese classes are predicted.
14
2.2 Obesity: Etiology & Health Risk
Obesity is a disease in which excess body fat has accumulated to the extent that health may be adversely affected and can be viewed, conceptually, as the physical manifestation of chronic excess energy (Sharma & Padwal, 2010; WHO Consultation on Obesity, 2000). The etiology of obesity is complex and multifactorial and results from a range of etiologies that promote long-term positive energy balance (Lau et al., 2007; Sharma & Padwal, 2010). The relationship between body weight, energy intake and expenditure can be illustrated by a simple equation:
Energyintake – Energyexpenditure= Δ Body Weight
Multiple factors such as diet, metabolism, and physical activity contribute to an individual’s energy intake and expenditure, and a change in any of these factors, if not corrected, will result in a net imbalance of energy, which, if positive, will lead to weight gain (Sharma & Padwal, 2010). An individual’s metabolic rate, or resting energy
expenditure, is influenced by their age, gender, sarcopenia, neuroendocrine function, metabolically active fat, previous weight loss, and medication use (Sharma & Padwal, 2010). Increased energy intake by over-eating may be influenced by socio-cultural factors, mindless eating, a lack of knowledge about healthy eating, food availability, emotional over-eating, certain psychiatric disorders, sleep deprivation, and medication use (Sharma & Padwal, 2010). Physical inactivity is also a risk factor for weight gain and is influenced by socio-cultural factors, musculoskeletal pain, injury, psychiatric disorders, and medication use (Sharma & Padwal, 2010). Lifestyle interventions, such as the
15
obesity; but, adherence is poor and results in modest long-term success (Lau et al., 2007). Pharmacotherapy and bariatric surgery in adjunct with lifestyle interventions have been proven to improve health outcomes of overweight and obese individuals (Lau et al., 2007).
Obesity is a major risk factor for the development of many health disorders such as hypertension, T2DM, cardiovascular disease, osteoarthritis, sleep apnea, certain cancers, and premature mortality (Picot et al., 2009). Obesity has also been shown to negatively impact mental, emotional, and psychosocial health (WHO Consultation on Obesity, 2000). Non-fatal but debilitating health problems associated with obesity include: respiratory difficulties, chronic musculoskeletal problems, infertility, and skin problems (WHO Consultation on Obesity, 2000).
The severity of obesity health related risk varies with body weight. Underweight, overweight, and obesity in adults is classified by BMI which is defined as an individual’s weight in kilograms divided by the square of their height in metres (kg/m2) (WHO Consultation on Obesity, 2000). The severity of health risk increases with BMI and is illustrated in Table 2.1. A prospective study by Calle et al. (1999) showed that the association between BMI and health risk follows a U-shaped curve with those who were severely underweight or obese being at an increased relative risk of death from all causes. The relative risk of death for obese persons was more than twice of that for persons with BMIs in the normal weight range. This is further supported by results from a national longitudinal study of Canadian adults which found a significant increased risk of
16
interval (CI) 1.25-2.39, p<0.001) or in obese Class II or higher (RR=1.36, 95% CI, 1.00-1.85, p<0.05) (Orpana et al., 2009). It is important to note that BMI is not the only factor influencing the adverse health consequences of obesity; other factors include the location of body fat, the magnitude of weight gain during adulthood, and a sedentary lifestyle (WHO Consultation on Obesity, 2000).
17
Table 2.1
BMI Classification for Adults and Associated Risk of Comorbidities BMI (kg/m2) Health Canada
Classification*
Risk of Comorbidities**
< 18.5 Underweight Low (increased risk of
other clinical problems)
18.5 – 24.9 Normal Weight Average
25.0 – 29.9 Overweight Increased
30.0-34.9 Obese Class I Moderate
35.0 – 39.9 Obese Class II Severe
≥ 40.0 Obese Class III Very Severe
18
2.3 Epidemiology of Prediabetes & Type 2 Diabetes Mellitus
2.3.1 Global Trends in T2DM. Diabetes imposes high human, social, and
economic costs on countries at all income levels and is considered to be one of the fastest growing epidemics in history (IDF, 2013; Zimmet & Alberti, 2012). The prevalence of diabetes is increasing globally mainly as a result of the rising rates of obesity but also due to the declining mortality of people living with diabetes (Anvari, 2014). Worldwide it is estimated that there are 382 million adults or 8.3% of the adult population living with diabetes and this number is expected to increase 55% by 2035 (IDF, 2013). Furthermore, an estimated 316 million adults (6.9%) have prediabetes, a number that is expected to climb as high as 471 million (8.0%) by the year 2035 (IDF, 2013). The economic burden of diabetes is enormous with 548 billion USD or 11% of the total health spending
worldwide spent on diabetes care in 2013 (IDF, 2013). The International Diabetes Federation (IDF) (2013) estimates that 80% of the world’s affected population live in low- and middle-income countries where diabetes rates are growing at a fast pace, providing a worrying indication of the future impact of this disease as a major threat to global development.
Different regions of the world are affected to different degrees by diabetes. The smallest diabetes population is seen in Africa and the largest in the Western Pacific. South and Central America are expected to see the population of people living with diabetes increase by 60% by 2035 with the largest increase expected to be seen in Africa (109%) followed closely by the region of Middle East and North Africa (96%). The smallest increase is projected for Europe at a percent change of 22% by 2035. As a result
19
of rapid development there has been a fast-growing epidemic of diabetes in South-East Asia which now accounts for close to 20% of all cases of diabetes worldwide. Of the seven IDF regions, North America and the Caribbean ranks fifth for the number of people living with diabetes and this number is expected to increase by 37% by 2035 (IDF, 2013).
2.3.2 T2DM in Canada. Diabetes is one of the most common chronic diseases in Canada. In 2008/9, 8.7% of Canadians over the age of 20 were living with diabetes, representing 1 in 11 Canadians [Public Health Agency of Canada (PHAC), 2011], and it is estimated that 90% of these cases are T2DM (Anvari, 2014). In a ten year period from 1998/9 to 2008/9, the prevalence of diabetes among all Canadians increased by 70%, from 3.3% to 5.6%, with the prevalence over time being consistently higher in males than in females (PHAC, 2011). However, the prevalence of diabetes across Canada varies by province and territory. After accounting for differences in age, the lowest prevalence was seen in Nunavut and Alberta at 4.4% and 4.9%, respectively while the highest were in Nova Scotia and Newfoundland and Labrador at 6.1% and 6.5%, respectively (PHAC, 2011). These prevalence rates represent known cases of T2DM and likely underestimate the true prevalence as T2DM is typically present for 5 to 10 years before diagnosis.
One of the contributing factors to the increase in the number of Canadians living with diabetes is the aging population, largely a result of the baby boom cohort (PHAC, 2011). The increased lifespan of people living with diabetes has also contributed to the growing prevalence rates of diabetes in the country (PHAC, 2011). However, while the proportion of people living with diabetes generally increases with age, more than 50% of the affected Canadian population is between the ages of 25 and 64 years (PHAC, 2011).
20
The proportion of individuals living with diabetes has increased more in younger age groups than in older age groups likely due to increasing rates of overweight and obesity (PHAC, 2011; Lau et al., 2007).
2.3.3 T2DM in Newfoundland and Labrador. NL has the highest prevalence of diabetes in Canada with 9.3% of the population living with diagnosed diabetes (CDA, 2010a). The CDA estimates that the prevalence of diabetes in this province will increase by 56% from 2010 to 2020 (CDA, 2010a). As the prevalence of diabetes increases in NL so will the economic effects on the healthcare system. The economic burden of diabetes in NL is estimated to increase by 27% from $254 million CDN to $322 million CDN by the year 2020 (CDA, 2010b). The population of NL has a higher risk for diabetes than other provinces in Canada for many reasons: NL has the oldest population, the highest rates for overweight and obesity, the highest prediabetes rate, and close to the lowest median family income (CDA, 2010a).
2.4 Prediabetes & Type 2 Diabetes Mellitus: Diagnostic Criteria, Etiology, & Health Risk.
Diabetes is a chronic metabolic disorder that occurs when the pancreas cannot produce enough insulin or the body is unable to use insulin effectively. In T2DM, the body is able to produce insulin but either in insufficient amounts or the body is unable to respond to its effects, known as insulin resistance, leading to a build-up of glucose in the blood known as hyperglycemia (Goldenberg & Punthakee, 2013; IDF, 2013). Prediabetes is a term that refers to an intermediate group of individuals with glucose levels that are elevated from normal but not enough to meet the criteria for T2DM; these individuals are living with impaired fasting glucose (IFG), impaired glucose tolerance (IGT), or both
21
(ADA, 2013; Goldenberg & Punthakee, 2013). Individuals living with prediabetes are at an increased risk of developing T2DM as well as cardiovascular disease (ADA, 2013). However, it is important to note that not everyone living with prediabetes will go on to develop T2DM, and there is a large body of evidence which supports the effectiveness of lifestyle interventions such as a healthy diet and physical activity to prevent the
progression of prediabetes to diabetes (IDF, 2013).
In 2013, the CDA released updated Clinical Practice Guidelines outlining the diagnostic criteria for prediabetes and T2DM which is presented in Table 2.2 and Table 2.3, respectively. The inclusion of glycated haemoglobin (A1c) in the diagnostic criteria for prediabetes and T2DM is new to the 2013 Clinical Practice Guidelines.
People living with T2DM can remain undiagnosed for many years, unaware of the long-term damage being caused by the disease (IDF, 2013). Often diagnosis occurs only when complications of the disease have already developed (IDF, 2013). While the reasons for developing T2DM are still unknown, there are known risk factors which include: obesity, poor diet, physical inactivity, aging, family history of diabetes, and ethnicity (Aboriginal, Hispanic, South Asian, Asian, or African descent) (CDA, 2013; IDF, 2013). Anyone over the age of 40 is at risk for developing T2DM and it is recommended that screening be done every 3 years (CDA, 2013; IDF, 2013).
22
Table 2.2
Diagnostic Criteria for Prediabetes*
Test Result Prediabetes Category
FPG (mmol/L) 6.1 – 6.9 IFG
2hPG in a 75g OGTT (mmol/L) 7.8 – 11.0 IGT
A1c (%) 6.0 – 6.4 Prediabetes
Note: 2hPG= 2 Hour Plasma Glucose, A1c= Glycated Hemoglobin, FPG= Fasting Plasma Glucose, IFG= Impaired Fasting Glucose, IGT= Impaired Glucose Tolerance, OGTT= Oral Glucose Tolerance Test
23
Table 2.3
Diagnostic Criteria for Type 2 Diabetes Mellitus* FPG ≥ 7.0 mmol/L
or
A1c ≥ 6.5% (in adults) or
2hPG in a 75g OGTT ≥ 11.1 mmol/L or
Random PG ≥ 11.1 mmol/L
Note: 2hPG= 2 Hour Plasma Glucose, A1c= Glycated Hemoglobin, FPG= Fasting Plasma Glucose, OGTT= Oral Glucose Tolerance Test, PG= Plasma Glucose
24
The main pathophysiological factors contributing to the onset of T2DM are insulin resistance and β-cell dysfunction (Taylor, 2013). Whole-body insulin resistance is the earliest predictor of T2DM with the earliest detection of insulin resistance found in skeletal muscle (Taylor, 2013). Insulin resistance may be caused by an insulin signalling defect, a glucose transporter defect, or lipotoxicity (Taylor, 2013). In contrast, β-cell dysfunction resulting in changes in insulin secretion determines the onset of
hyperglycemia as well as the progression towards insulin-based therapy (Taylor, 2013). It is suggested that β-cell dysfunction may be caused by amyloid deposition in the islets, oxidative stress, excess fatty acid, or lack of incretin effect (Taylor, 2013). Excess fat inhibits β-cell functioning and there is now clear evidence that weight loss reverses β-cell defects at least early in the course of T2DM (Taylor, 2013).
Furthermore, an accumulation of fat in the liver may also increase an individual’s risk of developing T2DM (Taylor, 2013). Storage of fat in the liver occurs only when there is an overall energy imbalance, i.e., when daily caloric intake exceeds energy expenditure (Taylor, 2013). Decreasing the amount of fat stored in the liver has been associated with an improvement in insulin suppression of glucose production resulting in an improvement of FPG (Taylor, 2013). An overall energy imbalance leads to excess fat in the pancreas as well as in the liver, which promotes the development of T2DM (Taylor, 2013); however, it also leads to individuals being overweight or obese which may explain why the majority of patients with T2DM are overweight or obese. Abdominal fat is of particular concern as it promotes the secretion of inflammatory chemicals from adipose cells, which disrupts the ability of insulin responsive cells to respond to insulin thus
25
promoting insulin resistance and triggering the development of T2DM (Diabetes UK, 2014).
The development of prediabetes and T2DM is also characterized by impaired actions of the incretin hormones, specifically GIP and GLP-1. Recent studies suggest that impaired incretin effects are an early sign of impaired glucose metabolism with further impairment occurring as glucose intolerance develops (Opinto et al, 2013). Incretins are gastrointestinal hormones that stimulate a decrease in blood glucose levels by causing the β-cells in the pancreas to secrete insulin (Opinto et al., 2013). These hormones also regulate postprandial glucose disposal through the inhibition of glucagon secretion and delayed gastric emptying (Opinto et al., 2013). GIP is insulinotropic and its secretion in diabetic patients is near normal, however, its effect on insulin secretion in the presence of T2DM is severely impaired (Holst et al., 2009). Glucagon is a peptide hormone produced by α-cells in the pancreas that promotes the conversion of glycogen to glucose in the liver thus increasing blood glucose levels. Diabetic patients experience hyperglucagonemia as well as an increased glucagon response following a meal (Holst et al., 2009). One
important antidiabetic action of GLP-1 is the inhibition of glucagon production, limiting the conversion of glycogen to glucose in the liver (Nauck et al., 2002). While GLP-1 secretion is impaired in diabetic patients, the potency of its effect on insulin secretion and glucagon-suppression is decreased in diabetic patients compared to healthy subjects. These changes in GIP action and GLP-1 secretion and action cause blood glucose levels to be elevated from normal (Holst et al., 2009).
26
The rate of gastric emptying and the secretion and action of the incretin hormones are major determinants of postprandial glycemia (Marathe et al., 2013). While rates of gastric emptying vary within individuals, patients with diabetes frequently experience abnormally delayed gastric emptying, or gastroparesis (Marathe et al., 2013).
Postprandially, the magnitude of the incretin effect is dependent on the rate of gastric emptying, i.e., the incretin effect should be greater in a person whose stomach empties at a rate of 4 kcal/min compared to a rate of 2 kcal/min (Marathe et al., 2013); thus, the incretin effect is impaired in diabetic patients with gastroparesis. In individuals with T2DM the magnitude of the GLP-1 response is crucial as the insulinotropic effects of GIP are reduced (Marathe et al., 2013). Furthermore, GLP-1 has an inhibitory effect on
appetite and food intake (Holst et al., 2009); however, with the impaired incretin effects that accompany T2DM the effects of GLP-1 in promoting satiety are lessened and may help explain why many patients with T2DM are overweight or obese (Gutzwiller et al., 1999).
Obese subjects with normal glucose tolerance have been reported to experience a reduced incretin effect potentially increasing their risk for the development of prediabetes and T2DM (Opinto et al., 2013). Following a mixed meal and glucose ingestion, the secretion of GLP-1, but not of GIP, is reduced in obese subjects and there is evidence indicating the existence of an inverse relationship between body weight and levels of GLP-1 (Opinto et al., 2013). In patients living with T2DM the loss of these incretin effects is more extensive in obese than in lean patients (Opinto et al., 2013).
27
Fasting lipid panel levels may also be indicative of T2DM. The most common lipid pattern in people living with T2DM consists of elevated levels of triglycerides, low levels of high-density lipoprotein cholesterol (HDL), and relatively normal concentrations of low-density lipoprotein cholesterol (LDL) and is often referred to as diabetic
dyslipidemia (Ginsberg et al., 2005; Mancini et al., 2013). There is substantial evidence supporting a key role for insulin resistance as a central pathophysiological feature of T2DM in the development of diabetic dyslipidemia (Ginsberg et al., 2005). A common characteristic of insulin resistance dyslipidemia is increased postprandial hyperlipidemia and, while clearance of postprandial triglycerides is usually reduced, an increased
production of triglyceride carrying molecules, chylomicron particles, may also play a role (Ginsberg et al., 2005). Thus, as T2DM improves, or remission is achieved, and insulin resistance decreases, there should be an improvement in triglyceride serum levels.
People living with diabetes are at risk of developing a number of serious health problems. Diabetes is considered a leading cause of blindness, end-stage renal failure, and lower limb amputations as well as a major risk factor for cardiovascular disease (Dixon et al., 2005; Doggrell & Chan, 2012; IDF, 2013; Maggio & Pi-Sunyer, 2003). Though there are many treatments available for T2DM, more than 60% of individuals living with T2DM die from heart disease or stroke (Doggrell & Chan, 2012). In 2013, 5.1 million deaths worldwide were attributed to diabetes and this number is expected to increase significantly as a result of the rise in the global prevalence of diabetes (IDF, 2013).
28
2.5 Obesity & Type 2 Diabetes Mellitus
The relationship between obesity and T2DM is undisputable and is further established by the fact that the prevalence of both are increasing in parallel (Anvari, 2014). The term “diabesity” has been coined to demonstrate the close link between these chronic conditions (Dixon et al., 2005).
Overweight, and especially visceral adiposity, are important risk factors for the development of T2DM and its complications and are considered to be the driving force behind the rising prevalence of T2DM. It is estimated that 80% to 90% of T2DM cases can be attributed to overweight and obesity (Abbatini et al., 2012; Wharton et al., 2013). Historically, T2DM has been considered a disease of the aged with most patients being diagnosed after the age of 40 years; however, in recent years there has been an emergence of T2DM diagnoses among overweight and obese adolescents and youth highlighting the serious health consequences of obesity on all age groups (Maggio & Pi-Sunyer, 2003; PHAC, 2011).
A study from the United States estimates that, at birth, the risk of developing diabetes is 1 in 3; however, this risk can be modified by weight and BMI (Narayan et al., 2007). Narayan and colleagues (2007) further investigated the impact of BMI on the lifetime risk of diabetes and discovered that in males 18 years of age the lifetime risk of developing diabetes for those with BMI < 18.5 kg/m2 was 7.6% compared to 70.3% for those with BMI > 35 kg/m2. A similar result was seen in females whose lifetime risk of diabetes ranged from 12.2% to 74.4% for BMIs <18.5 kg/m2 and > 35 kg/m2, respectively (Narayan et al., 2007). The results for males and females at 65 years of age were similar
29
but not as dramatic as those for individuals 18 years of age. In males 65 years of age the remaining lifetime risk of developing diabetes ranged from 2.2% to 34.7% for BMIs <18.5 kg/m2 and > 35 kg/m2, respectively (Narayan et al., 2007). In females 65 years of age the lifetime risk of developing diabetes for those with BMI < 18.5 kg/m2 was 3.7% compared to 36.0% for those with BMI > 35 kg/m2 (Narayan et al., 2007). The study concluded that compared to individuals with a lower BMI, individuals living with obesity (BMI ≥ 30 kg/m2
) have a higher risk of developing diabetes, having the disease for a longer period of time, and excess life-years lost to diabetes (Narayan et al., 2007).
Results from the Nurses’ Health Study which observed more than 84,000 female nurses further support the idea that the risk of developing T2DM increases with BMI. The study’s findings suggested the risk of developing T2DM increased 20-fold for those in obese class I (30.0 kg/m2≤ BMI ≤ 34.9 kg/m2) and 38-fold for those in obese classes II and III (BMI ≥ 35 kg/m2
) (Maggio & Pi-Sunyer, 2003). The Nurses’ Health Study also reported that increasing BMI, increasing weight gain, weight gain after the age of 18 years, and duration of obesity are all positively associated with the development of T2DM (Maggio & Pi-Sunyer, 2003). From the perspective of excess body weight, it is estimated that for each kilogram increase in measured weight the risk of diabetes increases by 4.5% (Maggio & Pi-Sunyer, 2003).
Not only is obesity a risk factor for the development of T2DM but it also has an impact on the disease when both coexist. Obesity increases insulin resistance and glucose intolerance and heightens metabolic abnormalities associated with T2DM such as
30
T2DM and making it more difficult to treat pharmacologically (Maggio & Pi-Sunyer, 2003). Furthermore, intensive insulin therapy and some antidiabetic medications such as sulfonylureas and thiazolidinediones promote weight gain which further complicates the management of T2DM in obese patients (Maggio & Pi-Sunyer, 2003; Wharton et al., 2013).
2.6 Weight Management in Prediabetes & Type 2 Diabetes Mellitus
Obesity is a major risk factor for the development of prediabetes and T2DM and causes further complications with these chronic conditions; thus, weight management is an extremely important aspect in the treatment of prediabetes and T2DM. A modest weight loss of 5% to 10% can substantially improve glycemic control (Wharton et al., 2013) and can potentially prevent the succession from prediabetes to T2DM by almost 60% (Ransom et al., 2013). Weight loss improves glycemic control by increasing insulin sensitivity and glucose uptake and diminishing hepatic glucose output (Maggio & Pi-Sunyer, 2003; Wharton et al., 2013). Weight loss in patients living with obesity and T2DM also improves existing comorbidities such as dyslipidemia and hypertension (Maggio & Pi-Sunyer, 2003; Wharton et al., 2013). It follows that the CDA Clinical Practice Guidelines (2013) recommend an interdisciplinary weight management program along with adjunctive pharmacotherapy, if necessary, for overweight and obese people with, or at risk for, T2DM to prevent weight gain and to achieve and maintain a lower, healthy body weight (Wharton et al., 2013).
However, people living with T2DM often have difficulty losing weight due in part to insulin resistance and also to the side effects of weight gain associated with some
31
antidiabetic medications and insulin therapies (Lau et al., 2007). The clinical practice guidelines recommend that adults with T2DM and either class II or class III obesity may be considered for bariatric surgery when lifestyle interventions are inadequate in
achieving healthy weight goals (Wharton et al., 2013).
2.7 Bariatric Surgery
Bariatric (weight loss) surgery is the only intervention proven to promote significant, sustainable weight loss and sustained improvement in weight-related comorbidities in individuals living with obesity (Jackson & Hutter, 2012; Mechanick et al., 2013). Currently there are approximately five bariatric procedures available in Canada and an increasing population of eligible candidates. When lifestyle interventions are unsuccessful in achieving healthy weight goals, patients may be recommended for bariatric surgery based on the following eligibility criteria: BMI ≥ 35 kg/m2
with comorbidities or BMI ≥ 40 kg/m2
(Lau et al., 2007).
The primary bariatric procedures recommended to be performed in patients requiring weight loss are laparoscopic adjustable gastric banding (LAGB), LSG, laparoscopic Roux-en-Y gastric bypass (LRYGB), and laparoscopic biliopancreatic diversion (BPD), BPD/duodenal switch (BPD-DS), or related procedures (Mechanick et al., 2013). All bariatric procedures fundamentally involve altering the digestive system in either a restrictive, malabsorptive, or a combination of restrictive/malabsorptive capacity to induce rapid, sustainable weight loss (Belle et al., 2007; Padwal et al., 2011; Picot et al., 2009). Bariatric procedures that are considered to be restrictive such as LSG and LAGB, physically limit the amount of food, and thereby calories, that an individual can
32
consume by reducing gastric volume. Malabsorptive procedures restrict nutrient
absorption in the small intestine and include BPD and BPD-DS. LRYGB is an example of a bariatric procedure that uses both restriction and malabsorption to help patients lose weight.
In 2011, there were 340,768 bariatric procedures performed worldwide with the majority (101,645) being performed in the USA/Canada (Buchwald & Oien, 2013). The most commonly performed procedures worldwide are Roux-en-Y gastric bypass (RYGB) (46.6%), sleeve gastrectomy (27.8%), and adjustable gastric banding (17.8%) (Buchwald & Oien, 2013) with more than 90% of bariatric surgeries performed laparoscopically through small incision ports in the abdomen (Padwal et al., 2011). It is interesting to note the dramatic increase in popularity of LSG as a bariatric procedure. Buchwald and Williams (2004) reported that LSG accounted for 0% of bariatric surgeries performed worldwide in 2003 and just 8 years later an updated report published by Buchwald and Oien (2013) estimated that LSG accounted for 27.8% of bariatric surgical procedures performed worldwide in 2011. Despite these astonishing figures, it is noted that only 1% of the eligible population receives surgical treatment for obesity (Mechanick et al., 2013).
In NL, LSG is the most common surgical treatment option for obesity. First described in 1988, LSG began as the first stage of a 2-stage procedure in superobese high-risk patients to induce weight loss and lower their operative high-risk before undergoing a more complicated procedure such as BPD-DS or RYGB (Behrens et al., 2011; Victorzon 2012). Since 1993, LSG has been performed as a stand-alone bariatric procedure
33
Victorzon 2012). In the USA, a national risk-adjusted database placed LSG between LRYGB and LAGB in terms of weight loss, resolution of comorbidities, and
complications (Mechanick et al., 2013). It follows that LSG is no longer considered to be investigational and is currently recommended as a primary bariatric procedure by the American Society for Metabolic and Bariatric Surgery (Mechanick et al., 2013). The surgical procedure involves resecting the greater curvature and fundus of the stomach, leaving a tube or a “sleeve” with a volume of 60-100 mL (Behrens et al., 2011; Gill et al., 2010; Padwal et al., 2011).
Weight loss following LSG is attributed to a reduced stomach volume leading to decreased food intake but also to decreases in gastrointestinal hormone levels such as serum ghrelin, a major hunger-inducing hormone (Behrens et al., 2011; Padwal et al., 2011). With respect to incretins, LSG has been shown to increase the post-prandial release of distal gut hormones, namely GIP and GLP-1, to a similar extent as seen following RYGB (Romero et al., 2012). The exact mechanism by which LSG creates favorable weight loss and metabolic changes is not yet fully understood.
A recent systematic review performed by Victorzon (2012) noted that the
quantity, quality, and consistency of evidence concerning LSG for the treatment of severe obesity is low. Numerous studies following patients for one to three years post-LSG have shown good results for weight loss; however, there is a lack of long-term published data available for a follow-up of ≥ 5 years with at least 100 patients. There is a similar gap in long-term data surrounding LSG and its impact on the resolution of comorbidities, particularly T2DM. Several small retrospective studies reported an effect on rates of
34
T2DM remission at four months to three years following LSG (Abbatini et al., 2010; Cassella et al., 2011; Chouillard et al., 2011; Kehagias et al., 2011; Lee et al., 2011; Nocca et al., 2011; Rosenthal et al., 2009; Vidal et al., 2007; Woelnerhanssen et al., 2011). If future long-term studies report weight loss, resolution of comorbidities, and quality of life improvements comparable to the more popular LRYGB, LSG may surpass LRYGB as the bariatric procedure of choice due to its increased simplicity and reduced risk of nutrient deficiencies and surgical risks.
2.7.1 Bariatric Surgery in Newfoundland and Labrador. In May of 2011 the Eastern Health Regional Health Authority of NL introduced LSG as a surgical treatment option for severe obesity. A bariatric surgery clinic, including two bariatric surgeons, a nurse practitioner, and a dietician was established to provide 70-100 LSG surgeries annually. In December 2012, a third bariatric surgeon was recruited and the estimated number of surgeries performed per year is 100.
2.7.2 Bariatric Surgery & Improvement or Remission of T2DM. Although the aim and success of weight loss interventions such as bariatric surgery are often based on the amount of weight lost, improvements in quality of life and comorbidities are generally a more meaningful indication of success for individuals. In the long term, weight loss from surgical interventions is associated with decreased risk of developing T2DM, resolution of T2DM, and a reduction in LDL-cholesterol, total cholesterol, and blood pressure as well as reduced mortality in patient deaths resulting from T2DM, heart disease, and cancer (Picot et al., 2009; Poirier et al., 2011). Of particular interest is the effect of bariatric surgery on preventing T2DM and remission of pre-existing T2DM.
35
Many studies have examined the effect of bariatric surgery on T2DM and while all types of bariatric surgery have been associated with remission of T2DM, malabsorptive
procedures appear to be the most effective (Poirier et al., 2011). Both the ADA and CDA recommend bariatric surgery for obese individuals (BMI ≥ 35 kg/m2
) living with T2DM as a viable treatment option for their diabetes (ADA, 2013; Wharton et al., 2013). Small trials have shown the glycemic benefits of bariatric surgery in patients living with T2DM and BMIs of 30-35 kg/m2 who normally would not be eligible for surgery (ADA, 2013). However, neither the ADA nor the CDA recommend surgery in this patient population as current evidence is limited by the number of subjects studied and the lack of long-term data demonstrating net benefit (ADA, 2013; Mechanick et al., 2013; Wharton et al., 2013).
2.7.3 Effects of LSG vs. LAGB & RYGB on Improvement or Remission of T2DM. It is well known that bariatric surgery is the most effective treatment for severe obesity but evidence is emerging to suggest that it may also be effective in inducing remission of T2DM, with the results varying by the type of operation. Often this effect occurs before significant amounts of weight are lost; thus, it is thought to be a result of changes in gut hormones and diet. Numerous studies have examined the effects of LSG, LAGB, and LRYGB independently on the improvement or remission of T2DM but fewer studies have directly compared the effects of LSG versus either LAGB or LRYGB. Two meta-analyses, one comparing LSG to LAGB and the other comparing LSG to LRYGB, were published in 2013 and are critically appraised below.
36
2.7.3.1 Wang et al. (2013). The purpose of this meta-analysis by Wang and colleagues (2013) was to compare the effects of LSG and LAGB on %EWL and T2DM. Searches for relevant publications from 2000 to 2012 were carried out via PubMed and Embase with the final search being conducted in August of 2012. Inclusion and exclusion criteria were well defined and a total of 11 studies consisting of a combined total of 1,004 patients were included in the meta-analysis. The included studies were a mixture of randomized and non-randomized studies. Of the 1,004 patients, 616 underwent LAGB and 388 underwent LSG. The length of follow-up in the studies included ranged from 6 to 12 months. Statistical heterogeneity was tested by the chi-square test and according to the forest plots, heterogeneity was limited and the Mantel-Haenszel fixed effect model was used.
The results of the meta-analysis indicated that LSG had a greater effect than LAGB on %EWL and was superior in treating T2DM at 6 and 12 months post-surgery. Five studies reported 42 of 68 patients (61.8%) living with T2DM experienced
improvement of their diabetes after LAGB compared to 66 of 80 (82.5%) patients living with T2DM who improved following LSG. The authors concluded that LSG was a more effective procedure than LAGB, with a pooled odds ratio of 0.34 (95% CI 0.16-0.73).
One common limitation in meta-analyses is publication bias. While the authors produced a series of funnel plots to assess the publication bias of the literature it remains that searches were not inclusive of unpublished data, conference abstracts, or studies not in the English language. Secondly, there were a small number of studies included in the analysis, some of which had low sample sizes which may have biased the results. Also,
37
the papers included that studied LSG lack long-term results, with most reporting on 6 and 12 month data. Perhaps the most limiting factor of this meta-analysis is that the definition of improvement or remission of T2DM is not clearly stated in the paper. It is
recommended that larger, randomized, long-term follow-up studies be conducted to compare the efficacy of LSG, LAGB, and LRYGB.
2.7.3.2 Li et al. (2013). The aim of this meta-analysis of randomized controlled trials (RCT) was to compare the efficacy of LRYGB and LSG in treating morbid obesity or T2DM. Searches for relevant RCTs in any language, published between 1966 and 2012 were carried out via Cochrane Central Registrar of Controlled Trials, Medline, Embase, ISI databases, and the Chinese Biomedical Literature Database. The authors had well-defined inclusion and exclusion criteria and a total of 5 RCTs were selected for inclusion in the meta-analysis. The quality of the included studies was assessed using the Jadad composite scale (range 0 to 5) which assesses randomization, blinding, and dropouts and all studies scored 4 or higher. These 5 RCTs encompassed a total of 396 patients; 196 patients in the LRYGB group and 200 in the LSG group. The length of follow-up in the studies ranged from 1 to 36 months with the majority (3) of the studies reporting a 12 month follow-up period. Remission of T2DM was defined as FPG levels less than 126 mg/dL (7.0 mmol/L) and A1c levels less than 6.5% without the use of antidiabetic medications. The studies were homogenous with respect to clinical and methodological criteria and the chi-square test statistic was used to assess any heterogeneity among the studies. Summary estimates were calculated using a fixed-effects model.
38
The results showed that the patients who underwent LRYGB lost more weight, had a higher remission rate of T2DM (OR 9.08, 95% CI 2.39-34.41, p=0.001), and had lower LDL, triglycerides, and insulin levels than those in the LSG group. Based on these results the authors concluded that LRYGB is more effective than LSG for the surgical treatment of T2DM; however, LSG is safer and has a lower rate of complications following surgery. It is also noted that LRYGB excludes the duodenum leading to long-term micronutrient deficiency in patients however this is avoided in LSG patients as that procedure does not exclude the duodenum. The authors recommend that in order to provide more reliable evidence, more high-quality RCTs with longer-term follow-up periods must be conducted.
One strength of this study was that the outcome measure for remission of T2DM was clearly defined by the authors. In terms of limitations, this meta-analysis was primarily limited by the lack of RCTs with large sample sizes and long-term follow-up. Small sample sizes could be the reason that the 95% CI (2.39-34.41) was so wide for the difference in the rate of remission of T2DM between patients who underwent LRYGB and LSG. Lack of long-term follow-up makes it almost impossible to comment on the durability of remission of T2DM post-surgery and the possibility of weight re-gain in the future.
2.7.4 LSG & Remission of T2DM. Current research indicates that while LRYGB appears to be a more efficacious procedure than LSG with respect to weight loss and T2DM remission, it is a much more complex surgical procedure associated with significant morbidity postoperatively (Gill et al., 2010; Li et al., 2013). LSG has been