May 2010
The impact of the EU RTD Framework
Programme on the UK
Paul Simmonds
James Stroyan
Neil Brown
Andrej Horvath
Table of Contents
1. Summary of main findings 1
1.1 Introduction 1
1.2 EU Framework Programme for Research and Technological Development 1
1.3 The extent to which successive FPs have leveraged UK research strengths 2
1.4 Strategic alignment between the FP and national strategies 3
1.5 Participation of key research groups 3
1.6 Support for gaps in UK funding 4
1.7 Impacts of the FP on research capabilities and careers 4
1.8 Impacts of the FP on UK business capabilities and competitiveness 5
1.9 Impacts of the FP on UK policy development and research funding 5
1.10 Impacts of the FP on collaborations and knowledge transfer 5
1.11 Impacts and instruments 6
1.12 Future development and opportunities for improvement 6
1.13 Conclusions and recommendations 6
2. Introduction 10
3. Methodology 11
3.1 Introduction 11
3.2 Study terms of reference 11
3.3 Methodological approach 11
4. Desk research 13
4.1 Framework support for areas of UK strength 13
4.2 Key players and the FP 18
5. Analysis of UK participation in FP6 and FP7 24
5.1 Introduction 24
5.2 Trends in UK involvement over successive Framework Programmes 24
5.3 The UK’s level of FP funding in context 26
5.4 Participation in FP6/7 by type of organisation 28
5.5 Participation in FP6/7 by Thematic Priority Area 30
5.6 FP6/7 participation by Type of Instrument 35
5.7 Role of UK participants within FP projects 37
5.8 Collaboration patterns 38
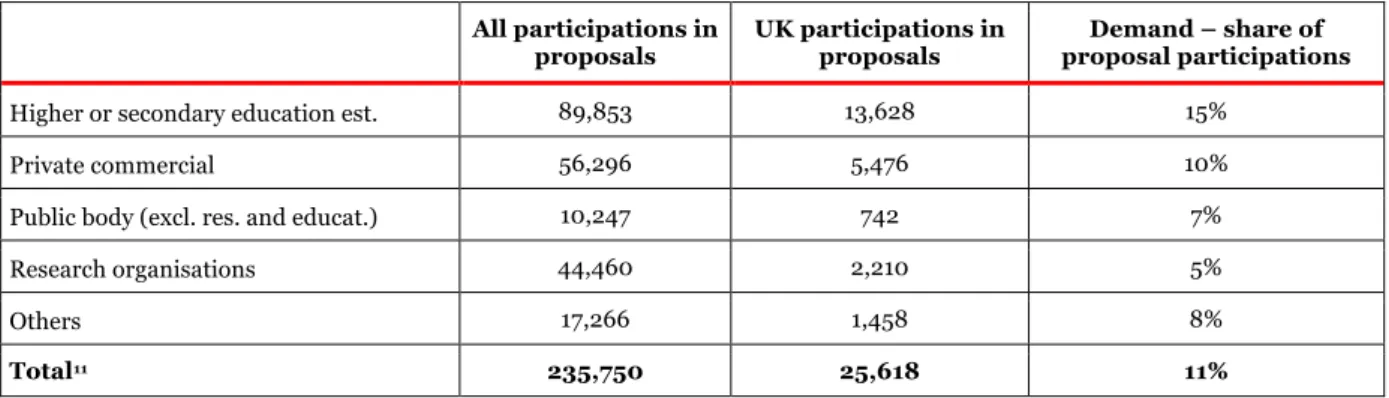
5.9 Demand for participation 40
5.10 UK proposal success rates 44
5.11 Comparing UK participation and success rates 48
6. Participant survey analysis 54
6.1 Introduction 54
6.2 Alignment between FP support areas and UK research strengths 54
6.3 Drivers and motives of participation 62
6.4 UK participants’ roles in the projects 64
6.5 Outputs sought and delivered through FP projects 65
6.6 Benefits delivered through FP projects 69
6.7 Exploitation of FP project results 71
6.8 The balance of costs and benefits associated with FP projects 74
6.9 Collaboration within FP projects 75
6.10 Feedback on FP6/7 administration and reporting 77
6.11 Participant recommendations 79
7. Stakeholder interviews 82
7.1 Introduction 82
7.2 Strategic alignment between the FP and national strategies 82
7.3 FP Leverage 83
7.4 Participation of key research groups 84
7.5 Support for gaps in UK national funding 85
7.6 Impact on research capabilities 85
7.7 Impact on industrial development and competitiveness 86
7.8 Impact on policy development 86
7.9 Impact on international collaborations 87
7.10 Impacts and instruments 87
8. Conclusions and recommendations 89
8.1 Introduction 89
8.2 Strategic alignment between the FP and national strategies 89
8.3 FP Leverage 90
8.4 Participation of key research groups 90
8.5 Complementarities 92
8.6 Benefits and impact 92
8.7 Impacts and instruments 93
8.8 Future development and opportunities for improvement 94
8.9 Recommendations to BIS 96
Appendix A Methodology 99
Appendix B Analysis of UK participation in FP6 105
Appendix C Analysis of UK participation in FP7 134
Appendix D UK participation in other actions related to FP7 164
Appendix E Questionnaire survey of FP6/7 participants 173
Appendix F Interview Guide 182
Appendix G List of interviewees 184
Table of Figures
Figure 1 – Research Council research priorities ... 15
Figure 2 – Alignment of UK research council’s priorities with FP7 ... 16
Figure 3 – Alignment of BIS ‘strategic sectors’ with FP7... 17
Figure 4 – Alignment of Technology Strategy Board priorities with FP7 ... 18
Figure 5 – UK HEI participation in FP6, by Priority Area... 19
Figure 6 – Correlation between UK university participations by FP6 Priority Area and RAE2008 ...20
Figure 7 – R&D Scoreboard companies by sector, sorted by number participating in FP6 ... 21
Figure 8 – Top 10 R&D scoreboard companies participating in FP6, sorted by participations ...22
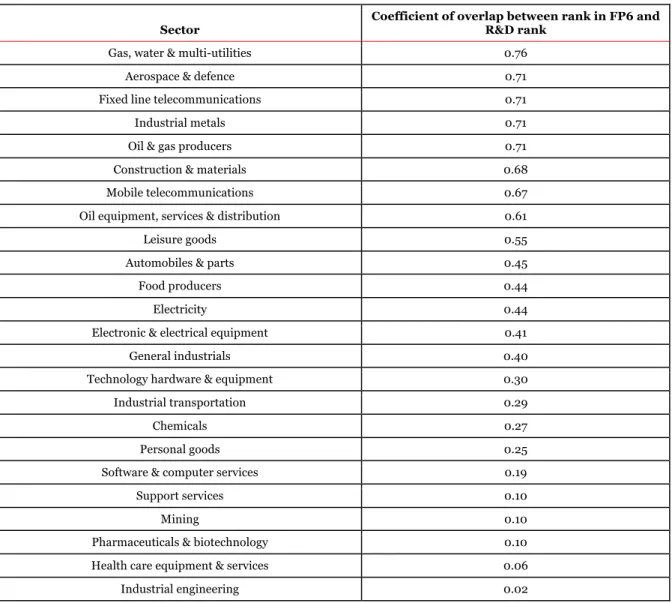
Figure 9 – Correlation between the R&D Scoreboard ranking and FP6 ranking...23
Figure 10 – UK involvement in FP4, FP5, FP6 and FP7 projects ...25
Figure 11 – UK participation numbers in FP5, FP6 and FP7 projects...26
Figure 12 – EU funding allocations to the UK under FP5, FP6 and FP7 (€ million) ...26
Figure 13 – Breakdown of UK FP6 participations and all FP6 participations, by type of organisation ..28
Figure 14 – Breakdown of UK FP7 participations and all FP7 participations, by type of organisation...29
Figure 15 – UK FP6 projects, participations and EC funding, by Priority Area ...33
Figure 16 – UK FP7 projects, participations and EC funding, by Priority Area ...34
Figure 17 – UK FP6 projects, participations and EC funding (and share of FP6 totals), by Type of Instrument ...36
Figure 18 – UK FP7 projects, participations and EC funding (and share of FP7 totals), by Type of Instrument ...36
Figure 19 – UK’s participation in FP4, FP5, FP6 and FP7 (to date) ... 37
Figure 20 – UK’s participation in FP6 proposals, by Priority Area... 41
Figure 21 – UK participation in FP6 proposals, by type of organisation ...42
Figure 22 – UK’s participation in FP7 proposals, by Priority Area ...43
Figure 23 – Demand – share of bids with UK involvement in FP7 proposals, by type of organisation ..44
Figure 24 – UK and all FP6 proposal success rates by Priority Area ...45
Figure 25 – UK and all FP7 proposal success rates by Priority Area... 47
Figure 26 – Comparison between UK relative success and participation rates in FP6 ...48
Figure 27 – Comparison between UK’s relative success and participation rates in FP7 ...49
Figure 28 – Share of participations and survey responses, by type of organisation...54
Figure 29 – Relevance of FP6/7 research topics and instruments (n=1,140) ... 55
Figure 30 – Extent to which national agencies have successfully influenced the form and content of FP6/7 (n=1,140)...56
Figure 31 – A random selection of research topics reported to be missing from, or insufficiently
addressed by, the UK’s national research funds... 58
Figure 32 – A random selection of research areas where respondents believe FP activities have strengthened previously weak UK capabilities ... 59
Figure 33 – Motives for participation in FP projects (n=1,143)... 63
Figure 34 – Top five motives for involvement, by organisation type (n=1,143) ... 64
Figure 35 – Role of UK participants in FP6/7 projects (n=1,038)... 65
Figure 36 – Importance of FP project outputs to participants (n=1,130)... 66
Figure 37 – Top five most important outputs, by organisation type (n=1,143) ... 67
Figure 38 – Delivery of FP project outputs (n=1,130)... 68
Figure 39 – Benefits achieved or realised through FP projects (n=1,130)... 69
Figure 40 – Exploitation of FP project results (n=1,131) ... 72
Figure 41 – Selected examples of FP contributions to policies and regulations... 73
Figure 42 – Costs and benefits of FP participation (n=1,084)... 74
Figure 43 – Costs and benefits of participation, by organisation type (n=1,084) ... 74
Figure 44 – Share of partners considered to be ‘world class’ by UK participants (n=982)... 76
Figure 45 – Extent to which FP projects have improved university-business collaboration (n=1,000)..77
Figure 46 – Participants’ satisfaction with FP6/7 administration and reporting (n=1,038) ... 78
Figure 47 – Share of participations and survey responses, by type of organisation... 102
Figure 48 – UK participation in FP4, FP5 and FP6 - projects ...105
Figure 49 – UK participation in FP4, FP5 and FP6 - participations... 106
Figure 50 – UK participation in FP4, FP5 and FP6 - funding... 106
Figure 51 – FP6 funding allocations to the EU-25 in comparison with GDP ...107
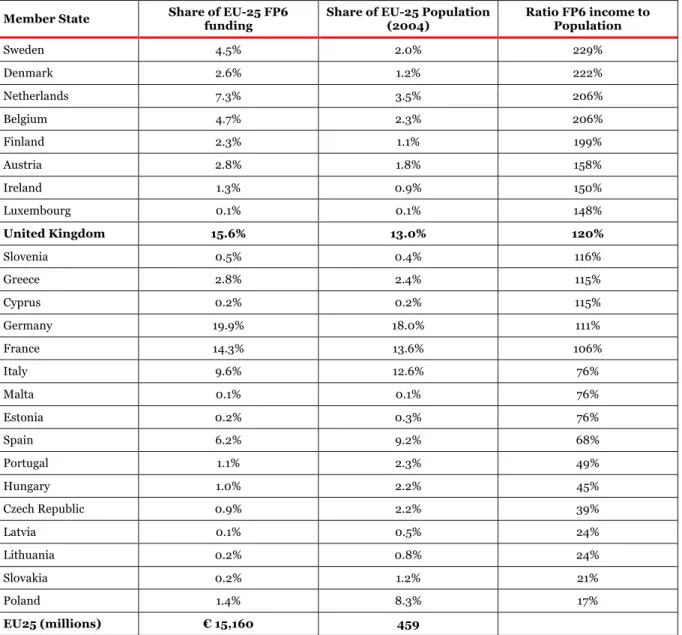
Figure 52 – FP6 funding allocations to the EU-25 in comparison with population... 108
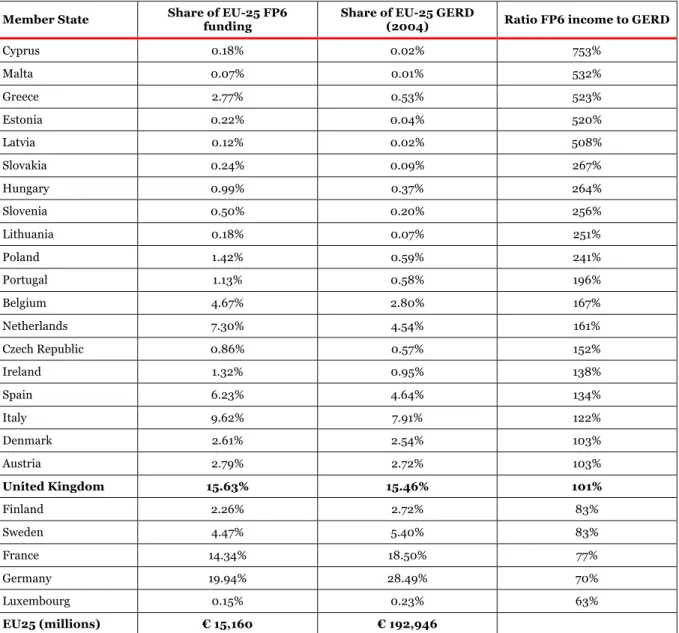
Figure 53 – FP6 funding allocations to the EU-25 in comparison with GERD ... 109
Figure 54 – FP6 funding allocations to the EU-25 in comparison with total (FTE) researchers... 110
Figure 55 – Breakdown of UK FP6 participations and all FP6 participations, by type of organisation .111
Figure 56 – UK FP6 funding, by type of organisation... 112
Figure 57 – UK FP6 participants, by type of organisation ... 113
Figure 58 - Top 10 UK Participating organisations in FP6 based on number of participations ... 114
Figure 59 – UK projects, participations and EC funding, by Priority Area ... 115
Figure 60 – UK projects, participations and EC funding, expressed as a share of FP6 totals, by Priority Area ... 116
Figure 61 – Comparison of average funding per participation in UK projects and in all projects, by Priority Area (including ratios of UK funding per participation to others in same/all projects)... 118
Figure 62 – UK projects, participations and EC funding, by Type of Instrument... 120
Figure 63 – UK projects, participations and EC funding, expressed as a share of FP6 totals, by Type of Instrument... 121
Figure 64 – Profile of involvement in NoEs and IPs, split by organisation type for all FP6 participants and UK only ... 121
Figure 66 – UK coordination levels by FP6 Priority Area ... 122
Figure 67 – UK coordination levels by type of Instrument... 123
Figure 68 – Number and share of UK FP6 projects with >1 UK partners... 124
Figure 69 – UK collaboration with actors from different countries – EU Member States and Candidate countries ... 125
Figure 70 – UK collaboration with actors from different countries – Other countries with >40 participations in UK projects... 126
Figure 71 – Partners in UK FP6 projects, by type of organisation... 126
Figure 72 – UK’s participation in FP6 proposals, by Priority Area ... 127
Figure 73 – UK’s participation in FP6 proposals, by Type of Instrument... 128
Figure 74 – UK participation in FP6 proposals, by type of organisation ... 128
Figure 75 – UK and all FP6 proposal success rates by Priority Area... 130
Figure 76 – UK and all FP6 participation-level success rates by Priority Area...131
Figure 77 – UK and all FP6 proposal success rates by Instrument ... 132
Figure 78 – UK FP6 proposal success rates by type of organisation ... 132
Figure 79 – Levels of UK demand: a comparison between UK’ relative success and participation rates in FP6 ... 133
Figure 80 – UK participation in FP5, FP6 and FP7 - projects... 134
Figure 81 – UK participation in FP5, FP6 and FP7 - participations... 135
Figure 82 – UK participation in FP5, FP6 and FP7 - funding ... 135
Figure 83 – FP7 funding allocations to the EU-27 – GDP comparison ... 137
Figure 84 – FP7 funding allocations to the EU-27 – population comparison ... 138
Figure 85 – FP7 funding allocations to the EU-27 – GERD comparison... 139
Figure 86 – FP7 funding allocations to the EU-27 – FTE researcher comparison ... 140
Figure 87 – Breakdown of UK FP7 participations and all FP7 participations, by type of organisation .141
Figure 88 – UK FP7 funding, by type of organisation ... 142
Figure 89 – UK FP7 participants, by type of organisation ... 142
Figure 90 – Top 10 participating organisations in FP7 based on number of participations ... 143
Figure 91 – UK projects, participations and EC funding in FP7, by Priority Area... 145
Figure 92 – UK projects, participations and EC funding, expressed as a share of FP7 totals, by Priority Area... 146
Figure 93 – Comparison of average funding per participation in UK projects and in all projects, by Priority Area... 148
Figure 94 – UK projects, participations and EC funding, by Type of Instrument ... 150
Figure 95 – UK projects, participations and EC funding, expressed as a share of FP7 totals, by Type of Instrument ...151
Figure 96 – UK coordination levels by FP7 Priority Area... 152
Figure 97 – UK coordination levels by type of Instrument... 153
Figure 98 – Number and share of UK FP7 projects with >1 UK partners... 154
Figure 99 – UK collaboration with actors from different countries – EU Member States and Candidate countries ... 155
Figure 100 – UK collaboration with actors from different countries – Other countries with >25
participations in UK projects ...156
Figure 101 – Partners in UK FP7 projects, by type of organisation ...156
Figure 102 – UK’s participation in FP7 proposals, by Priority Area ... 157
Figure 103 – Demand – share of bids with UK involvement in FP7 proposals, by Instrument...158
Figure 104 – Demand – share of bids with UK involvement in FP7 proposals, by type of organisation158
Figure 105 – UK and all FP7 proposal success rates by Priority Area ... 160
Figure 106 – UK and all FP7 participation-level success rates by Priority Area ... 161
Figure 107 – UK and all FP7 proposal success rates by Instrument ...162
Figure 108 – UK and all FP7 participation-level success rates by type of organisation ...162
Figure 109 – Levels of UK demand: a comparison between UK’s relative success and participation rates in FP7 ...163
Figure 110 – UK involvement in FP7 evaluation panels...165
Figure 111 – UK applicants and participants in ERA-NET actions 2007-9 ...168
Figure 112 – Overview of UK involvement in ETPs (not definitive) ...170
Figure 113 – Programme committee members, experts and NCPs...184
1.
Summary of main findings
1.1 Introduction
This report sets out the results of a study to detail the impact on the UK of successive European Framework Programmes for Research and Technological Development (RTD), focusing on the Sixth and Seventh Framework Programmes (FP6 and FP7, respectively) in particular, but linking back to the FP4 and FP5 where relevant data were available.
The Technopolis Group carried out the study on behalf of the International Science and Innovation Unit within the Department for Business, Innovation and Skills (BIS), as one of several key inputs to its preparatory thinking on the forthcoming Framework Programme.
The overall objectives of the study were to:
• Determine the extent to which successive Framework Programmes (FPs) have leveraged areas of UK strength and helped to introduce new areas of expertise
• Provide evidence as regards the nature and extent of the impacts of UK participation
These two over-arching questions, about FP leverage and impact, were addressed through consideration of nine subsidiary topics, specifically the:
• Extent to which FPs 4-7 have leveraged areas of UK research strength
• Degree of alignment between FP priorities and UK research strategies and funding
• Extent to which key UK research groups are involved, and reasons underlying non-involvement • Extent to which FPs are supporting gaps in UK funding, helping to strengthen these areas • Main impacts of the FPs on UK research capabilities, skills and careers
• Main impacts of the FPs on UK industrial development and competitiveness • Main impacts of the FPs on UK policy development and national RTD funding
• Main impacts of the FPs on collaboration between UK researchers & their counterparts abroad • FP mechanisms most strongly associated with positive impacts / benefits
The methods employed in carrying out the study included a register-based analysis of involvement in FP6 and FP7, a questionnaire survey directed to every UK participant, for both programmes, and a series of semi-structured interviews with stakeholders. The latter encompassed senior officials from interested government departments, research councils and the national FP support network as well as senior figures from across the research base, in the public and private sectors.
The nine study questions are used to structure the main findings, set out in the subsequent sub-sections, following a very short preamble about the Framework Programme.
1.2 EU Framework Programme for Research and Technological Development
The Framework Programme is the EU's main instrument for funding research that is European in ambition and scope, and which is funded in order to realise a more globally competitive business community and to underpin more robust policy, at the EU-level in particular. The current Framework Programme is referred to almost universally as FP7, a convention that has been followed throughout this report.
FP7 will run for a 7-year period between 2007 and 2013, with the European Commission (EC) investing more than EUR 50 billion in as many as 10,000 European projects of one kind or another. It marked a significant escalation in Europe’s commitment to research as a critical platform to support increased innovation and a dynamic knowledge based economy. In practical terms, FP7 has almost twice the annual spending power of its predecessor, FP6.
1.3 The extent to which successive FPs have leveraged UK research strengths
With an average annual EC budget of more than EUR 7 billion, FP7 will expend sufficient sums to produce some degree of financial leverage across most if not all areas of research where the UK, and many other EU member states, has an active interest.
UK income from FP7 is on target to exceed £500 million a year, which is a very substantial amount of money in absolute terms, and is approaching 10% of the national science budget, equivalent to the spending power of a medium-sized research council.
Financial leverage has become ever more apparent with the gradual expansion in FP budgets over time, and especially so with the transition from FP6 to FP7 when the annual EC budget has almost doubled in simple cash terms.
Participants and stakeholders stated that more often than not it is national strengths that shape FP participation, rather than vice versa. It is the breadth and depth of UK research strengths that determine the community’s ability to consistently secure a disproportionate share of EC income. This view as to the direction of causality is confirmed by participation and income profiles, with the UK research community securing close to double the share of total EC income one might expect, based on the size of the economy, in all of those FP areas with a strong ‘science’ quotient: inter alia, the European Research Council, Life Sciences, Marie Curie and Research Infrastructure.
Moreover, national research councils, and other funders, were unanimous in their expressed opinion that the FP had never shaped their organisation’s national research priorities or budgets. There are two programme-level areas where the FP has provided significant financial leverage to national efforts, which are the SME-specific measures and the Marie Curie Actions (MCAs). In the case of the former, the UK has few options for intermediary organisations seeking to carry out research relevant to a large cross-section of businesses and particularly club research for smaller businesses (SMEs) with little or no in-house research capacity. The Grant for R&D and the R&D tax credits for small firms do not reach this particular community and nor do the various innovation advice or voucher schemes. Moreover, the country’s many industry research associations have become much smaller as the larger players in almost all sectors – from electricity to water – have reduced their total R&D expenditure. The substantial funding and reach of Marie Curie amount to a very significant expansion in national support for studentships in particular, with all that means for the dynamism and sustainability of leading research groups.
The participant survey also revealed that the FP provides funding for projects in a large number of specialist subjects that national programmes choose not to fund, on the grounds that they are insufficiently important to warrant targeted support. There are just a handful of instances (c. 1% of 1200+ responses) where participants report the FP as having helped to bootstrap national capability, and where people continue to rely upon FP and other non-national funding sources. In addition, the participant survey found, in a majority of cases, that FP awards had helped to secure new research grants or other follow-on-funding. In this sense, there is evidence of leverage on the output side too. Research council officials and senior academics confirmed this view, with most interviewees confident that any peer review would credit a major FP contract. However, interviewees did not believe FP contracts were held in higher regard as compared with a national research-council grant. Interviewees did not believe that FP awards were changing the shape of the UK’s research landscape in any general sense, attracting other investors or research groups to FP teams or topics and away from other priorities. At an aggregate level, national research groups with an established international reputation and a history of frontier research do far better in Framework calls than do younger research groups with a less well-developed profile.
Several smaller businesses stated that FP income was critical to their proprietary research programmes and, moreover, that the awards had stood as testimony to the good sense of their strategy, even occasionally helping to secure secondary investments. Larger businesses did not report similar outcomes with regard to FP contracts signalling excellence to external funders, although in a single case a senior engineer did state that her FP award had helped to convince internal budget holders to increase their financial commitment to the area in question, where they had not been persuaded of the business case previously.
1.4 Strategic alignment between the FP and national strategies
Overall, there is good alignment between FP priorities and UK national research and innovation strategies, with both expending significant sums annually in a wide-range of broadly similar fields, from advanced materials to healthcare to renewable energy.
Strategic alignment has improved through time, particularly with FP6 and FP7. This has arisen as a result of evolution within the Framework Programme, rather than changing UK priorities. Most notably, with FP7, the Commission extended the FP remit to include basic research, ear marking around 15% of its budget for blue-skies research, to be overseen by the European Research Council. Elsewhere the Commission had been experimenting with more flexible, programmatic instruments, where participants and member states play a fuller role in determining research agendas and investment portfolios. The European Technology Platforms and ERANETS are both cases in point, and there is strong interest in the proposed Joint Programming method. Topically, successive FPs increased support for social science research and latterly for humanities research, two areas where the UK has strong domestic interest.
There were two aspects where alignment appeared to be less good, and which perhaps constitute an opportunity for discussions between BIS and the Commission.
The first relates to the balance of investment across the thematic / sectoral priorities, with a very substantial proportion of total FP spend being devoted to automotive- manufacturing- and ICT-related technologies, all areas where the UK has a very much smaller economic base, proportionately, compared with its continental counterparts. There has been much lower levels of support for work in areas where the UK economy has particular strengths, namely high-value services, or an especial policy interest, namely innovation in public services.
The second point of difference was the UK’s much sharper focus on outcomes. The FP in most areas continues to be heavily front-loaded in procedural terms, divining priorities at something approaching a project level and committing most of its administrative resource to contracting and financial management and control.
1.5 Participation of key research groups
A majority of the UK’s universities, research institutes and research-active companies is involved in Framework. Moreover, most dedicated research organisations, from national research institutes to private labs, have been involved actively in Framework over many years, and in many cases stretching back beyond FP4.
The composition analysis revealed that, in numerical terms at least, private commercial organisations make up a majority of UK participants, with more than 600 unique, UK-resident private companies involved in FP7, or 67% of the total participants to date. The equivalent figure for FP6 was 1,150 or 44% of all participating organisations. While this figure is dwarfed by the 2 million or so VAT-registered businesses resident in the UK, it is comparable to the 850 businesses reported in the annual Industry R&D Scoreboard, published by BIS, and the 1,500 or so research-active businesses recorded in the database of the Technology Strategy Board. The equivalent FP6 figures for HEIs and research institutes were 453 and 337; numbers that suggest the very great majority of all public-sector research organisations had been involved in some degree with the FP in the recent past.
When one switches from an analysis of the distribution of participating organisations to an analysis of ‘participations,’ the picture changes somewhat, and UK businesses account for around 20% of all participations as compared with around 60% for UK HEIs.
Running somewhat counter to current perceptions, the aggregate statistics show that UK business is as extensively involved in the FP as are its counterparts elsewhere in Europe, however the intensity of engagement is somewhat lower on average. UK business participations compare well with the equivalent statistics for France and Germany, however, UK firms do account for a lower share of total national FP income, compared with other leading EU member states.
The picture alters as one increases resolution, with much more variability across business sectors, with evidence of strong involvement by leading UK players in several economic sectors (e.g. aerospace, chemicals, utilities), while in several other notable technology sectors very few of the
leading businesses were involved in FP6 (e.g. food, general industrials, software and telecommunications).
Explanations for non-involvement were somewhat tentative, with interviewees suggesting that the primary reasons were twofold: the relatively high cost and bureaucratic rigidities of the FP, as compared with the cost-to-income ratio of national funds; and the slow metabolic rate of the FP, as compared with national schemes, which is frustrating on the one hand, but can also render the scheme inappropriate on the other, when interests are time-limited. This appears to be particularly challenging for businesses and for policymakers.
1.6 Support for gaps in UK funding
The UK science and innovation system is large and broad-spectrum, and as such there are no major thematic areas where the FP is active and the UK not.
The participant survey provides a more fine-grained perspective on the question of funding gaps, with almost all respondents (94%) stating that the FP does address gaps in national provision in some degree. Almost 40% suggested that this reflected the FP’s international instruments and geographical reach. FP support for international research represents a manifold increase in available funds, compared with the UK’s domestic portfolio of international schemes. A majority also noted that the FP had augmented national funds, supporting work in a specialist sub-field that the person in question deemed to be important.
In a small minority of cases, respondents argued that historical strengths / interests of researchers elsewhere in Europe, around nuclear power, certain vaccines, aquaculture and fisheries, for example, have attracted FP support over many years, which had provided smaller UK communities with access to both scarce research funding and much bigger and stronger pools of capability. In several cases, respondents expressed the opinion that this had helped to strengthen national capacity in those areas.
1.7 Impacts of the FP on research capabilities and careers
Overall, two motives for participating in FP stood apart from all others, which were access to funds and access to European networks, where, in both cases, around 90% of all 1,200 survey respondents rated these objectives as being important or very important. Universities and research institutes gave most weight to research income, while businesses and others gave most weight to new relationships.
The survey revealed that more than 60% of participants judge the FP to have had a big impact on the nature and extent of their international relationships and networks, while around 55% judge the FP to have had a high impact on their knowledge base. Some 40% judged the FP to have increased their scientific capabilities.
Participants cited a long list of other welcome achievements, from increased scientific reputation to an improved ability to attract and retain worldclass researchers. There was a similarly positive reaction as regards the impact on researcher careers, with around 30% of all respondents stating that their involvement in the FP had had a high impact on career progression.
Participants and stakeholders reported that the FP has had a positive impact on the attitudes, outlook and connectedness of individual researchers, as well as serving as a training ground for project management and administration.
There was a widespread belief that these immediate benefits would produce longer-term impacts in the guise of more consequential or productive research. Participants and stakeholders pointed to instances where an international scope had permitted an approach that a national programme would have struggled to match (e.g. larger and more robust control groups). There were also instances where an international project was deemed to have the spending power to progress understanding more quickly and more confidently than even a large, national science system might afford; and where expanding the geography had enlarged the pool of worldclass researchers to critical mass that might not be replicable nationally.
1.8 Impacts of the FP on UK business capabilities and competitiveness
The FP funds research to underpin the global competitiveness of European businesses, and so it should come as no surprise that a majority of UK business participants stated that their involvement (in FP6, for the most part) had yielded important commercial benefits.
In terms of immediate project outputs, a significant proportion of business respondents reported having made or gained access to new or significantly improved tools or methodologies and in a large minority of cases, firms reported the creation of formal elements of intellectual property.
Beyond these immediate project results, around 20% of businesses stated that their participation had made significant contributions to the development of new products and processes and in around 10% of cases organisations reported increased income and market share.
The study has not been able to establish the extent to which the FP has underpinned improved competitiveness of the wider business community, through for example, knowledge spillovers. Framework would appear to have been of especial importance to the commercial wellbeing of various UK intermediaries, private laboratories and technology consultancies. One might reasonably expect these ‘knowledge carriers’ to be sharing the benefits of FP-derived know how and methods with their clients.
Lastly, company interviews suggested that FP participation had made a significant contribution to the competitiveness of leading players in several niche technology markets, from inkjets to photonics.
1.9 Impacts of the FP on UK policy development and research funding
The FP is required to fund research relevant to policy and our surveys and interviews confirmed that projects involving UK partners were producing a significant amount of policy ‘benefit.’
Around 10% of the participants responding to the questionnaire survey stated that their FP project, or projects, had influenced specific policies or regulatory frameworks, through a range of different channels, from on the one hand the creation of new reference data or models for application within risk assessment methodologies specified in policy papers or regulations, to the provision of evidence that changed the scope of particular policies or fed into enforcement actions. These contributions tend to be highly particular in nature and one of many tens of factors that might ultimately bear on a new or improved policy.
Turning to the stakeholder interviews, UK policy makers were unanimous in their support for the FP, and together they listed a range of important types of benefit:
• Stronger relationships with one’s counterparts around Europe, whereby when pressing questions arise that have an international dimension meaningful multilateral conversations can be held within a matter of days
• An increase in the volume of research funded in areas of national policy interest, but which are not the highest priority and as such warrant little or no domestic research expenditure
• An increase in awareness regarding overseas colleagues’ priorities and research programmes, which does lead to ad hoc knowledge transfer
• An ability, from time-to-time, to more readily address research questions one might struggle to progress nationally
1.10 Impacts of the FP on collaborations and knowledge transfer
It is hard to imagine that participation in FP projects would not improve an organisation’s ability to collaborate with research institutions or businesses in other countries. The participant survey suggested that this was indeed the case, with 45% of all respondents stating that the experience had had a large, positive impact on their ability to work successfully with universities or businesses outside the UK. As noted already, a majority of respondents also reported Framework as having had a significant positive impact on their knowledge base and technological capabilities.
Stakeholder interviews suggested that the knowledge transfer aspects might not be as strong as the statistics suggest, with a significant minority of contributors noting a tendency for the larger,
integrated projects to be conducted in a somewhat fragmented fashion as largely discrete, smaller projects with limited interaction and knowledge exchange.
1.11 Impacts and instruments
The study was unable to establish a line between particular FP instruments and the scale of their respective impacts. Participants and stakeholders did express strong preferences for particular instruments, although this tended to reflect ‘fitness for purpose’ and administrative efficiency to a much greater extent than the fruitfulness of the instrument in question.
On balance, it seems that UK stakeholders – officials and participants – value two things above all else from amongst the FP’s portfolio of instruments: they like the scale and scope of the work that can be supported through the FP; and they like the growing number of bottom-up instruments that permit stakeholders – whether policy makers, research councils or businesses – to get involved in programme- or project-scale activities that fit their priorities exactly.
The addition of the ERC was also very widely endorsed by policy teams, research funders and academic groups, although not by businesses or RTOs which saw this extension as a major financial and intellectual distraction from Europe’s competitiveness issues.
The great majority of respondents expressed a strong preference for the medium-sized research projects that had been the mainstay of the FP5 and FP6 programmes, the so-called Specific Targeted Research Projects (STREPs). Several contributors argued that having the ability to launch, very large integrated projects was of great value, however the arrangements were being over-used: in many cases, research questions do not require investments running into the tens of millions of Euros nor do they work efficiently across partnerships with 20 or more member organisations.
1.12 Future development and opportunities for improvement
The study focused on strategic questions in the main: the degree of alignment with national science and innovation policy or the strategic added value of the FP. However, almost everyone contacted during the course of the study did wish to offer a series of observations about the operational aspects of the FP and in particular that while much good progress has been made, it continues to be unnecessarily bureaucratic, costly, inflexible and slow.
When asked about possible future developments and opportunities for improvement in relation to the FP, most focused on explaining negative issues experienced through their participation, rather than providing actual ‘recommendations’ for improvement. Nevertheless, some suggestions for improvements to FP8 were identified, which might enhance UK involvement and benefits derived. These focused, at the European level, on further developing the themes and types of research supported and reducing the level of bureaucracy. At the national level, suggestions focused on exploring possibilities for inputting to FP scheme design and agenda setting; and providing more intensive support to applicants.
1.13 Conclusions and recommendations
1.13.1
OverallOverall, UK performance within the FP, in terms of participations and income, has been strong across the period since FP4, and FP6 saw a recovery from a relative low-point in FP5, a level of performance that appears to be holding up well in the early calls of FP7.
1.13.2
LeverageWith an average annual EC budget of more than EUR 7 billion, FP7 will expend sufficient sums to produce some degree of financial leverage across most if not all areas of research where the UK has an active interest.
It is the breadth and depth of UK research strengths that determine the community’s ability to consistently secure a disproportionate share of EC income, with the UK securing close to double the share of total EC income, based on the size of the economy, in all of those FP areas with a strong ‘science’ quotient: inter alia, the European Research Council, Life Sciences, Marie Curie and
There are two programme-level areas where the FP has provided significant financial leverage to national efforts, which are the SME-specific measures and the Marie Curie Actions (MCAs). In the case of the former, the UK has few options for intermediary organisations seeking to carry out research relevant to a large cross-section of businesses and particularly club research for smaller businesses (SMEs). Similarly, Marie Curie amounts to a very significant enlargement of national funds for studentships in particular.
At a project level, the FP provides funding for a large number of specialist subjects, which national programmes choose not to support. There are just a handful of instances where the FP has helped to bootstrap capability, in the absence of significant national investment.
FP awards had helped to secure new research grants or other follow-on-funding. However, FP contracts are not held in higher regard than are research-council grants, and seem unlikely to change the shape of the UK’s research landscape, attracting other investors or research groups to FP teams or topics and away from other priorities.
FP income is perhaps most critical to research-active SMEs, funding their proprietary research programmes and signalling the quality of their work to secondary investors.
1.13.3
Strategic AlignmentUK and FP strategic alignment is good overall, and has improved over time across successive FPs with the extension of its thematic priorities (e.g. to include issues from security to the humanities), the addition of various new instruments to the FP toolkit with a stronger bottom-up quality and the inclusion of research excellence principles through the ERC.
The strategic fit looks as though it might improve further in future, with the Commission Services’ interest in strengthening links between research and innovation on the one hand and using a series of Grand Challenges as a means by which to inspire and structure at least part of the programme. The key alignment issue for the future would seem to revolve around the balance of spend across priority areas, and specifically identifying any opportunities to increase the funding available for areas of particular interest to the UK such as high-value services or public-sector innovation.
1.13.4
Key research groupsA majority of the UK’s universities, research institutes and research-active companies is involved in Framework. Moreover, most dedicated research organisations, from national research institutes to private labs, have been involved actively in Framework over many years, and in many cases stretching back beyond FP4.
Private commercial organisations make up a majority of UK participants, with more than 1,100 UK-resident companies involved in FP6, or 44% of all participating organisations. The equivalent figures for HEIs and research institutes were 453 and 337; numbers that suggest the very great majority of all public research organisations had been involved with the FP.
Running somewhat counter to current perceptions, UK business participations compare well with the equivalent statistics for France and Germany, however, UK firms do account for a lower share of total national FP income, compared with other leading EU member states.
The picture alters as one increases resolution, with much more variability across business sectors, with evidence of strong involvement by leading UK players in several economic sectors (e.g. aerospace, chemicals, utilities), while in several other notable technology sectors very few of the leading businesses were involved (e.g. food, general industrials, software and telecommunications). Explanations for non-involvement were twofold: the relatively high cost and bureaucratic rigidities of the FP; and the slow metabolic rate of the FP, which can render the scheme inappropriate when interests are time-limited. Timing is particularly challenging for businesses and for policymakers.
1.13.5
Support for funding gapsThe UK science and innovation system is large and broad-spectrum, and as such there are no major thematic areas where the FP is active and the UK not.
FP support for international research represents a manifold increase in available funds, compared with the UK’s domestic portfolio of international schemes.
In a small minority of cases, historical strengths of researchers elsewhere in Europe, around nuclear power, certain vaccines, aquaculture and fisheries, for example, have attracted FP support over many years, and helped to sustain some national capacity in those areas.
1.13.6
Impacts on researchThe FP has had a big impact on the nature and extent of UK researchers’ international relationships and networks, as well as on their knowledge base and scientific capabilities.
Other notable outcomes include increased scientific reputation, an improved ability to attract and retain worldclass researchers and a positive impact on researcher careers. Lastly, FP has had a positive impact on the attitudes, outlook and connectedness of individual researchers, as well as serving as a training ground for project management and administration.
These immediate benefits should produce longer-term impacts in the guise of more consequential or productive research.
1.13.7
Impacts on businessThe FP has yielded important commercial benefits. UK business participants had made or gained access to new or significantly improved tools or methodologies and other forms of intellectual property. Participation had contributed to the development of new products and processes and increased income and market share.
Framework would appear to have been of especial importance to UK intermediaries, private laboratories and technology consultancies. One might reasonably expect these ‘knowledge carriers’ to be sharing the benefits of FP-derived know how and methods with their clients.
Lastly, company interviews suggested that FP participation had made a significant contribution to the competitiveness of leading players in several niche technology markets, from inkjets to photonics.
1.13.8
Impacts on policyThere is scant evidence of specific impacts on UK policy, however UK government departments and agencies have benefited from the FP in various ways, but in particular from:
• Stronger relationships with their counterparts around Europe
• An increase in the volume of research funded in some areas of policy interest • An increase in awareness regarding overseas colleagues’ priorities
• An ability to more readily address questions one might struggle to progress nationally
1.13.9
Impacts on international relationshipsThe FP has had a large, positive impact on UK researchers ability to work successfully with universities or businesses outside the UK, however knowledge exchange might not be as strong as the statistics suggest, with a tendency for work to be conducted in a somewhat fragmented fashion as largely discrete, smaller projects.
1.13.10
Impacts and instrumentsThe study was unable to establish a line between particular FP instruments and the scale of their respective impacts. Participants and stakeholders did express strong preferences for particular instruments, although this tended to reflect ‘fitness for purpose’ and administrative efficiency to a much greater extent than the fruitfulness of the instrument in question.
On balance, it seems that UK stakeholders – officials and participants alike – value two things above all else from amongst the FP’s portfolio of instruments: they like the scale and scope of the work that can be supported through the FP; and they like the growing number of bottom-up instruments
that permit stakeholders – whether policy makers, research councils or businesses – to get involved in programme- or project-scale activities that fit their priorities.
1.13.11
Opportunities for changeThe biggest challenge would seem to relate to the issue of widening participation outside the areas where UK universities and research institutes have been so successful: life sciences, ERC, Marie Curie, Research Infrastructure.
This relates to business engagement in particular, with whole swathes of businesses seemingly unaware of or indifferent to FP. Moreover, comparing participation data with income statistics suggests UK businesses have been playing secondary or otherwise less intensive roles than their counterparts elsewhere in Europe.
Chasing more business involvement is a difficult game, and short-term success can cause long-term damage, as people are persuaded, against their instincts to get involved in activities that are not wholly suited to them.
With that cautionary note in mind, there are perhaps three things BIS might give more thought to: • Encouraging the Commission to spend a greater share of its total budget through its more
flexible instruments
• Exploring ways to make more and better use of larger / experienced organisations to bring new organisations into the scheme
• Pulling together more evidence and in-depth case material on the benefits of participation In terms of national arrangements, we recommend BIS look at three issues:
• The overall PCM, expert and NCP arrangements, to determine whether things have become too fragmented and uneven in terms of available support
• The market intelligence (and FP information more generally) that is available to the national support system, and its adequacy in terms of determining an overarching strategy and informing efforts to hold conversations with the unaware and the sceptical
• The addition of an FP / international chapter in the strategies and annual reports provided to BIS, by the research councils and other public bodies
In terms of the future and FP8, we have to follow the popular vote and recommend that BIS: • Continue to promote the simplification agenda
• Push for inclusion of broader innovation issues
• Push for early elaboration of the purpose, shape and balance of important new concepts like Grand Challenges and Joint Programming
• Explore ways in which it might encourage the Commission to implement more flexible, trust-based contracts, or grants, as the most appropriate vehicle for international applied research • Push for an increased focus on research results and outcomes as a means of control
2.
Introduction
This report sets out the results of a study to detail the impact of the EU RTD Framework Programmes (FP) on the UK, which was carried out by the Technopolis Group on behalf of the Department for Business, Innovation and Skills (BIS).
The study was commissioned to inform the UK position in forthcoming discussions regarding the priorities and organisation of the next FP, commonly referred to as FP8, as well as to provide intelligence of wider relevance on the added value of European-level activities. The overall objectives of the study were to:
• Determine the extent to which successive FPs have leveraged areas of UK strength and helped to introduce new areas of expertise; and
• To provide up-to-date evidence as regards the nature and extent of the impacts of UK participation
The full list of questions is set out in the description of the study design and methodology, which follows in the next section. The methods employed in carrying out the study included desk research, a participation analysis of UK involvement in FP6 and FP7 to date, a questionnaire survey directed to all UK participants in the two programmes, and semi-structured interviews with stakeholders. The report is organised in six further sections, as follows:
• Section 3 summarises the methodology employed in carrying out the study, beginning by outlining the terms of reference for the study and then setting out the methods used;
• Section 4 presents the main findings from the desk research used to test the alignment between the FP programme’s topical priorities and instruments and UK research strategies; • Section 5 presents the main findings from an analysis of the UK’s participation in FP6 and
FP7 based on data supplied by BIS from the European Commission’s E-CORDA database; • Section 6 presents the main findings from a questionnaire survey of UK participants in
FP6 and FP7, which sought a community-wide view of FP added value; and
• Section 7 presents the main findings from interviews from across the spectrum of stakeholders, from programme committee delegates to research funders to businesses.
• Section 8 presents our conclusions and recommendations
A series of appendices provide additional information on methodology, questionnaire design and contributors.
3.
Methodology
3.1 Introduction
This section begins by outlining the aims of the study and the main questions to be addressed, before going on to introduce the programme of work and the methods employed. A more detailed explanation of the methodology is presented in Appendix A .
3.2 Study terms of reference
The main aim of the study was “to produce up-to-date evidence as regards the impact of the Framework Programmes in the UK such that it can inform, in a timely way, the formulation of UK objectives for the negotiation of FP8.” The study was also intended to complement the BIS international team’s wider efforts to gain strategic intelligence through extensive bilateral discussions and ongoing analysis of new FP evaluations and impact assessments.
The specific objectives of the work were presented in the form of a number of questions, organised under two broad areas of interest: (i) leveraging / enhancing UK capabilities, and (ii) impacts of UK involvement in FPs. The full set of questions outlined in the Invitation to Tender are presented in Appendix A , but covered the following main areas:
• Extent to which FPs 4-7 have leveraged areas of UK strength • Alignment between FPs and national strategies and funding • Extent to which key UK research groups are involved in FPs
• Extent to which FPs are supporting gaps in UK funding / capabilities
• Impacts of the FPs on (i) UK research capabilities, skills and careers, (ii) UK industrial development / competitiveness, (iii) UK policy development and RTD funding, and (iv) collaboration between UK academic and industrial communities
• FP mechanisms most strongly associated with impacts on UK research / industrial capabilities • Recommendations for enhancing FP alignment and involvement in future
The Invitation to Tender envisaged a methodology that would use both qualitative and quantitative methods, requiring desk research and contact with previous participants in FP (among others). The resulting report was expected to include a set of conclusions that would help BIS to identify thematic priorities and ways in which FP8 could be structured to better align with UK research and innovation systems and increase UK take-up and success rates.
3.3 Methodological approach
The study was designed to address the overall aims and objectives, and to provide answers to all of the questions set out above. The methodology was quite conventional, using several familiar data collection strategies and analytical techniques to produce a mixture of quantitative and qualitative data with which to answer the key questions. The combination of methods included desk research to compile factual data on FP participation, sufficient to map trends across successive programmes and across the many and various target groups, a community-wide online survey to ‘count’ and profile the spread of opinions on key issues from statistically significant numbers of participants and semi-structured interviews to explore in a more prospective fashion any lessons past experiences might hold for future aspirations. The 3-month timetable prohibited deployment of more novel methods, wherein we had to forego an idea to use bibliometrics to measure the relative quality of research outputs that tie back to FP contracts, as compared with the total body of work in a given field, both national and international. Social Network Analysis had to be discounted for similarly practical reasons, although this technique does have the power to map the nature and extent of international research alliances, and their evolution through time, and it can yield such a view several years earlier than an equivalent citation analysis. This mixed methods approach is described in full in Appendix A , and comprised the following elements:
• A period of desk research into existing data and strategies in order to assess the alignment between FP support and UK academic/industrial research strengths and priorities. The main findings from this analysis are summarised in Section 4 of the main report
• A factual analysis of UK participation in FP6 and FP7, covering participation in proposals, success rates, and participation in funded projects. The outputs from this component of the study are presented in full in Appendix B (for FP6) and Appendix C (for FP7). The main findings are also summarised in Section 5 of the main report. An additional analysis of available data and information on UK involvement in other related initiatives (not covered by the E-CORDA database) was undertaken and is presented in Appendix D , with the main findings summarised in Section 5.12
• A questionnaire survey of UK participants in FP6 and FP7. Technopolis designed a questionnaire (see Appendix E ) to address the various information requirements of the study and focusing on elements that could not be answered through the participation analysis, or that would not be better addressed through the interviews. The questionnaire consisted of 29 core questions and focused on the extent to which FPs have leveraged areas of UK strength and helped introduce new areas of expertise, as well as profiling the benefits of UK participation • In parallel, Technopolis analysed and prepared contact information relating to UK participants
in FP6 and FP7. The questionnaire was uploaded to a professional online facility and every one of the 7,800+ UK FP6/7 participants identified was emailed with an invitation to contribute to the study. The team had to negotiate on ‘surprise’ when several university people replied letting us know that they were in a ‘central support function’ and were not themselves project participants, as listed in the FP7 database. As the survey was intended for direct participants, efforts were made to contact the relevant participants through offices of the listed central contacts, and as a result, we are aware that 26 individuals in central functions forwarded our request onto an additional 423 direct participants
• Taking undeliverable and ‘opt out’ messages together, and including the additional individuals contacted through central support function contacts, we can estimate that the pool of possible respondents numbered 6,732. A total of 1,208 respondents provided a usable questionnaire return, giving an overall response rate of 18%. The distribution of responses by organisation types was broadly in line with their overall share of FP6/7 participations. The survey responses provide a reliable sample from which to draw conclusions. The main findings from the participant survey are presented in Section 6 of the main report
• A programme of interviews with national stakeholders to deepen our understanding of the impacts of FP participation and the extent to which it has leveraged areas of UK strength, as well as provide a richer and more qualitative perspective than the one revealed through the survey or the desk research alone. The study identified an initial list of ~100 potential contacts, covering most programmes and areas of FP7 and most government departments and research councils. Based on this list, interviews were undertaken with 53 individuals. A full list of contributors is provided in Appendix G
• Interviews were semi-structured, based around the brief, but with sufficient flexibility within the interview process to allow interviewees to focus on those aspects where they could contribute best. The interview guide (shown in Appendix F ) followed the same broad structure as the questionnaire survey, but allowed us to gain a more in-depth qualitative understanding of the main study questions. The findings are presented in Section 7
• Detailed analysis and reporting at two stages within the study. An interim report was produced, which detailed progress on all of the main work components and presented preliminary results from the participation analysis. Following completion of all data collection and analyses, a draft final report was then prepared and submitted. Based on a full analysis of all of the data and feedback presented, conclusions and recommendations have also been developed and are presented in Section 8
4.
Desk research
4.1 Framework support for areas of UK strength
4.1.1
IntroductionThis section of the report addresses the extent to which the EU RTD Framework Programmes have leveraged “areas of UK strength as identified from the UK R&D Scoreboard and BIS objectives, and by [comparison] with Technology Strategy Board and Research Council priorities.”
The UK government provides very substantial and wide-ranging support for research, both through direct means (e.g. the science budget funding research in universities and colleges) and indirect (e.g. R&D tax credits to small businesses), broadly comprising three streams:
• The dual support system – institutional block grants (HEFCE QR) and ‘project’ funding (RC grants) – providing funds for basic and applied research carried out primarily in the higher education sector but also within selected national research institutes
• Government departments’ R&D programmes and contracts, which fund research at full price to support policy or develop public services
• Public support for research and technology development within the private sector, through grants (e.g. the Technology Programme or Grant for R&D) and tax breaks (e.g. R&D tax credit) This substantial undertaking becomes larger still when one takes into account the work of the non-governmental sector (NGOs) and in particular the research charities such as the Wellcome Trust or Cancer Research UK. With this panoply of research funders and funding streams, and for practical reasons therefore, we have been selective in our compilation of national research priorities, and have focused on the strategies of the public bodies with the largest research budgets:
• Department of Business, Innovation and Skills (BIS, previously BERR); • The Technology Strategy Board; and
• The grant-awarding Research Councils.
4.1.2
Department of Business, Innovation and Skills (BIS)In April 2009, BIS published a new industrial strategy to strengthen Britain’s competitiveness in part by targeting public support on high-value economic sectors where fundamental technological change was expected to drive significant growth in global markets. The strategy identified six areas – or strategic sectors – with high growth potential and aligned with the UK research base:
• Advanced Manufacturing; • Composites;
• Digital;
• Life Sciences and Medical Technologies;
• Low Carbon (encapsulating marine energy, renewable, nuclear, building technologies, etc); and • Plastic Electronics.
4.1.3
The Technology Strategy BoardThe mission of the Technology Strategy Board is to accelerate the development and application of technology – above and beyond that which the market might achieve on its own – in selected areas of adjudged strategic importance to the UK. Its strategy, ‘Connect and Catalyse,’ sets out sets of priorities, which inter-connect at many levels, key technologies, key applications and innovation platforms:
• Key Technology Areas: − Advanced materials − Bioscience
− Electronics, photonics and electrical systems − High value-added manufacturing processes − Information and communication technologies − Nanotechnology
• Key application priorities to guide its activities: − Built environment
− Creative industries
− Energy generation and supply − Environmental sustainability − Healthcare − High-value services − Transport • Innovation Platforms: − Assisted Living
− Intelligent Transport Systems and Services − Low Carbon Vehicles
− Low Impact Buildings − Network Security
4.1.4
Grant awarding research councilsThe grant-awarding research councils’ are pursuing a range of research priorities, comprising cross-council priorities on the one hand, such as energy, and single-cross-council priorities on the other. Both types of priority are listed in the government publication, “The Allocations of the Science Budget: 2008/09 to 2010/11,” which was published by the Department for Innovation Universities and Skills (BIS’ predecessor department) in December 2007.
Figure 1 presents a consolidated list of research priorities, compiled from the ‘Allocations’ report, with the first row itemising the six, cross-council priorities, listed alphabetically. It should be noted that these priorities relate to strategic programmes, which complement the very substantial volume of research funding that is allocated through response-mode to sponsor the very best research no matter its subject. The financial split is nowhere specified, but is probably around 30:70, strategic: responsive.
Figure 1 – Research Council research priorities
Council Priority
Cross-council Ageing: Life-long Health and Wellbeing Digital economy
Energy
Global Threats to Security Living with environmental Change Nanoscience
AHRC Global threats to security
Innovation in the creative industries UK heritage industry
BBSRC Ageing: Life-long Health and Wellbeing Bioenergy research Global Threats to Security
Systems biology and predictive biology
EPSRC Energy
Digital economy Nanoscience
ESRC Energy and environment
Global poverty Global security
Population change and migration Public health
Succeeding in the global economy Understanding individual behaviour
MRC Ageing: Life-long Health and Wellbeing Digital economy
Living with environmental Change
Replacement, refinement and reductions of animals in research
NERC Earth observation science
Energy
Living with environmental Change
Source: compiled by Technopolis from “The Allocations of the Science Budget: 2008/09 to 2010/11,” DIUS, December 2007.
4.1.5
Alignment with FP7 prioritiesHaving assembled a consolidated list of research priorities and themes for a selection of the biggest UK research funders, and FP7 programmes and priority areas, the next step was to seek to match the two lists. The matching was done manually using a simple keyword search of the CORDIS database, to look for instances of programmes or projects where the title or abstract matched with the subjects covered by each of the UK priorities identified.
This entailed a somewhat fuzzy process requiring cross-checks at multiple levels, using programme documents, online databases and calls for proposals (i.e., FP programme, priority, call and project). We searched within the collaborative research programmes and not the response-mode grants for European Research Council (ERC) awards or researcher mobility awards. It was beyond the scope of the current project to run a more exhaustive matching process, and nor did the team have an