Asset Sales and the Role of Buyers: Strategic Buyers versus Private Equity
Ulrich Hegea Stefano Lovob Myron B. Slovinc Marie E. Sushkad
First version: September 2009 This version: June 2012
Abstract
We model the interaction of private equity and strategic buyer bids in corporate asset sales. We endogenize private equity’s contribution to asset liquidity by incorporating the link between private equity bids and time-varying exit values. Private equity bids are increasing in private equity’s ability to enhance the asset’s value, and can only exceed strategic bids if this ability is important. Our empirical results for asset sales show that excess returns to sellers are greater for sales to private equity than strategic buyers. Increases in enterprise value during private equity ownership signi…cantly exceed those of benchmark …rms. Seller gains in private equity deals are related to subsequent increases in asset values and type of exit.
Keywords: Asset sales, private equity, restructuring, corporate auctions. JEL: G32, G34.
— — — — — — — — — — — — — — — — — —
We are grateful to Ken Ahern, Espen Eckbo, David Robinson, Frederik Schlingemann, and Armin Schwienbacher for their comments and conference discussions, to seminar audiences at the SEC, the Coller Institute Private Equity Conference, the ECCCS Workshop in Nice, Essec Private Equity Conference, ESSFM in Gerzensee, and in Tilburg, Rotterdam, Toulouse, Vienna, Besancon, Cass Business School, Constance, Mannheim, Tel Aviv, Bergen, and Frankfurt. An earlier version was entitled “How does Private Equity Bid in Corporate Asset Sales?”
a Department of Finance, HEC Paris, [email protected] b Department of Finance, HEC Paris, [email protected] c Department of Finance, HEC Paris, [email protected]
Asset Sales and the Role of Buyers: Strategic Buyers versus Private Equity
Abstract
We model the interaction of private equity and strategic buyer bids in corporate asset sales. We endogenize private equity’s contribution to asset liquidity by incorporating the link between private equity bids and time-varying exit values. Private equity bids are increasing in private equity’s ability to enhance the asset’s value, and can only exceed strategic bids if this ability is important. Our empirical results for asset sales show that excess returns to sellers are greater for sales to private equity than strategic buyers. Increases in enterprise value during private equity ownership signi…cantly exceed those of benchmark …rms. Seller gains in private equity deals are related to subsequent increases in asset values and type of exit.
Asset Sales and the Role of Buyers: Strategic Buyers versus Private Equity
1. Introduction
Since the early 1990s, private equity …rms have become frequent bidders in corporate asset sales, a market previously dominated by strategic buyers (operating …rms).1 In this paper, we analyze how the bidding behaviors of private equity and strategic buyers interact, focusing on the following questions: Why can private equity …rms generate higher bids than strategic bidders given that they lack the synergistic gains available to strategic acquirers? And, given that private equity is a transitional form of ownership, how do private equity bids re‡ect expectations about exit, that is, the expected value in a future sale to a strategic buyer or another private equity …rm, or in an IPO?
We present an auction model of bidder competition that addresses these questions and we provide empirical work related to the predictions of our model. Corporate asset sales are an appropriate venue for this auction-based analysis, because unlike mergers, they are invariably non-hostile, typically seller-initiated and highly competitive. There are three main results. One, in a corporate asset sale a private equity buyer can generate larger seller gains than strategic buyers if and only if there are large potential gains from restructuring the asset. Our empirical tests using a sample of large asset sales are consistent with this conclusion, which provides an interesting contrast to studies of mergers that …nd higher seller gains for stand-alone …rms that are sold to public buyers rather than to private equity. Our theoretical analysis allows us to resolve this contrast in results based on di¤erences in private equity’s potential to create value from divested assets versus stand-alone …rms. Two, during the period of private equity ownership, divested assets outperform comparable benchmark entities.
1
Eckbo and Thorburn (2008) report that on average asset sales make up 38% of all merger and acquisition transactions over the period 1970 to 2006. Kaplan and Stromberg (2009) report that in deal value corporate divestitures are on par with stand-alone targets in terms of the acquisition ‡ow of private equity …rms from 1995 to 2004.
Three, there is a close link between wealth gains to parent seller …rms at announcements of private equity deals and the ensuing growth in the asset’s value, con…rming that high private equity bids re‡ect expectations of improvements in value under private equity ownership.
A central di¤erence between asset sales and mergers is that there is a change in business organi-zational form when private equity acquires a divested asset but not when it acquires a stand-alone …rm, a di¤erence highlighted in our theory. Of course, there are other material di¤erences between asset sales and mergers. Unlike mergers and tender o¤ers, which are governed by a complex body of case law and disclosure regulation designed to protect shareholders, asset sales are governed by the business judgment rule that gives managers full latitude to identify assets for sale and to set the rules for an auction to foster competition among potential bidders.2There is no shareholder involvement in asset sales nor any concern about judicial second guessing as to the merits of a transaction.3 Unlike mergers, asset sales leave the selling …rm’s managers in place, and there is no need for a buyer to calibrate bid premiums to take into account the potential for target resistance. In short, asset sales are a well-suited laboratory for studying the outcomes of bidding behavior since the institutional environment closely corresponds to an auction framework.
Our model applies the usual assumption that strategic bids re‡ect the (exogenous) value of syner-gies between a bidder’s assets and the asset for sale. Our theory endogenizes private equity’s decision to enter the bidding, with the aggressiveness of its bidding re‡ective of its ability to enhance the asset’s value and exit successfully. Despite an absence of the synergies intrinsic to strategic bidders,
2For example, con…dentiality is a standard characteristic of corporate asset sale auctions and participants seldom provide the public with any information (except for minimal disclosure of outcomes) with respect to the processes the various parties pursued or any indications of the interest (or even the identities) of non-successful bidders.
3
The business judgment rule not only gives managers broad discretion about the conduct of the sale, but it insulates the transaction from shareholder voting and shareholder litigation. This laissez-faire approach of corporate law to asset sales has been justi…ed on the basis that both seller and buyer managers continue to operate subject to the discipline and monitoring of …nancial markets (Gilson, 1981).
we allow for the possibility that private equity may be able to improve an operating asset in ways not feasible for strategic …rms or the parent seller. For example, managers of less well-performing subsidiaries within a parent organizational structure have an incentive to lobby parents to secure additional resources to protect their unit, costly activities - referred to as in‡uence costs - that harm parent …rm value (Meyer, Milgrom, and Roberts 1992). After acquiring control, private equity can eliminate these costs, implement restructuring plans, and enforce managerial discipline. We show that the existence of such restructuring capabilities are a salient factor in the auction. Our analysis suggests that when the restructuring gains are expected to be large, private equity is more likely to enter the auction and bid aggressively, while assets with less potential for restructuring gains are more likely to go to strategic buyers. Our model implies that revenue to sellers is higher for asset sales to private equity relative to sales to strategic buyers only if private equity has the relevant restructuring capabilities. In the absence of restructuring capabilities of private equity, the model implies that there is greater seller revenue from strategic deals. In an extension of the model, we discuss why this bid ranking condition still holds even if private equity has an edge in identifying undervalued assets. We also examine how the equilibrium is a¤ected when we alter various other assumptions.
A central element of our model is that private equity’s bidding behavior is endogenously deter-mined by the asset’s expected value at exit, which in turn takes account of (1) the restructuring potential and (2) the future (i.e., at exit) bidding competition for the asset that will apply between synergistic bidders (trade sales) and private equity bidders (SBOs). In other words, we fully endoge-nize private equity’s contribution to asset liquidity. As a result, gains to parent …rms at news of asset sales to private equity should be correlated with (1) the asset’s expected subsequent performance relative to that of benchmark …rms, and (2) the type of transaction by which private equity exits
(IPO, sale to a strategic buyer, secondary buyout or bankruptcy procedure).
We examine large asset sales from 1994 through 2004, and in the case of private equity deals, determine the exit outcomes. In practice, a strategic buyer may be either a public or a private operating …rm since both can bid based on synergistic potential. Inasmuch as private …rms are exempt from public reporting and often have equity-based links between managers and owners, they can be viewed as having some commonalities with private equity. Thus, we analyze the e¤ects on seller gains for each type of buyer. We generate several major …ndings that can be interpreted within the framework of our theory. One, at asset sales to private equity, sellers earn large positive excess returns, 3.78%, that are signi…cantly greater than at sales to public operating …rms, 1.25%, or private operating …rms, 0.95%. Within the context of our model, this di¤erence in returns suggests that private equity expects to be able to improve the performance of an operating asset in ways not feasible for strategic …rms or the parent seller. Public strategic buyers obtain positive excess returns, 0.48%, suggesting some extraction of rents for their private information about expected synergies. However, in deals with public buyers, the combined wealth gains, and thus expected synergies, are low, consistent with prior empirical studies that report modest share price e¤ects (and thus weak synergistic gains) at asset sales to strategic buyers. For the large asset sales we examine, there is no evidence of the overbidding by public buyers that Bargeron, Schlingemann, Stulz, and Zutter (2008) …nd in their study of mergers.
As of year end 2011, 83% of the assets acquired by private equity have an exit. We con…rm the type of exit and calculate the annualized change in enterprise value over the period the asset is owned by the original private equity buyer. We …nd this gain to be signi…cantly greater than that of public benchmark …rms (matched by SIC code and enterprise value). Although these gains are not
a direct measure of pro…tability for investors in private equity funds, they provide a useful metric of the business success of the entity while it is owned by private equity. We …nd that parent seller gains at the original sale are related to the subsequent gains in the asset’s enterprise value measured as of the exit transaction. This evidence suggests that sellers to private equity obtain signi…cantly greater gains from sales of assets that later prove to be a rich source of value, with exits that are typically in the form of an IPO or trade sale (rather than a SBO or Chapter 11 …ling). These links support the view that corporate asset sales can be modeled as auctions, and that private equity bids re‡ect expected gains from owning and preparing an asset for exit.
Our work contributes to the asset sale literature by analyzing the role of an informed buyer and di¤erentiating private equity versus strategic buyers, a departure from prior studies that do not provide an analytical treatment of type of buyer and instead focus on the e¤ects on sellers (Jain, 1985; Hite, Owers, and Rogers, 1987; John and Ofek, 1995; Sicherman and Pettway, 1992; Maksimovic and Phillips, 2001). These studies are generally based on synergistic-type hypotheses that provide a useful framework for explaining intercorporate asset sales but little basis for explaining the participation of private equity as buyers in corporate asset sales. The few papers that compare …nancial buyers and strategic buyers study only acquisitions of listed …rms, not subsidiaries, with Bargeron et al. (2008) reporting greater gains to shareholders of targets taken over by public acquirers, a …nding they attribute to agency problems at listed acquirers. Gorbenko and Malenko (2010) also …nd that winning strategic bids have a higher mean than private equity bids. Rhodes-Kropf and Martos-Vila (2011) develop a theoretical model of di¤erences in the merger waves of private equity and strategic acquirers that is due to debt misvaluation.
are related to parent …rm gains contributes to the literature in a manner that di¤ers from prior private equity work. Studies on the operational performance of …rms controlled by private equity or on adjusted returns to fund investors, which are susceptible to issues of risk adjustment and selection bias in the data, tend to report ambiguous …ndings. Some studies show …rms controlled by private equity improve operating performance, reduce employment, and lower capital investment relative to public …rms (Kaplan, 1989a, 1989b; Muscarella and Vetsuypens, 1990; Lichtenberg and Siegel, 1990; Liebeskind, Wiersema, and Hansen, 1992). Other studies …nd that productivity changes at such …rms are little di¤erent from comparable public …rms, R&D investment is greater, and employment tends to increase (Cornelli and Karakas, 2011; Lerner, Sorensen and Stromberg, 2011; Leslie and Oyer, 2009; Guo, Hotchkiss, and Song, 2011). The evidence on returns to limited partners net of fees is mixed (Kaplan and Schoar, 2005; Phalippou and Gottschalg, 2009; Robinson and Sensoy, 2011).
The paper is organized as follows. In Section 2, our theoretical model is presented. Section 3 describes sample construction. Section 4 contains empirical results for the valuation e¤ects of asset sales, detailing the di¤erential e¤ects of alternative buyer types. Conclusions are in Section 5.
2. Theoretical analysis
2.1. The model set-up
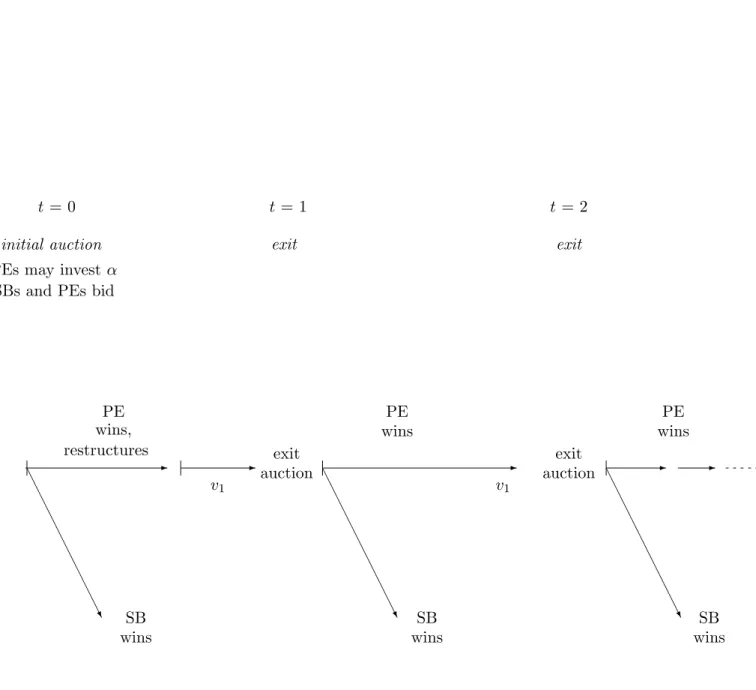
The model is in discrete time with an in…nite horizon. At time t= 0, a parent …rm sells an asset with a potential value of v1= 1 c1, where c1 is a constant perpetual cash ‡ow and is the discount factor. As a division of the parent, however, the asset has a present value of only v0 = 1 c0, where
c0 < c1, due to ine¢ ciencies in the current organizational form.4 We denote by Z = v1 v0 > 0 the loss in value due to these ine¢ ciencies. The asset is sold in an ascending bid auction where two
4
These ine¢ ciencies can encompass in‡uence costs that are generated by a subsidiary that undertakes non-productive activities, such as lobbying the parent for resources to bene…t the unit, that do not contribute to the value of the …rm as a whole.
populations of potential buyers participate: m private equity …rms, henceforth PEs, andnoperating …rms (strategic bidders), henceforth SBs. Within each population category, the composition of the buyer pool may vary over time.
In every period t = 0;1; :::, there is random draw of n > 1 potential strategic buyers from a constant population, so the distribution of potential buyer characteristics is i.i.d. across time, capturing the idea of a time-varying set of SBs with synergies between their assets and the asset for sale. For a given present value of cash ‡ows v 2 fv0; v1g, the valuation of the asset to SB i is equal tov+exi, where exi denotes the idiosyncratic operating synergies between the assets of SBi and the asset for sale. We assume the synergies, exi 2[xL; xH], with xL 0< xH, are exogenous and private information to SB i and that synergies are i.i.d. among the SBs with c.d.f. F in the initial auction or any subsequent contest for the asset. We denote by ex(1) and ex(2) the …rst and second highest synergies amongnSBs, respectively. LetF( )be the c.d.f. ofex( ), for = 1;2. We assumeE[exi]>0, implying that the expected synergies of SBs are positive. We allow forF(0) 0, so there is a positive probability that in a given periodt there are no SB bids for the asset.
PEs do not have operating synergies but they may have a comparative advantage at implementing a reorganization of the asset. PE ownership is transitional, so a PE that buys an asset will …rst restructure and then divest it to interested parties via an exit auction. We denote by v0+xP E the asset’s value to a PE bidder, wherexP E is endogenous and depends on the asset’s potential operating performance after restructuring and expectations about the asset’s value at exit.
PEs can enhance the asset’s value by eliminating ine¢ ciencies and improving the asset’s opera-tions. This restructuring increases per-period expected cash ‡ows fromc0 toc1. Once v1 is attained no further improvement is possible. It is during the initial round of PE ownership that the asset
un-dergoes the reorganization of being transformed from a subsidiary into an independent …rm, unlocking the potential value v1. A PE incurs a one-o¤ cost of e < Z for the initial restructuring. Although subsequent rounds may also generate positive bene…ts, they involve lesser degrees of organizational improvement and we normalize to zero the net bene…t of subsequent restructuring.
To keep the theory more tractable we assume that the restructuring abilities of di¤erent PEs are identical; that is, the parameters c0,c1 andedo not depend on the identity of the PE.
Before bidding in the initial auction att= 0, a PE must …rst spend 0to identify and evaluate the asset and its potential for restructuring and value improvement. Each PE simultaneously decides whether to invest and participate in the auction, or to abstain from bidding. Strategic buyers know their operating synergies and can participate without cost. If the asset is sold to SB i, it becomes part of the buyer’s operating structure and generates cash ‡ows with a present value of v0+exi. If the asset is sold to PE j, it will be reorganized and then sold via an exit auction with an ascending bid format, where potential buyers are SBs and PEs. At the exit stage, the …rst PE’s reorganization has already increased the asset’s value to v1.
2.2. Equilibrium and exit decision
We solve the game by backward induction. To proceed, we …rst determine the revenue that PE j
expects to receive if it owns an asset with performance v1. Second, we deducev0+xP E, i.e., PE j’s valuation of the asset in the initial auction. Third, we compute the PE’s expected equilibrium pro…t in the initial auction. Fourth, we compute the equilibrium PE entry decision. Thus, we can analyze the parent seller’s expected revenue in the initial auction, conditional on the winning bidder being a PE or a SB. We focus on symmetric equilibria.
v1, and that proceeds to sell it in one time period. This value is computed at the beginning of a given period t and just after the asset has paid that period’s cash ‡ow. Note thatVP E also represents PE
j’s expected continuation payo¤ just after having acquired the asset from the initial seller, investede
and received c1. ThenVP E must satisfy the following equation:
VP E = c1+ Z minfxH;VP E v1g xL VP EdF(2)(x) + Z xH minfxH;VP E v1g (v1+x)dF(2)(x) ! : (1)
This equation says that the PE receives c1 and then sells the asset via an (ascending bid) exit auction, where the potential bidders include PEs and SBs. The maximum amount a PE participating in the exit auction, i.e., PEk, is willing to pay isVP E. If in fact, PEkwins the auction (i.e., there is a SBO), then it will be in exactly the same situation as PEj currently is. Note that PEj prefers to retain the asset rather than selling it for strictly less than VP E. Thus, the exit auction will be won by the SB with the highest synergies, provided that its synergiesxei lead it to value the asset at more than VP E; i.e., v1+exi VP E. Otherwise, the asset will remain in the hands of a PE (either PE j or another PE buyer, PE k). Thus, the auction proceeds of PE j will correspond to the maximum of the second highest SB bid and VP E. Let x denote the second highest synergy among the n SBs. Recall that its c.d.f. isF(2). The payo¤ to PEj is v1+x > VP E if the second highest SB values the asset more than PE bidders; otherwise, it is VP E. This reasoning suggests that in equilibrium in an exit auction a SB winner pays more than a PE winner. Thus, when a PE-owned asset (a stand-alone entity) is auctioned o¤, the return to the (PE) seller will be greater on average when the asset is sold to a SB (trade sale) rather than to another PE (secondary buyout).
There are two separate sources that lead a PE to value the asset at VP E. One source is the PE’s ability to reorganize the asset so as to achievev1; thisrestructuring potential is measured byv0 v1.
The other is the potential pro…t a PE can obtain from auctioning an asset to SBs that have synergies with the asset at the exit.
Proposition 1 a) The unique solution of Equation (1) in VP E satis…esv1 < VP E < v1+xH. VP E increases in the asset’s restructured value v1, and in its resale potential that improves with , n and SBs’ expected synergies.
b) At exit, the PE’s expected revenue is higher when the asset is sold to a SB compared to the value when it is sold to another PE.
An asset with performancev1 is worth exactlyv1 to a bidder with no synergies that plans to hold the asset inde…nitely. A PE has no synergies and hence it will value the asset at least atv1; however it values the asset at more than v1 because it expects additional pro…ts from its option to sell to future SBs with positive synergies. The value of the asset to a PE increases with each source of value:
v1 and the resale potential. As a PE is indi¤erent between retaining the asset and selling to another PE, a SBO provides the lowest exit auction revenue to PE.
2.3. PE entry decision, initial auction, and PE revenue
From the previous section we are able to deduce that the maximum amount the PE is willing to pay in the initial asset auction is VP E ewhere VP E is as described in Proposition 1. This amount corresponds to the present value of next period’s expected cash ‡ow and the exit revenue, net of the restructuring coste. We de…ne
xP E =VP E e v0 >0
as the extra value a PE attaches to the asset compared to the value of the asset to the parent seller.5 5Note thatV
The value of the asset for SB iis exogenous and equal to v0 +xei 2[v0+xL; v0+xH]. Thus, in the symmetric equilibrium of the initial auction each bidder will increase its bid until it reaches its own valuation of the asset. Since all PEs value the asset the same, as long as there are at least two PEs in the initial auction they will bid up to their valuation and realize zero pro…t. Alternatively, a PE that does not face competition from other PEs will pay the maximum between v0, the starting price, and the highest SB valuation as long as the amount does not exceedv0+xP E. In this case, its expected pro…t is strictly positive and equal to6
P E = Z xP E 0 (v0+xP E (v0+x))dF(x)(1)+xP EF(1)(0) = Z xP E 0 F(x)(1)dx >0:
We now consider the PE decision to invest and bid for the asset in the initial auction. The entry decision depends on whether or not other PEs enter the auction. We show in the Appendix (Lemma 1) that in the unique symmetric equilibrium, each PE participates in the initial auction with probability q = 1 ( = P E)m11 if
P E > , and 0otherwise.
2.4. Empirical implications
To compare the average levels of winning SB bids and winning PE bids, we consider the compar-ative statics of a variation in any of the underlying parameters.
Valuation hierarchy of SB buyers and PE buyers in the initial auction. Let us …rst consider the benchmark where PEs have no restructuring ability but simply buy an asset today to resell it in the following period. If Z = 0, given that the PE has no ability to restructure the asset, it is natural to assume e= 0 because the PE will not invest in the restructuring of the asset. Moreover, = 0
because a PE will not spend resources to identify the restructuring potential of assets that are known
6
not to be restructurable by a PE. Still, PEs provide asset liquidity as they might make opportunistic bids to bene…t from mispricing, i.e. to acquire an asset that currently receives only low-value strategic bids that fall short of the asset value VP E when accounting for expected exit valuations driven by future synergistic bidders. We can formally derive the following testable implication for seller revenue:
Hypothesis 1 (No Restructuring) If PEs have no or little restructuring ability, then the seller revenue from a winning SB bid is strictly larger than the seller revenue from a winning PE bid.
A formal proof of the no-restructuring hypothesis is stated in the Appendix (Corollary 1). By contrast, when a PE has some restructuring capability it is reasonable to assume 0 < e < Z
and >0. We consider changes in the parametersc1, , n and F that increase xP E, variation that jointly explains the frequency of a PE outcome and the expected di¤erence between a winning PE bid and a winning SB bid. Proposition 1 indicates that a PE’s endogenous value component, xP E, is increasing in the restructuring potential and the resale option value. Moreover, as we show in the Appendix (see Corollary 2), the probability of a PE winning the auction will increase in all parameters that positively a¤ectxP E. At the same time these parameters have a positive impact on the parent’s expected revenue when selling to a PE. ForxP E large enough, this revenue is higher than the revenue obtained when selling to a SB. These analytical results (Corollary 2 in the Appendix) allow us to generate a comparison of the average levels of winning SB bids and winning PE bids.
Hypothesis 2 (Restructuring) The average seller revenue from a winning PE bid is strictly larger than the seller revenue from a winning SB bid if and only if PEs’ restructuring ability is su¢ ciently important.
Hypothesis 1 and 2 provide an empirical test to better understand the source of value created by a PE: a higher parent’s average revenue from selling to PEs rather than SBs must be related to PE
ability to restructure the asset. On the contrary, the reverse ranking on revenues is compatible with the absence of PE restructuring ability.
Excess performance under PE control. In the model the improvement fromc0toc1is only available if an asset is PE-controlled, which by de…nition does not apply to a public benchmark …rm. Hence we predict:
Hypothesis 3 (PE Outperformance) If PEs have restructuring potential, the performance of the asset under PE control should exceed that of a benchmark publicly traded …rm.
This prediction and the previous one are related because it is the ability of the PE to generate excess performance from the asset that allows PEs to outbid SBs, on average.7
Our model implies that PE bids in the initial auction and the expected performance under PE ownership should be positively related. Speci…cally, the theory predicts that PE bids are increasing in
xP E that in turn are increasing in resale potential or the asset liquidity, i.e. the expected distribution ofex(2) at exit. When the resale potential is relatively low, the PE is more likely to exit in a secondary buyout; when the resale potential is high, the PE is more likely to exit by selling to a SB. This result leads us to our last hypothesis:
Hypothesis 4 (Seller Gains, Asset Performance and PE Exit) The seller gains generated by winning PE bids and the value creation of the asset until PE exit should be positively related. The seller gains should be higher on average when a PE exit occurs via a sale to a strategic bidder than via a secondary buyout.
7
Note that it is the excess performance of PE buyers and the valuation hierarchy in the initial auction that indicate that PEs have unique restructuring potential, not the fact that we observe winning PE bids. In our model, even in the absence of restructuring potential (i.e., v0 =v1 =v2), xP E is normally strictly positive because of the asset’s resale
Additional predictions, such as predictions that relate to the choice between exit routes and asset performance, can be generated if we extend the model in the directions suggested in the following subsection. We will discuss such predictions in our empirical analysis below.
2.5. Discussion and extensions
In this section, we discuss several directions as to how the model can be extended and how each of these modi…cations a¤ects the analysis, in particular when altering four assumptions: One, we assumed that after a PE buys the asset in the initial auction, the outcome of the restructuring is certain. Two, we assumed that a SB cannot resell the asset after acquiring it. Three, we assumed that PEs are homogeneous in their restructuring abilities. Four, we assumed that the PE advantage - the reason that PEs can win in the absence of synergies - lies in their exclusive restructuring capabilities and not in an informational advantage that simply allows them to identify undervalued assets.
First, consider the case where the outcome of the process of restructuring an asset under PE control is unknown ex ante. Because the asset is taken private under PE ownership, it is natural to assume that only the PE controlling the asset observes the exact restructuring outcome (unless the asset goes bankrupt triggering a Chapter 11 court …ling). However, if the PE decides to exit its investment through an IPO, then it is natural to assume that the asset’s true value will be fully disclosed given the extensive transparency requirements (i.e. public …lings) intrinsic to the IPO process. As a consequence, we can show that under certain conditions the PE will prefer to sell the asset through an IPO only when the restructuring generates a higher value than expected. A PE will adopt a less public form of exit, such as the exit auction in our baseline model, when the restructuring leads neither to a distressed (bankruptcy) outcome nor to a very high intrinsic value. As a result, we can demonstrate that a hierarchy emerges linking the performance of the restructuring process under
PE control and the type of exit: distressed assets that perform very poorly will be liquidated through a bankruptcy procedure; assets with the most successful restructuring outcomes are sold publicly via an IPO; and those assets with intermediate outcomes are sold in an exit auction to either SBs or PEs following the same hierarchy of Proposition 1 (b). Finally, if we further assume that the expected time until completion of each of the di¤erent restructuring outcomes is uncertain, then we can show that the expected duration from purchase until exit is inversely related to the expected annualized gain in performance under each of the di¤erent exit routes: IPO, trade sale, and SBO.
Second, suppose that, like PEs, a SB that buys the asset can also later resell it either to another SB with higher synergies or to a PE. In this case, a SB with synergies x < xH would value the asset with intrinsic valuev at more thanv+x because there is a positive probability that a SB with synergies larger than x will bid for the asset in the next period. This potential would increase the asset’s market value due to the higher re-sale opportunity and it would also increase a PE’s valuation for the asset. If a PE has no restructuring ability, then it will value the asset and behave exactly like a SB whose level of synergies is nil, that isxP E = 0. Hence our result of Hypothesis 1 would still be valid. Since the main economic trade-o¤s remain unaltered, we conclude that only the presence of unique restructuring abilities of PEs can generate an outcome in which PEs make bids higher that of a SB with zero synergies. After the initial auction, only SBs will be able to o¤er synergy gains so they will outbid PEs in an exit auction, implying that no SBOs occur.
Third, let us consider the case in which PEs di¤er in their restructuring capabilities. Assume for example that the net gain v1 v0 e is not the same for all PEs. This modi…cation would translate into di¤erent levels of xP E for di¤erent PEs, re‡ecting their heterogeneous restructuring capabilities. We need to consider two subcases, depending on PEs’ information. Assume …rst that
each PE is initially uncertain about its true restructuring capability but receives a precise signal about its capability once it invests > 0. If PEs across the board have very low restructuring abilities, Hypothesis 1 would apply because there would be no gain to investing to learn xP E. Even if the levels of xP E are su¢ ciently dispersed and PEs invest , the entry decision and the resulting entry equilibrium would not qualitatively di¤er from the case of homogeneous PEs. However heterogeneity of PEs does generate two noteworthy e¤ects. One, bids of PEs in the initial auction will be more dispersed. Two, because a PE with high restructuring capability can make a pro…t when competing against a lesser-capable PE, the ex-ante incentive to enter the initial auction is stronger. The other subcase is the case in which PEs know their restructuring capabilities before investing .8 In this case only PEs with su¢ ciently high restructuring capabilities would enter the auction. This e¤ect would reinforce the result that the seller’s expected revenue from winning PE bids is higher than the seller’s expected revenue from winning SB bids.
Fourth, consider the case in which the PE’s advantage is based on superior information about the asset- an alternative explanation as to why PEs can outbid SBs in spite of a lack of synergies
-not on a PE’s unique restructuring abilities. Suppose that PEs have some private information that allows them to identify undervalued assets. To be more precise, assume that PEs get a precise signal on the asset’s intrinsic value, v1 orv0. However, any party that gains control of the asset, whether SB or PE, achieves the same intrinsic value for the asset, augmented by synergies xi in the case of an SB. In auction theory language, in addition to the private value format of heterogeneous SB synergies that we have considered so far, the auction then also includes a common values component, namely the true valuev~2 fv0; v1g on which PEs are better informed. This assumption introduces a winner’s curse element into the bidding strategies of SBs, with the e¤ect of reducing the seller …rm’s
expected revenue.9 It is, therefore, in the seller’s interest to adopt an auction format that reveals a maximum of information about PE bids, such as a non-anonymous ascending bid auction. This auction format eliminates PEs’informational advantage because SBs are able to update their beliefs about the common values component~vas a function of the PE bids they observe. In equilibrium, SB
iwith private value xi outbids PEs whenever xi > xP E. In this setup, it can be shown that it is not optimal for PEs to invest in information acquisition since they cannot pro…t from the information; but PEs participate in the auction and they sometimes win - whenever xP E >ex(1). As a result, this variant of the model robustly predicts that PEs generate lower winning bids than SBs, i.e. the same prediction as in Hypothesis 1. In other words, this extension allows us to conclude that within the scope of our model it is the presence of su¢ ciently large unique PE restructuring abilities that are a necessary model ingredient to obtain an equilibrium in which PEs generatehigher winning bids than SBs.
3. Sample
To consider the implications of the model we obtain sales of large operating assets that are wholly owned by publicly traded parent …rms from the SDC Acquisition Database for 1994 through 2004.10 We con…rm that each event is a corporate asset sale, identify the initial announcement date, and obtain relevant transaction data from SEC …lings, Factiva, Lexis-Nexis, the Wall Street Journal, and Standard and Poor’s Stock Reports, Stock Guide, and Directory of Corporations, and web sites of private equity …rms. Events are categorized by type of buyer: private equity, public operating …rm, and private operating …rm. We also require that the relevant fund of the private equity buyer of the asset does not own an operating …rm that will be merged with the asset. We verify that the
9
See for instance Milgrom and Weber (1982).
1 0The sample ends in December 2004 to allow enough time to observe su¢ cient private equity exits to generate useful perspective about the implications of the model.
public parent is not in bankruptcy nor divesting the asset due to a regulatory or judicial mandate. The identity of the buyer and terms of the transaction must be publicly reported and the transaction must transfer full ownership of the asset. To minimize reporting bias, the minimum transaction price is $100 million, a condition that increases the probability that each asset is of su¢ cient size and stature to be material, and that for sales to private equity the business is likely to warrant su¢ cient interest in the business press to generate coverage of the date and type of exit transaction.
The …nal sample consists of 146 private equity deals, 287 deals with public strategic buyers, and 48 deals with private strategic buyers. Descriptive statistics are reported in Table 1; values are in constant (1997) dollars. The transactions are large deals with an average (median) value of $398 ($212) million for sales to private equity, $644 ($255) million for sales to public strategic buyers, and $308 ($222) million for sales to private strategic buyers. None of the di¤erences in means (medians) is statistically signi…cant. Median transaction values are almost identical, suggesting that private equity has been an e¤ective competitor in asset sales. The mean (median) seller market capitalization is $22 ($4.6) billion, $21 ($5.2) billion, and $8 ($2.6) billion in the respective subsamples; for public buyers it is $22 ($2.7) billion. The median ratios of transaction price to seller market value are of similar magnitude. A broad range of industries is represented with 105, 156, and 38 di¤erent 4-digit SIC codes for the assets in the respective subsamples.
4. Empirical results
4.1. Valuation e¤ ects of corporate asset sales
We consider …rst the alternative hypotheses. In Table 2, two-day market model average excess returns, proportion of returns positive, and median returns at the initial sale announcement are reported. For asset sales to public strategic buyers, seller excess returns are signi…cantly positive,
1.25%, t-statistic of 6.10 (median of 0.27%), and are similar to previously reported results (Jain, 1985; Hite, et al., 1987; John and Ofek, 1995; Sicherman and Pettway, 1992; Hege, Lovo, Slovin, and Sushka, 2009). The median transaction return, 2.85% (p= 0:29), is reported to provide a metric for the economic importance of seller gains. As in previous studies, the results show that the market views corporate asset sales as value increasing for sellers, but the typical change in seller value is small relative to the size of the asset and is well below the premiums of 25% or more observed for stand-alone targets in merger studies. For sales to private strategic buyers, seller excess returns are 0.95%, t-statistic of 2.19 (median of 0.46%), and are not signi…cantly di¤erent from the results for public buyers. The median seller transaction return, 3.68%, is also similar to public buyer deals.
For asset sales to private equity, seller excess returns are positive and economically large, 3.78%, t-statistic of 12.42 (median is 2.06%); the proportion of returns positive is 82%.11 The mean and median seller returns are each signi…cantly greater than seller returns in deals with public buyers (p = 0:00) and private operating …rms (p = 0:01). The median seller transaction return, 22.25% (p= 0:00), is also signi…cantly greater than in deals with public or private strategic …rms (p= 0:00). This pattern of higher seller returns provides a metric of the value that is generated by private equity in the asset sale market and is consistent with Hypothesis 2, that private equity has an ability to generate excess performance from the asset that allows PEs to outbid SBs, on average. Our …ndings contradict Hypothesis 1, that PEs are characterized by the absence of restructuring abilities. Our …ndings also contradict the view that PE performance in asset sales in primarily due to o¤ering bids for undervalued assets; as discussed in Section 2.5, if PE bids were based on private signals about an
1 1
By their nature, private equity funds do not use equity as the means of payment in their transactions and thus our sample does not include deals in which sellers accept a block of equity in public strategic buyers as the means of payment. We note, however, that the large returns to sellers in private deals are of a magnitude similar to that reported for asset sales in which buyer equity is utilized as the means of payment, as reported in Slovin, Sushka, and Polonchek (2005) and Hege, Lovo, Slovin, and Sushka (2009).
asset’s common value, PEs would generate lower winning bids than SBs. Since our model implies that unique PE restructuring abilities are the ingredient necessary to obtain a bidding hierarchy in which PEs generate higher winning bids on average relative to SBs, our event study results support the view that PEs contribute valuable restructuring capabilities to the assets they acquire from parent …rms.
Our …nding of greater returns to sellers when assets are sold to private equity is opposite to Bargeron, et al. (2008) who report greater gains (premiums) to mergers of stand-alone targets acquired by public …rms, a result they ascribe to overbidding due to agency problems at public buyers. However, we …nd positive average returns to public acquirers in asset sales, 0.48%, t-statistic of 3.10 (median is 0.33%), implying that public buyers extract a modest rent for their private information about expected synergies so their behavior in the aggregate does not re‡ect agency problems (such as hubris or empire building) as discussed in the merger literature (Thaler, 1988; Barberis and Thaler, 2003; Baker, Ruback, and Wurgler, 2007). On the whole, modest gains in combined shareholder wealth at asset sales to strategic buyers imply there are modest synergistic gains in these transactions, consistent with …ndings reported in prior asset sale studies. The comparison between Hypothesis 1 and Hypothesis 2 is a possible avenue to explain the discrepancy between our …ndings for asset sales and those of Bargeron et al. (2008) and Gorbenko and Malenko (2010) for mergers.12In this view, the restructuring potential of PEs is on average larger in asset sales than in mergers of stand-alone …rms, based on the potential advantages associated with changes in organizational form (e.g., elimination of in‡uence costs) that are exclusive to asset sales.
In our theoretical model the improvement in asset value from v0to v1 is only available for an 1 2Gorbenko and Malenko (2010) analyze competitive auctions for …rms (and not subsidiaries), and …nd that strategic buyers bid more than private equity, results that can be viewed as consistent with Bargeron, et al. (2008).
entity controlled by private equity. On this basis, a winning private equity bid is not expected to have information content for other (benchmark) …rms in the industry - such an e¤ect would be indicative of private equity’s ability to act on private (industry common) information rather than a restructuring capability speci…c to the asset of a seller …rm. Such an alternative hypothesis would lead us to predict the inverse hierarchy of seller gains, as discussed in Section 2.5. To assess this possibility, we evaluate the intra-industry e¤ect by examining share price responses of public benchmark …rms with activities similar to the asset sold. If a bid were to convey new industry common information, then share prices of the benchmark …rms should increase at the sale announcement. We identify CRSP …rms with the same 4-digit SIC code as the asset, use these …rms to construct an industry portfolio for each event (equally weighting all rival …rms per event), and obtain the average portfolio excess return over all of the events in each sample. For each of the three subsamples the intra-industry e¤ects are small and not statistically signi…cant, implying that there is little industry common information conveyed by an asset sale to private equity, or indeed any asset sale irrespective of buyer type. This …nding supports the view that the gains from asset sales do not ‡ow to other …rms in the industry.
4.2. Exit transactions and economic performance for private equity deals
Our auction model indicates that private equity bids are related to expectations about future revenues from exit transactions. Based on our empirical …ndings so far, Hypothesis 3 implies that assets under private equity control should outperform benchmark …rms. Hypothesis 4 indicates that parent …rm returns should be related to private equity’s expectations about its ability to generate value and successfully exit the investment. Thus, if ex post realizations and ex ante expectations are related, seller returns should be related to the ex post gains in asset enterprise value that are eventually generated by private equity’s management of the asset.
We investigate these predictions by determining the exit status (through year-end 2011) of each asset acquired by private equity. Because the sample includes all large eligible operating assets sold by public …rms from 1994 through 2004, our …ndings about subsequent outcomes are not subject to the selection bias problems in many studies of private equity (di¢ culties generated by the secretive nature and lack of disclosure intrinsic to private equity). Once acquired by private equity, the assets in our sample are not public entities so there is little disclosure about their operating performance or capital structure, although some information reported in the business press suggests they are highly levered. Nevertheless, we are able to identify the terms for all of the 121 exit transactions and to con…rm that the 25 assets without an exit are still owned by the original private equity buyers.
In Panel A of Table 3, the average time to exit is 3.4 years. We …nd that exit is most rapid for IPOs (2.1 years), somewhat longer for trade sales (3.2 years), and longest for SBOs (5.0 years). SBO time to exit is signi…cantly longer than for IPOs and strategic exits (p= 0:01), which suggests private equity sells an asset to another private equity …rm when a timely exit by IPO or trade sale is not likely. This result suggests that SBOs may be regarded as less successful outcomes, or cases of incomplete restructuring. In 20 cases, exit is by bankruptcy (4.4 years).
To determine the ex post (annualized) rate of increase in asset enterprise value during the period of private equity ownership, we obtain the transaction price, or market value of equity plus book value of debt, depending on the type of exit, and compare it to the original sale price. This metric is not a direct measure of the pro…tability for fund investors, but it is a useful gauge of an entity’s economic performance. To the extent that SBOs and bankruptcies can be viewed as less satisfactory outcomes for private equity, our theory suggests that asset performance and type of exit mechanism are related, with performance expected to be higher for IPOs and trade sales than for SBOs and
bankruptcy …lings (where IPOs and bankruptcy are discussed in Section 2.5). The data also allow us to examine whether there is a similar pattern of the gains in wealth to the original parent …rm seller and whether there is a di¤erentiation by type of exit.
The mean (median) annualized growth rate in enterprise value (EV) for the 121 assets with exits is 48.45% (18.69%). To benchmark these results, the annualized growth rate in enterprise value over identical periods is calculated for public …rms with the same 4-digit SIC code as the asset that was closest in enterprise value to the original sale price of the asset. The mean (median) annual growth rate for the benchmark …rms is 20.53% (6.12%) and the di¤erence in sample and benchmark …rm means (medians), Excess EV, is statistically signi…cant,p= 0:00(p= 0:00). This result suggests that, while owned by private equity, the acquired entities achieve considerable business success relative to their benchmark …rms, a …nding that is consistent with Hypothesis 3. The changes in enterprise value at sample and benchmark entities are highly correlated, 0.74, consistent with the expectation that an asset’s growth is related to the growth rate of its industry, but the overall pattern of results suggests that private equity skills contribute to asset value and that a portion of the capitalized value of these gains is received by the original parent …rm sellers at the initial asset sale.
We disaggregate the results by type of exit. Entities that …le Chapter 11 retain very little value, as re‡ected in an average (median) annual decline in enterprise value of -27.11% (-21.20%). Given 20 Chapter 11 …lings, bankruptcy of private equity-owned assets is signi…cantly (p= 0:01) more frequent than for benchmark …rms (with seven …lings). In principle, private equity ownership of an asset could still increase the enterprise value of an entity despite a bankruptcy …ling. For example, a sustainable business that becomes overlevered, may be reorganized as an ongoing concern through a negotiation between equity holders and creditors, either in the form of a prepackaged bankruptcy or under the
guidance of a bankruptcy judge.13 However, in our sample, bankruptcy typically occurs after almost complete business failure, resulting in the loss of the private equity stake and large losses to unsecured creditors. Liquidation of the entity occurs in ten cases, with minimal payments to unsecured creditors, and equity is cancelled (no payment to private equity). In eight other cases reorganization occurs but almost all enterprise value is lost, with unsecured creditors absorbing large losses and equity interests cancelled. In only two cases is there a reorganization in which some private equity interests are conveyed to debtholders, resulting in a less levered entity where private equity retains a minority stake.
The systematic pattern between gains in enterprise value and type of exit suggests a hierarchy with respect to business success that is consistent with other literature. The highest mean (median) annual growth rate in enterprise value occurs for IPOs, 111.52% (43.64%), consistent with the model extension discussed in Section 2.5, and is signi…cantly greater than for benchmark …rms. The next highest mean (median) growth rate is for exit by sale to strategic buyers, 36.81% (24.78%), also signi…cantly greater than their benchmarks. This estimate of the gains in enterprise value for trade sale exits understates the overall (global) economic gains since these transactions also add to buyer value. More speci…cally, in 22 of the 37 trade sale exits the strategic buyers have CRSP returns, and the average excess return for this group of buyers is 4.20% (p = 0:00); the average transaction return is 10.50% (p= 0:05); the relevant median returns are 2.96% (p= 0:00) and 7.75% (p= 0:00), respectively. The positive buyer excess returns in exit deals indicates that there is no evidence of overbidding by public strategic buyers in these exit transactions, just as there is no overbidding in in the initial deals or in the previous literature on asset sales.
1 3For example, Kaplan (1989a) has argued that Campeau’s acquisition of Federated Department Stores added value even though it ended in bankruptcy.
Although SBOs could be viewed as an alternative form of asset sale (where the buyer is another private equity …rm rather than a strategic …rm), our theoretical model predicts that in equilibrium a strategic buyer pays more than private equity at the exit auction. The intuition for this prediction is that strategic bids encompass synergies that add value to the restructured asset, together with the expectation that the greatest improvements in restructuring an asset have already been carried out by the original private equity buyer, leaving less scope for value creation by a second private equity owner, who in e¤ect can be viewed as a buyer of last resort. Our model suggests that a private equity …rm is indi¤erent between keeping the asset or selling it to another private equity …rm. SBOs can also be viewed as a means of exit employed by private equity when the termination date of a private equity fund draws near and strategic buyers are scarce (Kaplan and Schoar, 2005).
For the 23 SBOs, the mean (median) annualized growth rate in enterprise value is 20.48% (10.38%), signi…cantly less than for assets sold to strategic buyers, p= 0:09 (p = 0:05). This …nding suggests that exit by SBO is associated with poorer performance of the asset relative to exit by IPO or strategic sale, although mean (median) performance is signi…cantly (p = 0:05) more favorable than the gains in enterprise value achieved by benchmark …rms. We note that the greater gains in enterprise value when assets owned by private equity (which like the target …rms in a merger study are stand-alone entities) are sold to strategic buyers rather than other private equity …rms, parallels results reported by Bargeron, et al. (2008) that there are greater gains (premiums) to merger targets acquired by public …rms rather than private equity. While they attribute this result to overbidding by public buyers (due to agency problems), our theoretical model predicts this pattern of behavior for asset sale exits with no overbidding by public buyers.
potential to improve the asset than the initial private equity owner. This reasoning implies that the asset’s performance during the second buyout period should be no better than that during the initial round of private equity ownership. To test this implication, we examine the outcomes when the subsequent SBO itself exits; as of year-end 2011, 11 of the 23 SBOs have such exits. In Panel B, performance during ownership by the second private equity …rm is broadly similar to that of the initial private equity …rm. The second private equity …rm holds the asset for an average of four years and the mean (median) annualized growth rate in enterprise value is 15.19% (16.76%). Neither …gure is statistically di¤erent from the gains for the …rst private equity round. Moreover, the second round gains di¤er little from the average (median) gains in enterprise value of their benchmark …rms, 14.92% (10.00%). These results suggest that SBOs are a less favorable form of exit relative to IPOs or sales to strategic buyers.
The overall pattern of the growth in enterprise value for benchmark …rms shows the same hier-archy as that of the sample assets. This evidence suggests that expectations about future industry developments are a factor in determining bids by private equity. Nevertheless, taken as a whole, our results indicate that the average (median) growth rate in enterprise value for assets originally acquired by private equity exceeds that of their benchmark …rms, suggestive of an ability of private equity to generate business improvements for the assets that are divested by corporate sellers.
Hypothesis 4 suggests that the pattern of gains to parent …rm sellers should parallel the subsequent changes in asset enterprise value observed in exit transactions, and our empirical results conform to this prediction. Speci…cally, there are large statistically signi…cant gains for parent …rms that sell assets to private equity and that subsequently exit via an IPO or a strategic asset sale, with median transaction returns of 45.05% (p = 0:00) and 24.72% (p = 0:00), respectively. By contrast, parent
…rms that sell assets that eventually sustain bankruptcy have a median transaction return of 7.15% (p = 0:04), a …gure signi…cantly smaller than returns to sellers of assets that eventually exit private equity via IPOs (p = 0:05) or strategic sales (p = 0:10). The median seller transaction return for SBO exits, 16.71% (p = 0:00), is smaller than exits by IPO or sale to strategic buyers, but greater than exits by Chapter 11. These results suggest that private equity submits lower bids, resulting in weaker gains to sellers, when it expects to be able to generate only modest gains from the asset.
Our theory predicts that a private equity bid, and in turn seller excess returns, conveys information about expected future payo¤s and PE ability to exit the investment successfully. To test whether our data indicate a relationship between the excess return of initial parent sellers and subsequent asset performance, we estimate regressions that include the parent seller (transaction) return as an independent variable together with additional variables that control for other determinants of perfor-mance success using a set of widely used measures. The estimated coe¢ cients of these regressions are reported in Table 4. The …rst dependent variable is the excess EV (i.e., the di¤erence between the annualized growth rates in enterprise values of the asset and its benchmark). The coe¢ cient of the seller transaction return is positive and signi…cant, suggesting that the seller’s share price reaction at a private equity deal provides a useful metric for the future success of private equity investments. Our second performance metric is a pro…tability index, for which we obtain similar results.14 In these regressions, there is some evidence that deals that exited during the high tech bubble (1999-2001) generated lower gains in enterprise value.
Our third performance measure is a binary variable of the relative eventual success, IPO or strategic asset sale, versus relative failure, bankruptcy or SBO, using a binomial logit model. The
1 4The pro…tability index has been introduced in the literature to mitigate holding period biases typically present in private equity investments (e.g., Phalippou and Gottschalg, 2009).
coe¢ cients for the seller transaction return are highly signi…cant, providing an estimate as to how an increase in the transaction return for the parent …rm seller a¤ects the marginal likelihood of the type of exit. The qualitative variable for exit during the high tech bubble years, while associated with lower growth rates in enterprise value, has a positive coe¢ cient in the logit regression, suggesting exits by IPO and strategic sales were more likely during this period. There is no evidence that success is related to the size of the transaction.
Overall, the seller transaction return is signi…cant in all three speci…cations. The results are consistent with a central implication of our theoretical model, namely, that private equity expectations about future payo¤s a¤ect their bidding for an asset, and the gains to selling …rms.
4.3. Cross-sectional regression analysis
We use regression analysis to test whether other factors, speci…cally observable seller or asset characteristics, a¤ect the statistically signi…cant greater gains to sellers that are generated in deals with private equity buyers. The dependent variable is de…ned as seller transaction returns and alternatively, seller excess returns. In each regression, two qualitative variables for the type of buyer are speci…ed. One variable takes on the value of unity for private equity and zero otherwise. A second variable takes on the value of unity for private strategic buyers and zero otherwise. We report a representative set of regressions in Table 5 in which the dependent variable is the transaction return. The pattern of results is similar when the dependent variable is seller excess returns.
The coe¢ cients of the qualitative variable for private equity are positive and consistently large and signi…cant, and are robust with respect to the inclusion of other variables that re‡ect characteristics of asset sales, including variables tested in other asset sale studies. Seller variables reported include the size of the transaction relative to enterprise value, seller market capitalization, prior cumulative
stock price performance, operating performance (ROA), market to book ratio, insider holdings, and use of proceeds (equal to one for debt reduction or repurchase of equity, and zero for retention). The e¤ect of the variable for private equity buyers remains positive and strongly signi…cant, irrespective of the regression speci…cation. We test a large array of other independent variables but …nd that they are not statistically signi…cant; for economy of presentation they are not reported in the table.15
Since Lewellen, Loderer, and Roenfeldt (1989) suggest that high insider ownership mitigates agency problems at buyers and Bargeron, et al. (2008) report greater returns to target …rms acquired by publicly traded …rms with low insider ownership, we also specify variables for insider ownership of public strategic buyers. We …nd no e¤ect of buyer insider ownership on seller returns (results available upon request). Together with the positive excess return to strategic buyers, this result suggests that bids by public acquirers do not re‡ect agency problems.
Given private equity funding cycles and evidence that well-established funds bene…t from market ‡uctuations (Gompers and Lerner, 1998; Gompers, Kovner, Lerner, and Scharfstein, 2008; Ljungqvist, Nanda, and Singh 2006), we assess whether greater seller returns in private equity deals are related to …nancial market conditions. We include a wide array of variables that are known to a¤ect private equity investments and to capture market timing opportunities.16None of the variables is statistically signi…cant and the qualitative variable for private equity deals remains consistently signi…cant, indi-cating the e¤ect of the type of buyer for seller returns. We also test variables to re‡ect the reputation
1 5
The results are available upon request. Other seller variables tested but not statistically signi…cant include leverage, dividend payout, time listed on CRSP, growth in intangible assets, and measures of R&D. Alternative measures of size and capital structure do not alter the results. Also tested are variables that gauge focus, complexity, and opacity, including whether the asset has the same SIC code as the parent (or public buyer), the number of seller business segments, the relative importance of the segment in which the asset is sold, and whether the seller is a conglomerate. Overall, there is no evidence that the greater gains to seller …rms are a¤ected by observable seller or asset characteristics. 1 6The variables tested are 1-year and 3-year lagged performance of S&P500 and Nasdaq indexes, S&P500 operating performance, and dividend yields; for debt markets, bond term spread and corporate credit spread; for exit markets, Fama-French book-to-market ratio, number of IPOs, IPO …rst-day returns, and percentage of positive …rst-day returns; and for the relationship of capital supply and capital disbursements, capital raised but not invested by funds over the past …ve years.
of private equity …rms by including dummy variables for deals in which buyers are the large, best known private equity …rms, but the coe¢ cients are not statistically signi…cant, suggesting that the identity and reputation of the private equity …rm does not a¤ect seller returns.
5. Conclusions
In this paper we provide a theoretical and empirical analysis of corporate asset sales, allowing for the participation of both private equity and strategic buyers. We develop an auction model of bidding competition that integrates the behavior of private equity interests with that of strategic buyers, providing a theoretical framework that conforms to the institutional structure of the asset sales market and the business model of private equity. In our model private equity’s valuation of the asset is endogenous, and is in‡uenced by the value that can be generated by private equity before it exits the investment. Competitive bidding conveys private information held by strategic buyers as well as the value that private equity expects to generate contingent on having control of the asset. We show how gains in parent …rm seller wealth are a¤ected by the type of winning bidder, and that the di¤erence in seller returns generated by private equity versus strategic buyers is driven by whether private equity has the ability to increase value through restructuring.
We use the model as a framework to analyze sales of large corporate operating assets from 1994 through 2004, and we follow the exit pattern of private equity buyers through year-end 2011. Increases in shareholder wealth at seller …rms for sales to private equity are signi…cantly greater than for sales to public or private strategic buyers, suggesting the importance of restructuring gains as a basis for private equity bids. We …nd no intra-industry gains at news of asset sales, irrespective of buyer type, suggesting that the information conveyed is asset-speci…c. We evaluate the change in the enterprise value of assets acquired by private equity for the period from acquisition to exit. We …nd that the
annualized growth rate in the asset’s enterprise value is signi…cantly greater than for public benchmark …rms, suggesting the economic importance of private equity’s business skills. We also determine the type of exit. The majority of exits are IPOs or strategic asset sales, with a lesser percentage of secondary buyouts and bankruptcies. We …nd that parent seller returns at the original asset sale announcements are directly related to the subsequent gains in enterprise value, with sellers earning signi…cantly greater gains for assets that exit by IPOs or sales to strategic buyers rather than by secondary buyouts or bankruptcies. Thus, private equity generates large gains in wealth for selling …rms in the case of assets that subsequently prove to be a rich source of value.
Appendix
Proof of Proposition 1: (a) After rearranging equation(1) we obtain:
VP E v1 E h
maxfVP E v1;x~(2)g i
= 0: (2)
Equation (2) has a solution in(v1; v1+xH)because its lhs is equal to E maxf0;x~(2)g <0and(1 )xH >0 for VP E =v1 and VP E =v1+xH, respectively. Also the derivative of the lhs of (2) with respect toVP E is
1 F(2)(VP E v1)>0 implying the solution of (2) is unique. From the implicit function theorem applied to equation (2), it follows that VP E increases in v1, ,nand in a change in the cdf from F toF0 whereF0 …rst order stochastically dominatesF.
(b) The minimum selling price at the exit auction equals VP E, and VP E is also the maximum price any buying PE would pay. Hence a SB winning the exit auction must have paid at leastVP E.
Lemma 1 In the unique symmetric equilibrium, the probability with which each PE participates in the initial auction is q = max ( 0;1 P E 1 m 1) (3)
that is non-decreasing function ofxP E.
Proof of Lemma 1: Note that if PEj does not participate in the initial auction its payo¤ is nil either because it will never buy the asset or because it will buy it at the fair PE valueVP E from another PE via an exit auction. If PEj invests to participate in the initial auction, then its payo¤ is + P E if it is the only PE bidder and otherwise. If P E < , no PE will ever invest and the resulting q is nil. Consider the case P E and letqbe the mixed strategy entry probability adopted by each of the otherm 1 PEs in a symmetric equilibrium. Then PEjis indi¤erent between entering or not, if and only if +(1 q)m 1
P E = 0,
which is true forq=q . The fact that q is non-decreasing inxP E follows from P E =
RxP E
0 F(x) (1)dx.
Hypothesis 1 (No restructuring) can be formally stated and proved as follows:
Corollary 1 IfZ and are su¢ ciently small, then the average seller revenue from a winning SB bid is strictly larger than the average seller revenue from a winning PE bid.
Proof of Corollary 1: Note that !0impliesq !1. As a consequence all themPEs will participate in the initial auction implying the winning bid cannot be below v0+xP E. Hence a SB will win only if its synergies are abovexP E, and it will pay at leastv0+xP E; on average it will pay more thanv0+xP E because of competition from other SBs. However,v0+xP E is the maximum payment the seller can obtain from a PE. Note that winning SB bids can only occur if xP E < xH; since xP E is strictly increasing in Z this condition implicitly puts an upper bound onZ.
To formally state Hypothesis 2 (Restructuring) let us denote by RP E(xP E) and RSB(xP E) the seller expected revenue as a function ofxP E, conditionally on the winner of the initial auction being a PE or a SB, respectively. In the following corollary we consider variations ofxP E over the interval[xL; xH]:
Corollary 2 (a) The probability of a PE winning the initial auction is increasing inxP E. (b) There exists a
thresholdxP E, with0< xP E < xH, such that for all x0P E> xP E, we haveRSB(x0P E)< RP E(x0P E).
Proof of Corollary 2: (a) For a given xP E, the probability of a PE winning the initial auction is
F(1)(x
P E)(1 (1 q )m), that is the probability that the highest of the SB bidders’synergies is less thanxP E times the probability that at least one PE participates in the auction. This expression is increasing in xP E becauseF is increasing andq is increasing inxP E.
(b) Consider …rst RP E(xP E). The PE wins only if the highest value of synergies among SBs is less than
xP E. If the winning PE faces no competition from other PEs, then it will pay the highest of the SBs’valuations, for which the expectation, conditional on PE winning the auction, is v0+E[xe(1) 0 ex(1) < xP E]. If there is at least one other PE bidder, then the winning PE will have to payv0+xP E. It immediately follows that
RP E(xP E)can be expressed as
RP E(xP E) =v0+ (xP E)E[xe(1)j0 xe(1)< xP E] + (1 (xP E))xP E
where (xP E) denotes the probability of no other PE participating to the auction and, to the contrary of
q , is decreasing in xP E. Clearly, RP E(xP E) is continuous, increasing in xP E. Moreover, if xP E = xL then RP E(xH) = v0+ (xL)E[ex(1)jxe(1) xL] + (1 (xL))xL = v0+xL; if xP E = xH then RP E(xH) =
v0+ (xH)E[ex(1)jxe(1) 0] + (1 (xH))xH. Consider nowRSB(xP E). If a SB faces no competition from PEs, then it will pay the highest of the other SBs’valuations, which in expectation equalsv0+E[xe(2)jxe(2) 0]. If a SB wins in the presence of PEs, it will pay the maximum between the highest of the other SBs’valuations and xP E, which in expectation is v0 +E[ex(2)jxe(2) xP E]. Clearly RSB(xP E) is a continuous function of
xP E. Note, however, that when xP E increases, a SB will tend to win only when facing no competition from PEs. Namely for xP E = xH the probability of a SB winning in the presence of a PE is nil. Thus,
RSB(xH) =RSB(xL) =v0+E[ex(2)]< RP E(xH). The result follows from the continuity ofRSB andRP E. Thus, we have shown that RP E(xP E)is continuous and increasing in xP E, andRSB(xP E)continuous in
xP E, and we have established thatRSB(xL)> RP E(xL)and thatRSB(xH)< RP E(xH). This de…nes su¢ cient conditions for the existence of an outcome whre the average seller revenue from a winning PE bid is strictly larger than the average seller revenue from a winning SB bid.