Empirical Evaluation for the Conceptual Interoperability
Analysis Approach: A Controlled Experiment Design
Hadil Abukwaik University of Kaiserslautern Gottlieb-Daimler-Straße 47 67663 Kaiserslautern, Germany [email protected]
Abstract. Building interoperation among separately developed software units requires checking their conceptual assumptions and constraints. However, eliciting such assumptions and constraints is time consuming and is a challenging task as it requires analyzing each of the interoperating software units. To address this issue we proposed a new conceptual interoperability analysis approach which aims at decreasing the analysis cost and the conceptual mismatches between the interoperating software units.In this report we present the design of a planned controlled experiment for evaluating the effectiveness, efficiency, and acceptance of our proposed conceptual interoperability analysis approach. The design includes the study objectives, research questions, statistical hypotheses, and experimental design. It also provides the materials that will be used in the execution phase of the planned experiment.
Keywords: Conceptual interoperability; interoperability analysis; controlled experiment; study design; pilot study protocol
1
Introduction
Building interoperation among separately developed software units requires checking their con-ceptual assumptions and constraints. Failing to detect these concon-ceptual concerns may prevent the interoperation or may produce incorrect results. However, eliciting such assumptions and con-straints is time consuming and challenging as it requires analyzing each of the interoperating soft-ware units. This become harder knowing that the conceptual assumptions and constraints can be either explicitly or implicitly stated in the different software artifacts including architectural arti-facts, APIs, code, etc.
To address this issue we proposed a new COnceptual INteroperability Analysis approach (COINA) which provides systematic steps for the software architects to follow through their in-teroperability analysis between two systems. The approach helps at decreasing the analysis cost and reducing the conceptual mismatches between the interoperating software units that could be missed during the analysis.
based on the interoperation objectives, context, and the software unit domain. Once we have two COIN lists one for each of the interoperating units, we model them formally to allow automating the mapping step. The mapping step compares the related COINs from the two lists and detects their differences according to a predefined list of rules. This approach is tool supported which alleviate the burdens that may be face during the analysis activities.
To evaluate our proposed approach, COINA, we decided to conduct a controlled experiment with a focus on specific properties, namely, effectiveness, efficiency, and acceptance. The participants will be matching-pairs sampled into two groups, then they will be randomly assigned to the experimental treatments. One group will follow our COINA approach, while the other group will perform ad-hoc interoperability analysis. In this report we present a detailed design for the planned experiment that evaluates the effectiveness, efficiency, and acceptance of the COINA approach.
For the rest of this report, our study objectives are stated in details in Section 2. Meanwhile, you can read more details about the designed settings for our experiment in Section 3. Section 4 covers the experimental setup and protocol, while Section 5 shows the protocol of the pilot study that will be used to validate the design of the experiment. Finally, Section 6 presents the threats to validity to the experiment design.
2
Study objective and research questions
The main goal of this study, formulated by means the GQM-goal template [1], is to analyze the COnceptual INteroperability Analysis (COINA) approach for the purpose of evaluation with a
focus on effectiveness, efficiency, and acceptance from the perspective of software architects in the context of a controlled experiment with students. That is, we want to know if the proposed COINA approach (which is proposed as a part of the author’s PhD research) is practically accepted and if it allows performing a more effective and efficient conceptual interoperability analysis com-pared to the ad-hoc interoperability analysis. In line with this goal, we state our research questions as the following:
RQ1 (Effectiveness): Does adopting the systematic, model-based, tool-aided COINA approach enable software architects analyze interoperable software units and detect their conceptual mis-matches more correctly compared to performing an ad-hoc analysis?
RQ2 (Efficiency): Does adopting the systematic, model-based, tool-aided COINA approach, enable software architects analyze interoperable software units and detect their conceptual mis-matches in less cost compared to performing an ad-hoc analysis?
RQ3 (Acceptance): Do practitioners perceive COINA’s as useful and easy to use, when they use it for analyzing interoperable software units and detecting their conceptual mismatches?
To answer these research questions, we plan to perform a controlled experiment where we take into account the experience and background criteria in building matched experimental groups to enable better comparison of their results.
3
Experimental context
The experiment is planned to be conducted in the Software Architecture course of master stu-dents at the Technical University of Kaiserslautern (TU KL). The course will be co-supervised with Dr. Jens Knodel from Fraunhofer IESE in Summer Semester 2015. We expect that 20 master students will participate in the course and will all be included in the experiment.
4
Experimental setup
To explain the setup of the experiment, we start with defining the study variables and formulat-ing our scientific hypotheses. Then, we provide more information about the participant, the exper-imental design, procedures, tasks, and the to-be provided materials.
4.1 Study variables
The main concept behind performing experiments is to examine some variables (dependent var-iables) while manipulating some other variables (independent varvar-iables). For our designed experi-ment, we define these variables as the following:
Dependent variables: the metrics of effectiveness, efficiency and acceptance that are defined in subsection 4.3.
Independent variables: the applied conceptual interoperability analysis approach (COINA or ad-hoc along with their associated materials).
4.2 Statistical hypotheses
In this experiment we intend to answer the previously stated research questions in Section 3, namely RQ1, RQ2, and RQ3.
In order to do this, we derive the statistic null hypotheses and the corresponding alternative hy-potheses from the stated research questions. Note that, H1 relates to RQ1, H2 relates to RQ2, while both H3 and H4 relate to RQ3. The arithmetic medianof effectiveness, efficiency, and acceptance (represented by both perceived ease of use and perceived usefulness) of the COINA approach is denoted by μA. Meanwhile, μB denotes effectiveness and efficiency of the ad-hoc analysis ap-proach. H1, 0: μA ≤ μB H1, 1: μA > μB H2, 0: μA ≤ μB H2, 1: μA > μB H3, 0: μA ≤ 3 H3, 1: μA > 3 H4, 0: μA ≤ 3 H4, 1: μA > 3
The value 3 in H3 and H4 is compared to a defined scale of values from 1 to 5 (more details in subsection 4.3). These hypotheses will be tested in this controlled experiment at a confidence level of α = 0.05.
4.3 Operationalization (Evaluation metrics)
As stated previously, the comparison in H1 and H2 is against an ad-hoc conceptual interoperabil-ity analysis without tool or model-based support. In order to perform the comparison, we need to have specific metrics that can be calculated from the produced results by the participants in the experiment.
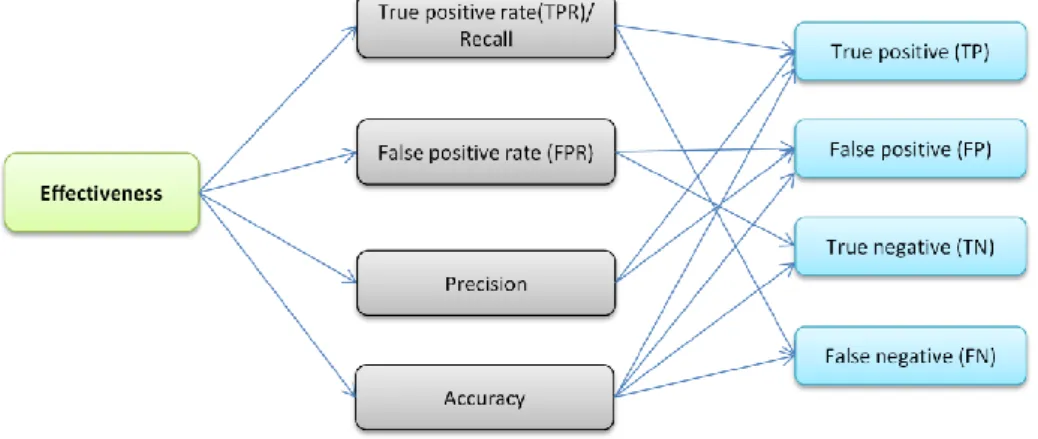
In order to evaluate the effectiveness in H1, we use the described metrics in Fig. 1.
Fig. 1. Effectiveness evaluation metrics
Table 1 presents a brief description of the effectiveness metrics. This table also describes for-mulas on how the basic metrics are used in calculating the derived metrics.
Table 1. Effectiveness evaluation metrics and formulas Metric
Type
Metric name Brief description Formula
Basic metrics
True positive (TP) A COIN/mismatch instance which is correctly identified as a COIN/mismatch instance
NA
False positive (FP) A non-COIN/non-mismatch which is incorrectly identified as a COIN/mismatch instance NA True negative (TN) A non-COIN/non-mismatch which is correctly unidentified as a COIN/mismatch instance NA False negative (FN)
A COIN/mismatch instance which is incorrectly unidentified as a
COIN/mismatch instance Derived
metrics
True positive rate (TPR) or Recall
The ratio of correctly identified COIN/mismatch instances to all COIN/mismatch instances
𝑇𝑃 𝑇𝑃 + 𝐹𝑁 False positive rate
(FPR)
The ratio of incorrectly identified COIN/mismatch instances to all non-COIN/non-mismatch instances
𝐹𝑃 𝐹𝑃 + 𝑇𝑁 Precision The ratio of correctly identified
COIN/mismatch instances to all cor-rectly and incorcor-rectly identified in-stances
𝑇𝑃 𝑇𝑃 + 𝐹𝑃 Accuracy The ratio of correctly identified and
correctly unidentified COIN/mismatch instances to all COIN/mismatch and non-COIN/non-mismatch instances
𝑇𝑃 + 𝑇𝑁 𝑇𝑃 + 𝑇𝑁 + 𝐹𝑃 + 𝐹𝑁
F-measure The harmonic mean of precision and recall, i.e., a value combining them
2 𝑇𝑃 2 𝑇𝑃 + 𝐹𝑃 + 𝐹𝑁 On the other hand, to evaluate the cost in H2, we use the time metric with minutes as the meas-urement unit.
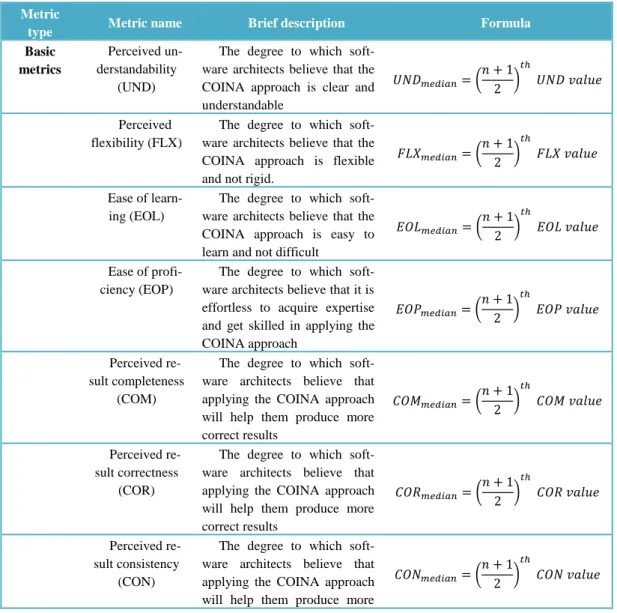
Regarding evaluating the acceptance, in terms of the perceived ease of use and the perceived usefulness, in H3 and H4, we use the metrics shown in Fig. 2. The defined metrics are based on the TAM metrics proposed in [2].
Table 2 presents a brief description of the acceptance metrics. This table also describes formu-las on how the basic metrics are used in calculating the derived metrics. In the table, n is the total number of questionnaire participants.
In fact, all the basic metrics of the acceptance are measured through a debriefing questionnaire at the end of the experiment (more details in subsection4.5). The questionnaire includes a 5-level Likert scale [3] questions for each basic metric. The five levels are: strongly disagree, disagree, neither, agree, and strongly disagree. To quantify the Likert scale data and consequently test H3, the scale levels are weighted as: 1, 2, 3, 4, and 5 accordingly. More details about analyzing the Likers scale data are provided in subsection 4.9.
Table 2. Acceptance evaluation metrics
Metric
type Metric name Brief description Formula
Basic metrics
Perceived un-derstandability
(UND)
The degree to which soft-ware architects believe that the COINA approach is clear and understandable 𝑈𝑁𝐷𝑚𝑒𝑑𝑖𝑎𝑛= ( 𝑛 + 1 2 ) 𝑡ℎ 𝑈𝑁𝐷 𝑣𝑎𝑙𝑢𝑒 Perceived flexibility (FLX)
The degree to which soft-ware architects believe that the COINA approach is flexible and not rigid.
𝐹𝐿𝑋𝑚𝑒𝑑𝑖𝑎𝑛= ( 𝑛 + 1 2 ) 𝑡ℎ 𝐹𝐿𝑋 𝑣𝑎𝑙𝑢𝑒 Ease of learn-ing (EOL)
The degree to which soft-ware architects believe that the COINA approach is easy to learn and not difficult
𝐸𝑂𝐿𝑚𝑒𝑑𝑖𝑎𝑛= ( 𝑛 + 1 2 ) 𝑡ℎ 𝐸𝑂𝐿 𝑣𝑎𝑙𝑢𝑒 Ease of profi-ciency (EOP)
The degree to which soft-ware architects believe that it is effortless to acquire expertise and get skilled in applying the COINA approach 𝐸𝑂𝑃𝑚𝑒𝑑𝑖𝑎𝑛= (𝑛 + 12 ) 𝑡ℎ 𝐸𝑂𝑃 𝑣𝑎𝑙𝑢𝑒 Perceived re-sult completeness (COM)
The degree to which soft-ware architects believe that applying the COINA approach will help them produce more correct results 𝐶𝑂𝑀𝑚𝑒𝑑𝑖𝑎𝑛= (𝑛 + 12 ) 𝑡ℎ 𝐶𝑂𝑀 𝑣𝑎𝑙𝑢𝑒 Perceived re-sult correctness (COR)
The degree to which soft-ware architects believe that applying the COINA approach will help them produce more correct results 𝐶𝑂𝑅𝑚𝑒𝑑𝑖𝑎𝑛= ( 𝑛 + 1 2 ) 𝑡ℎ 𝐶𝑂𝑅 𝑣𝑎𝑙𝑢𝑒 Perceived re-sult consistency (CON)
The degree to which soft-ware architects believe that applying the COINA approach will help them produce more
𝐶𝑂𝑁𝑚𝑒𝑑𝑖𝑎𝑛= (
𝑛 + 1 2 )
𝑡ℎ
consistent and comparable results
Perceived task performance
(PER)
The degree to which soft-ware architects believe that applying the COINA approach will help them perform the interoperability analysis tasks with less time
𝑃𝐸𝑅𝑚𝑒𝑑𝑖𝑎𝑛= ( 𝑛 + 1 2 ) 𝑡ℎ 𝑃𝐸𝑅 𝑣𝑎𝑙𝑢𝑒 Perceived task effort (EFF)
The degree to which soft-ware architects believe that applying the COINA approach will help them perform the interoperability analysis tasks with less effort
𝐸𝐹𝐹𝑚𝑒𝑑𝑖𝑎𝑛= ( 𝑛 + 1 2 ) 𝑡ℎ 𝐸𝐹𝐹 𝑣𝑎𝑙𝑢𝑒 Derived metrics Perceived ef-fectiveness (PEV)
The degree to which soft-ware architects believe that applying the COINA approach will help them produce analysis results with better quality
𝑃𝐸𝑉𝑚𝑒𝑑𝑖𝑎𝑛= (𝑛 + 12 ) 𝑡ℎ 𝑣𝑎𝑙𝑢𝑒 𝑜𝑓 (𝐶𝑂𝑀, 𝐶𝑂𝑅, 𝐶𝑂𝑁) Perceived effi-ciency (PEC)
The degree to which soft-ware architects believe that applying the COINA approach will help them reduce the cost of interoperability analysis 𝑃𝐸𝐶𝑚𝑒𝑑𝑖𝑎𝑛 = (𝑛 + 1 2 ) 𝑡ℎ 𝑣𝑎𝑙𝑢𝑒 𝑜𝑓 (𝑃𝐸𝑅, 𝐸𝐹𝐹) =𝑃𝐸𝑅 + 𝐸𝐹𝐹 2 Perceived use-fulness (PUS)
The degree to which soft-ware architects believe that applying the COINA approach will help them perform better analysis COIN/mismatch anal-ysis 𝑃𝑈𝑆𝑚𝑒𝑑𝑖𝑎𝑛 = (𝑛 + 1 2 ) 𝑡ℎ 𝑣𝑎𝑙𝑢𝑒 𝑜𝑓 (𝑃𝐸𝑉, 𝑃𝐸𝐶) =𝑃𝐸𝑉 + 𝑃𝐸𝐶 2 Perceived ease of use (PEU)
The degree to which soft-ware architects believe that applying the COINA approach would be free of effort
𝑃𝐸𝑈𝑚𝑒𝑑𝑖𝑎𝑛= ( 𝑛 + 1 2 ) 𝑡ℎ 𝑣𝑎𝑙𝑢𝑒 𝑜𝑓 (𝑈𝑁𝐷, 𝐹𝐿𝑋, 𝐸𝑂𝐿, 𝐸𝑂𝑃)
Acceptance The degree to which soft-ware architects agree to apply the COINA approach in their conceptual interoperability analysis tasks
Acceptance = {PUS, PEU}
4.4 Participants (Subjects)
The planned participants are participating master students in the Software Architecture course of Summer Semester 2015 at Technical University of Kaiserslautern (TU KL). Participation will be voluntary without compensation.
In order to monitor the influence of the participants on the experimental results, more infor-mation will be gathered about the participants by asking them to fill a briefing questionnaire before conducting the experiment. The questionnaire will include questions regarding the participant: study major, semester count, age, familiarity with UML, experience in project development, back-ground in software architecture, etc.
4.5 Experimental procedures
This subsection describes the time constraints and the planned procedures of our designed con-trolled experiment.
Time constraint. The planned time to be allocated to the experiment is 90 minutes in two sepa-rated labs of the Computer Science (Informatik) department.
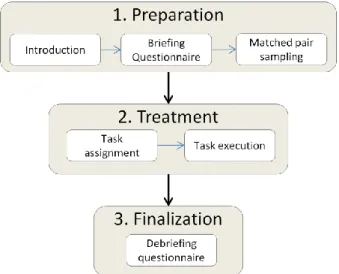
An abstract overview of the experimental procedures followed in this experiment is depicted in Fig. 3 bellow.
Fig. 3. Experimental procedures overview
Preparation. This procedure includes the following three sequential activities:
Introduction: In the beginning of the experiment, the supervisor will explain the settings of the experiment. All participants will get together an introduction to the concepts of in-teroperability, the COIN, and the conceptual mismatches with examples. Also, the partic-ipants will get a clear statement on the role of the experiment in the course and on their role in the experiment.
Briefing questionnaire: The previously mentioned questionnaire regarding the partici-pants’ background and experience will be filled at this stage of the experiment.
Matched-pairs design [4]: As we have two treatments only and we want to eliminate the confounding factors and improve the comparison, the participants will be pair-matched according to blocking variables (i.e., gender, experience, and knowledge) that are collect-ed by the briefing questionnaire in the previous activity. Then, within each pair, partici-pants are randomly assigned to the two treatments.
Execution. This procedure of the experiment includes:
Task assignment: The participants in each group will receive materials explaining their assigned task and procedures in details (Task materials for group A differ from task mate-rials of group B).
Treatments: The participants of group A will work on the assigned tasks following the ad-hoc analysis approach. Meanwhile, the participants of group B will work on the same tasks but following our COINA approach for analysis. Both groups will produce the ex-pected COIN lists and the mismatches list of SX and SY. More details about the treatments are provided in subsection 4.6.
Along the execution, the experimenter will be recording observations for plausible disturbing factors like participants’ emotions and events. The data collection instrument used is a prede-fined observation template (See Appendix B). These observations will be used to analyze con-founding variables and for explaining thorough values, e.g., outliers and missing values. Finalization. A debriefing questionnaire will be filled by the participant to get their feedback on the faced difficulties in the assigned tasks and to capture their experience in applying the two interoperability analysis approaches.
To have a look on the input materials used along the experiment procedures, see Appendix A.
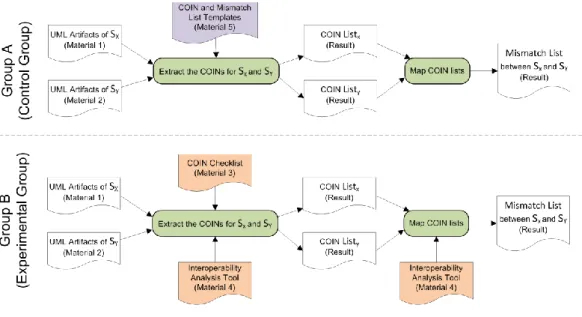
4.6 Experimental design
A detailed overview for experimental design is illustrated in Fig. 4. As mentioned earlier, we have only two treatments (conceptual interoperability analysis approaches). The first is the ad-hoc approach and the second is our proposed COINA approach.
Group A (Control group) applies ad-hoc approach to perform the conceptual interoperability analysis tasks on UML artifacts of two software units. The approach does not provide any system-atic checklists for the COINs or any aiding tools for automating the extraction of the COINs/mismatches. Only templates for the required format to be used in documenting the results are provided to the participants.
Group B (Experimental/ Treatment Group) performs the same conceptual interoperability analysis tasks on the same UML artifacts of the same software units, but by applying the COINA approach. The COINA approach provides both a systematic checklist for the COINs and the In-teroperability Analysis Tool for partial-automatic extraction of the COINs/mismatches.
The idea of extracting interoperability concerns from UML artifacts is not known to the partici-pant before. Performing the tasks with the COIN Checklist and the Interoperability Analysis tool is expected to have learning effects. Hence, we decided not to perform a cross-designed experiment. More details about the assigned tasks are described in the subsection 4.7.
4.7 Experimental tasks
During the experiment, the participant will play the role of software architects and will have to perform architecture analysis tasks. The architecture analysis process will not be explained as it is assumed that the participants will learn about this concept through the software architecture class. The following describes the assigned tasks to the participants:
Both groups will get the same UML artifacts for two software units (SX and SY) that need to interoperate with each other.
The first task given to both groups will be to analyze the UML artifacts of SX and SY and to derive a list of COINs for each of them. To make the task simple, the participant will be asked to analyze each software unit separately from the other unit.
The second task given to both groups too is to compare the two COIN lists and to create a list of potential mismatches that may hinder the interoperation between SX and SY.
The participants are expected to produce two types of results as presented in Fig. 4. The first will be a COIN List for each analyzed software unit. The second will be a Mismatch List between the two software units.
To ensure format consistency and comparability, group A is provided with COIN and Mismatch List Templates along with simple explaining examples. In this way we will get the same result artifacts from the two groups, but by following two different approaches and input.
The task input and description materials that will be distributed on the participants can be found in Appendix A.
4.8 Materials
All essential information for conducting the experiment will be given to the participant in the form of experiment preparation and execution materials. More specifically, the following materials will be handed to the participants in the experiment to conduct the required tasks:
UML Artifacts for SX and SY (Material 1 and Material 2). This is the input which will be an-alyzed by the participants of group A and group B to find out the COINs and the potential mis-matches. The UML artifacts are envisioned by the designer of the experiment based on two indus-trial components in the Smart Farming project [5] of the Fraunhofer IESE, namely the Farm Man-agement software unit (Sx) and the Tractor software unit (Sy). For each software unit, only two UML diagrams will be handed to the participants to simplify the task.
COIN Checklist (Material 3). This is a structured checklist provided to the participants of Group B only. It is a simple presentation for the possible COINs they need to detect in the experi-ment. Note that this checklist is derived from the COIN Classification Model that has been devel-oped as a part of the author’s PhD research.
Interoperability Analysis Tool (Material 4). The participants of group B will be provided with a tool which takes the UML artifacts for each software unit and automatically produces a list of their COIN candidates. The tool also automatically produces a list of mismatch candidates be-tween the two software units. The participant decides whether to approve the suggested COINs and mismatches or to reject them.
COIN and Mismatch List Templates (Material 5). These templates guide Group A in docu-menting their results in a structured format similar to the results that will be produced by Group B via the tool. This consistency in the results’ format will be a benefit when performing the results’ analysis.
Along with these experiment materials, there will be the explanation of the experiment proce-dures, the questionnaires, and the task description. All the experimental materials can be found in Appendix A.
4.9 Data analysis and interpretation
The produced data within this controlled-experiment will be analyzed to describe the sample, answer the research questions, and to test the stated hypotheses.
We will explore and describe the data using descriptive statistics (1. central tendency: mean, median, or mode, 2. variability: max/ min, range, or standard deviation).
We will check the data validity by looking for its consistency and credibility through identifying
unusual data values (e.g., outliers, missing and inconsistent values).
We will test the hypotheses using a statistical test on the collected data based on the type of com-parison distribution.
If we have a normal distribution we will use a parametrictest, e.g., t-test or independent test.
However, if we have non-normal distribution (i.e., ordinal/nominal), we will use non-parametric test, e.g., Mann. Whitney U test or Wilcoxon matched pairs test.
As mentioned earlier, our significance level (α-value) is 0.05, therefore:
If the statistical analysis shows that the significance level is below the cut-off value (<= 0.05), we will “reject” the null hypotheses.
If the statistical analysis shows that the significance level is below the cut-off value (>0.05), we will we will “fail to reject” the null hypotheses.
Finally, we will do a result interpretation where we explain the findings from the presented analysis. For example, if the null hypotheses are rejected, then the COINA approach does have a positive effect on the conceptual interoperability analysis effectiveness. Or if we fail to reject the null hypotheses, then we conclude that there is no sufficient evidence on COINA’s effectiveness and we may need to formulate new hypotheses.
Note that, the collected Likert scale data from the questionnaires is considered as ordinal data because of the discrete nature of the 5 designed alternative responses. Therefore, to properly ana-lyze the Likert data collected through the questionnaires, the descriptive statistics that will be used are:
Central tendency measured as median/mode.
Variability measured as frequency: percentages on bar chart, min/max, and range.
Meanwhile, the inferential statistics that will be applied on the Likert data is the non-parametric One-Sample Wilcoxon Signed Rank Test.
5
Experiment pre-evaluation - Pilot study
In this section we present a design for a pilot study that we will conduct as a small-scale re-hearsal for the planned controlled experiment with the students of the Software Architecture course of Summer Semester 2015. In this section, we present the pilot study protocol.
5.1 Pilot study protocol
Study objective is to validate the design of the planned controlled experiment for the purpose
of revising it with a focus on materials’ clarity, and tasks’ feasibility from the perspective of re-searchers in the context of a pilot study. That is, we want to know if the designed materials and tasks are realistic and meaningful before investing large amounts of time and resources.
Research questions were derived from the previously stated objective as the following:
RQ1: Are the handed materials to the experiment’s participants clear and understandable?
RQ2: Are the assigned tasks perceived correctly and achieved successfully?
RQ3: Is the allocated time for the planned controlled experiment sufficient to perform all its procedures?
Participants (Subjects) are four volunteering researchers where two perform the designed ex-perimental tasks following the assigned ad-hoc approach to Group A and the other two perform the same tasks using the assigned COINA approach to Group B.
The inclusion criterion for the pilot study participantsis to have a similar level of experi-ence and skills to the expected participants of the planned controlled experiment.
The exclusion criterion for the pilot study participants is that they are not participating in the Software Architecture course of Summer Semester 2015.
Execution includes the following procedures that will be performed sequentially:
The experimenter, who is the author and the designer of the experiment, gives the partici-pant the introduction which will be also given to the participartici-pants of the planned controlled experiment.
The researchers fill the briefing questionnaire.
Two researchers will be handed the designed materials for Group A and will be asked to perform them accordingly.
The other two researchers will be handed the designed materials for Group B and will be asked to perform them accordingly.
The researchers fill the debriefing questionnaire.
Note that the execution is allocated the same planned time for the actual controlled experiment which is 90 minutes.
Data collection in the pilot study is concerned about observing the participants. Therefore, con-currently with executing the procedures, the experimenter will be observing the participants and taking notes. The data collection instrument used is an observation template (See Appendix C). This observation template is designed to record information regarding the participants’ interaction with the handed materials, their asked questions, the time they spent on each procedure, and any given feedback.
Data analysis will be based on the collected data via the observation template. These observa-tions will be analyzed and examined in detail in order to answer the research quesobserva-tions of the pilot study.
5.2 Results and conclusions
Results will be presented as answers to the research questions stated in Subsection 5.1.
RQ1: Are the handed materials to the experiment’s participants clear and understandable?
Number of times participants asked for an explanation about presented information in the handed materials.
Answers provided in the debriefing questionnaire for question “How well did you under-stand the task? “
Answers provided in the debriefing questionnaire for question “Do you have further comments about the experiment or the used approach? “ and are related to the under-standing or clarity aspects of the experiment.
RQ2: Are the assigned tasks perceived correctly and achieved successfully?
Number of times participants asked for an explanation about a procedure or requested ex-amples for it.
Answers provided in the debriefing questionnaire for question “How difficult did you perceive the task? “
Answers provided in the debriefing questionnaire for question “Do you have further comments about the experiment or the used approach? “ and are related to the difficulty of the assigned tasks.
The correctness of the results they produced through executing the tasks.
RQ3: Is the allocated time for the planned controlled experiment sufficient to perform all its procedures?
Measuring the time spent in each task and comparing it to the allocated time in the exper-iment design.
Conclusions will be drawn from analyzing the pilot study results about the design of the con-trolled experiment.
6
Threats to validity
Construction validity is the degree to which the experiment measures the stated goals and claimed hypotheses.
The designed tasks of the experiment are totally focused on finding the conceptual con-cerns, without considering technical and syntactical concerns of interoperability. As the participants of group A will not be provided with the COIN checklist, they may confuse the conceptual concerns with technical and syntactical ones. To mitigate this effect we provided simple examples in the Introduction that will be given to the participants to clear out this issue.
The input UML artifacts are designed to include certain COINs instead of covering all types introduced in the COIN model. However, these certain COINs are representative of practice and adapted from concerns found in the industrial project “Smart Farming “.
The researcher bias which is introduced by the experimenter (who is also the inventor of the under experiment COINA approach) can influence the design of the experiment un-consciously to prove his claimed hypotheses. In order to alleviate this effect, the experi-ment design has been reviewed by three researchers.
Internal validity is the degree to which independent variables influence the dependent varia-bles of the experiment.
Dividing the participants into the group A and B may affect the observed outcome, selec-tion bias. Such a bias can have a larger effect in studies with small number of participants like our experiment compared to studies with large number of participants. In order to minimize this effect, we will use the gathered information in the briefing questionnaire to divide the participants into the two groups based on their experience and knowledge (pair sampling).
We opt not to have a cross-design experiment to avoid the learning bias which is the in-fluence of maturing skills during the experiment. The learning effect is expected to be strong if the participants perform the tasks with using the COIN Checklist and the In-teroperability Tool and then perform the same task without them.
It is expected that participants will not spend the same time on the assigned tasks. To be able to track this issue and its influence on the experiment results we request a time stamp to be filled by the participants at the beginning and ending of the experimental task execu-tion.
External validity is the degree to which the results of the experiment can be generalized to dif-ferent people and settings.
The size of the input, the UML artifacts for the two software units, is quite small com-pared to typical software units in the industry.
The expected participants in the experiment are students in a master program and not ex-perienced software engineers. More specifically, they are not software architect with prac-tical experience in interoperation or in analyzing software architectures.
The task of detecting only the conceptual concerns is not representative for the complete interoperability analysis. That is, in practice, all interoperability concerns including tech-nical and syntactical concerns are of the architect interest to be detected. However, the designed artifacts and tasks are realistic and envisioned from an industrial project (Smart Farming at Fraunhofer IESE).
Conclusion validity is the degree to which the drawn conclusions from the experiment results are correct and proved with sufficient statistical tests.
The used metrics in assessing the effectiveness of the interoperability analysis approach-es are based on the COIN Model which the author’s proposed COINA approach is built on. This threat to validity holds especially true for the notion of “correct COIN” and “in-correct COIN”. Hence, the experiment definition for “in-correctness should be taken into ac-count when interpreting the results.
The reliability of the time measure used in assessing the efficiency of the interoperability analysis approaches can also be a threat to validity. This is because the planned instru-ment to be used in recording the time stamps is pen and paper via the participants them-selves, even though they will be allocated a specific time for the whole experiment.
Based on the results (that will be produced by group A and group B) and its distribution, we will select the appropriate statistical test. For example, t-test if results are normally distributed and Mann-Whitney-U if results are not normally distributed.
Summary
In this report we have presented the protocol of a planned controlled experiment that aims at empirically evaluating the effectiveness, efficiency, and acceptance of our proposed Conceptual Interoperability Analysis approach, COINA. Our experimental design uses the matched pairs sam-pling then randomly assign the participants of each pair into the two groups. Additionally, the report includes the design of a pilot study that will be conducted to validate and revise the materi-als of the controlled experiment before spending time and resources in its execution. We have materi-also included the threats to validity of our designed controlled experiment. Our next step is to perform the pilot study, revise the experiment material based on its results, conduct the controlled experi-ment and report its results and conclusions.
Appendices
Appendix A - Experimental materials
This appendix includes the experimental materials that will be given to the experiment partici-pants during the experiment. Note that the presented materials in this section are the entire materi-als of the experiment, but they will be handed to the participants in group A and group B according to the previously explained experiment design in Section 4.
The differences in the handed materials for group A and group B are the following:
Different task descriptions (page 21 and page 22)
Different debriefing questionnaire (page 23 and page 24-25)
Material 5 will be handed to group A only
Non-Disclosure Agreement & Informed Consent
Last name (Student): _____________________ First name: _____________________________ Enrollment number: ______________________
The student is taking part in the “Software Architecture” course of AGSE with collaboration with Fraunhofer IESE Institute for Experimental Software Engineering during the Winter Semester 2015/2016.
To ensure the success of the experiment the student will keep confidential all information gained during the experiment and shall disclose any information about aim, procedure, and materials especially to other students joining the course.
The student also accepts that the experiment is recorded for the purpose of anonymous analysis. All gathered data will be kept in confidence. The performance or the results of the experiment will not influence the grading of the student in the “Software Architecture” course.
Kaiserslautern, _________________ (Date)
_____________________________ (Student signature)
ID: ______________ Architecture Experiment – Procedures
First of all, thank you for participating in the architecture experiment!
Please read this document carefully and contact your experimenter in case you have fundamental problems in understanding the given information or tasks. Typically, the preparation takes about 20 minutes.
Please remember, don’t talk about the experiment to other participants of the course before all conducted the experiment!
Please try to perform the tasks as fast as possible, but aim at achieving results of high quality. The maximum allocated time for executing the experiment is 90 minutes.
Preparation
Note preparation start time here (e.g., 10:00): __________________
Read the Introduction (page 2)
Fill in the Briefing Questionnaire (page 3)
Note preparation stop time here (e.g., 10:20): ___________________ Execution
Read the task description and conduct the task Finalization
Note finalization start time (e.g., 11:30): ________________________
Fill in the Debriefing Questionnaire (page 5)
ID: ______________
Introduction to the Architecture Experiment Purpose
This experiment investigates how detecting conceptual interoperability concerns and mismatches is impacted by the followed approach for interoperability analysis.
Background
Let’s start with a definition for interoperability as understanding it is crucial for the experiment.
Definition of software interoperability: it is the ability of two or more software units (that have been developed separate-ly) to communicate seamlessly, exchange information and services, and use these exchanged information and services in a meaningful way.
This means, two software units are interoperable if they can start exchanging information or service with relatively low effort and cost. To determine the possibility to have interoperability between two units, it is important to detect their conceptual properties that can be a source of mismatch between them.
Conceptual interoperability concern (COIN): It is a conceptual property of the software unit that relates to its semantics, structure, dynamics, context, or quality. That is, COIN is not about technical or syntactical properties of the software unit. For example, “a software unit (S1) provides location in maximum 5 seconds” is a COIN about the quality of S1.
Conceptual mismatch: It is heterogeneity between two software units caused by a difference on their corresponding COINs. This mismatch prevents the desired interoperation completely or can produce wrong meaningless results. For example, “a software unit (S2) needs to get a user location within 2-4 seconds” is a COIN which causes a mismatch with (S1). This mismatch is related to the heterogeneity in the quality properties of S1 and S2.
Context in the software architecture course
The experiment takes place in the context of the Software Architecture course at TU Kaiserslautern for Summer Semester 2015.
Your role in the experiment
In the experiment, you act as a software architect. Your task will be to find the COINs for two software units from their UML artifacts that you will be given. Then you will find the mismatches between the two software units based on the COINs you found. The tasks are intentionally designed easy so that everyone should be able to conduct them.
ID: ______________ Briefing Questionnaire
Remark
The following questions help us in analyzing the results in a more detailed manner. Your answers will be treated anonymously. The ID you provide will not be used to connect your questionnaire to your results. Please answer the questions as complete and honest as possible. Thank you for your collaboration! Background information
Age ________________
Gender ⃝ Male ⃝ Female
What is you major subject of study (e.g., computer science)? ___________________________ What is your current study level?
⃝ bachelor ⃝ master ⃝ diploma ⃝ PhD
In which semester of your studies are you at the moment? _____________________________
Have you participated in software development projects before? ⃝ Yes ⃝ No
If yes, for how many years have you been working in the software industry (also as student)? ⃝ 1-2 ⃝ 3-4 ⃝ 4-6 ⃝ 6-8 ⃝ more than 8
If yes, how many software projects have you participated in? ⃝ 1-2 ⃝ 3-4 ⃝ 4-6 ⃝ 6-8 ⃝ more than 8
If yes, what roles have you had in the project(s) (e.g., architect, tester, etc.)? ___________________________________________________________ ___________________________________________________________
Do you have experience in software architecture? ⃝ Yes ⃝ No
If yes, for how many years have you participated in software architecture related tasks? ⃝ 1-2 ⃝ 3-4 ⃝ 4-6 ⃝ 6-8 ⃝ more than 8
If yes, how many projects have you participated in their software architecture related tasks? ⃝ 1-2 ⃝ 3-4 ⃝ 4-6 ⃝ 6-8 ⃝ more than 8
How do you rate your experience about dealing with UML artifacts?
Built Analyzed
(reviewed)
Learned (at school)
Read
(individ-ually) I don’t know it Component
diagram ⃝ ⃝ ⃝ ⃝ ⃝
Class diagram ⃝ ⃝ ⃝ ⃝ ⃝
Use case
dia-gram ⃝ ⃝ ⃝ ⃝ ⃝ Sequence diagram ⃝ ⃝ ⃝ ⃝ ⃝ Interaction overview dia-gram ⃝ ⃝ ⃝ ⃝ ⃝ Control flow diagram ⃝ ⃝ ⃝ ⃝ ⃝
Is the Software architecture course the only source of your software architecture knowledge? ⃝ Yes ⃝ No
If no, where did you earn your further knowledge on software architecture? (e.g., projects, books, bachelor thesis work, master thesis work, etc.)
___________________________________________________________ ___________________________________________________________ Do you have any experience regarding interoperability or software integration? ⃝ Yes ⃝ No
If yes, where did you earn this experience from? (e.g., projects, books, articles, etc.) ___________________________________________________________
___________________________________________________________ How do you rate you English proficiency in understanding text and speaking?
⃝ 1(Weak) ⃝ 2(Good) ⃝ 3 (Very good) ⃝ 4 (Fluent) ⃝ 5 (Mother language) 5– Hadil Abukwaik
ID: ______________ Task Description
Task summary
Your task is to play the role of a software architect and to find the COINs for two software units from their UML artifacts. Then you will find the mismatches between the two software units based on the COINs you found.
Input
You have the following materials as input for your work:
UML artifacts for Sx (Material 1) and UML artifact for Sy (Material 2): You will analyze these artifacts for the two software units that need to interoperate
COIN and Mismatch List Templates (Material 5): You will follow these templates in docu-menting the list of COINs for each software unit and for docudocu-menting the list of found mis-matches between them. The templates are supported with simple examples
Activities
Please conduct the following activities:
1. Read carefully and understand the input materials
2. Analyze Sx and Sy to find their conceptual interoperability concerns, COINs
3. Document the found COINs for Sx and Sy in two lists “COIN Listx” and “COIN Listy” Please keep in mind the COIN List Template in Material 5
4. Compare each COIN in Listx with the corresponding COIN in Listy
5. Document the found mismatches between the corresponding COINs in the “Mismatch List”
Please keep in mind the Mismatch List Template in Material 5
ID: ______________ Task Description
Task summary
Your task is to play the role of a software architect and to find the COINs for two software units from their UML artifacts. Then you will find the mismatches between the two software units based on the COINs you found.
Input
You have the following materials as input for your work:
UML artifacts for Sx (Material 1) and UML artifact for Sy (Material 2): You will analyze
these artifacts for the two software units that need to interoperate
COIN Checklist (Material 3): This is a structured checklist for the possible COIN types. You will use this checklist to ensure producing a complete list of COINs for each software unit.
Interoperability Analysis Tool (Material 4): A tool which takes the UML artifacts for each software unit and automatically produces a list of COIN candidates. The tool also auto-matically produces a list of mismatch candidates between the two software units. The participant decides whether to approve the suggested COINs and mismatches or to re-ject them
Activities
Please conduct the following activities:
1. Read carefully and understand the input materials
2. Use the tool to open the UML artifacts of Sx and run the “Find COINs” functionality
3. Review the suggested list of COINs produced by the tool and use the (Approve COIN, De-cline COIN, Add COIN, and Edit COIN) as needed
Please keep in mind the COIN Checklist in Material 3 4. Save the final COIN list
5. Repeat 2, 3, and 4 for the UML artifacts of Sy
6. Use the “Find Mismatches” functionality of the tool and select the two saved COIN lists created for Sx and Sy
7. Review the suggested list of mismatches produced by the tool and use the (Approve mismatch, Decline mismatch, and Edit mismatch) as needed
8. Save the final Mismatch list
ID: ______________ Debriefing Questionnaire
Remark
The information you provide is important for evaluating the applicability and usefulness of the conceptual interoperability analysis approach. Your answers will be treated anonymously. The ID you provide will not be used to connect your questionnaire to your results.
Please answer the questions as complete and honest as possible. Thank you for your collaboration! 1. How well did you understand the task?
⃝ 1(Very bad) ⃝ 2(Bad) ⃝ 3 (Moderate) ⃝ 4 (Good) ⃝ 5 (Very good) 2. How difficult was it to perceive the task?
⃝ 1(Very easy) ⃝ 2(Easy) ⃝ 3 (Moderate) ⃝ 4 (Difficult) ⃝ 5 (Very difficult) 3. How difficult was it to perform the task?
⃝ 1(Very easy) ⃝ 2(Easy) ⃝ 3 (Moderate) ⃝ 4 (Difficult) ⃝ 5 (Very difficult) 4. How interesting was it to perform the task?
⃝ 1(Very boring) ⃝ 2(Boring) ⃝ 3 (Neutral) ⃝ 4 (Interesting) ⃝ 5 (Very interesting) 5. How do you estimate the quality of your results (produced lists)?
⃝ 1(Very low) ⃝ 2(Low) ⃝ 3 (Moderate) ⃝ 4 (High) ⃝ 5 (Very high)
6. Having a checklist for possible COINs and their types during the interoperability analysis would make the tasks easier
⃝ 1(Strongly disagree) ⃝ 2(Disagree) ⃝ 3 (Neither) ⃝ 4 (Agree) ⃝ 5 (Strongly agree) 7. Having a checklist for possible COINs and their types during the interoperability analysis would help me produce a more complete list of COINs
⃝ 1(Strongly disagree) ⃝ 2(Disagree) ⃝ 3 (Neither) ⃝ 4 (Agree) ⃝ 5 (Strongly agree) 8. Having a checklist for possible COINs and their types during the interoperability analysis would help me produce a more correct list of relevant COINs
⃝ 1(Strongly disagree) ⃝ 2(Disagree) ⃝ 3 (Neither) ⃝ 4 (Agree) ⃝ 5 (Strongly agree) 9. Having a checklist for possible COINs and their types during the interoperability analysis would help me produce more consistent/comparable lists and consequently detect more mismatches
⃝ 1(Strongly disagree) ⃝ 2(Disagree) ⃝ 3 (Neither) ⃝ 4 (Agree) ⃝ 5 (Strongly agree) 10. Having a checklist for possible COINs and their types during the interoperability analysis would helped me save time in producing the results
⃝ 1(Strongly disagree) ⃝ 2(Disagree) ⃝ 3 (Neither) ⃝ 4 (Agree) ⃝ 5 (Strongly agree) 11. Do you have further comments about the experiment or the used approach?
___________________________________________________________ ___________________________________________________________
ID: ______________ Debriefing Questionnaire
Remark
The information you provide is important for evaluating the applicability and usefulness of the conceptual interoperability analysis approach. Your answers will be treated anonymously. The ID you provide will not be used to connect your questionnaire to your results.
Please answer the questions as complete and honest as possible. Thank you for your collaboration! 1. How well did you understand the task?
⃝ 1(Very bad) ⃝ 2(Bad) ⃝ 3 (Moderate) ⃝ 4 (Good) ⃝ 5 (Very good) 2. How difficult was it to perceive the task?
⃝ 1(Very easy) ⃝ 2(Easy) ⃝ 3 (Moderate) ⃝ 4 (Difficult) ⃝ 5 (Very difficult) 3. How difficult was it to perform the task?
⃝ 1(Very easy) ⃝ 2(Easy) ⃝ 3 (Moderate) ⃝ 4 (Difficult) ⃝ 5 (Very difficult) 4. How interesting was it to perform the task?
⃝ 1(Very boring) ⃝ 2(Boring) ⃝ 3 (Neutral) ⃝ 4 (Interesting) ⃝ 5 (Very interesting) 5. How do you estimate the quality of your results (produced lists)?
⃝ 1(Very low) ⃝ 2(Low) ⃝ 3 (Moderate) ⃝ 4 (High) ⃝ 5 (Very high)
6a. It was clear and understandable how to use the COIN Checklist during the interoperability analysis task ⃝ 1(Strongly disagree) ⃝ 2(Disagree) ⃝ 3 (Neither) ⃝ 4 (Agree) ⃝ 5 (Strongly agree)
6b. It was clear and understandable how to use the Interoperability Analysis Tool during the interoperability analysis task
⃝ 1(Strongly disagree) ⃝ 2(Disagree) ⃝ 3 (Neither) ⃝ 4 (Agree) ⃝ 5 (Strongly agree) 7a. It was easy to learn how to use the COIN Checklist during the interoperability analysis task ⃝ 1(Strongly disagree) ⃝ 2(Disagree) ⃝ 3 (Neither) ⃝ 4 (Agree) ⃝ 5 (Strongly agree)
7b. It was easy to learn how to use the Interoperability Analysis Tool during the interoperability analysis task ⃝ 1(Strongly disagree) ⃝ 2(Disagree) ⃝ 3 (Neither) ⃝ 4 (Agree) ⃝ 5 (Strongly agree)
8b. I found it flexible to use the COIN Checklist during the interoperability analysis task
⃝ 1(Strongly disagree) ⃝ 2(Disagree) ⃝ 3 (Neither) ⃝ 4 (Agree) ⃝ 5 (Strongly agree)
8b. I found it flexible to interact with the Interoperability Analysis Tool during the interoperability analysis task
9b. It will be easy for me to become skillful at using the COIN Checklist in interoperability analysis tasks ⃝ 1(Strongly disagree) ⃝ 2(Disagree) ⃝ 3 (Neither) ⃝ 4 (Agree) ⃝ 5 (Strongly agree)
9b. It will be easy for me to become at using the Interoperability Analysis Tool in interoperability analysis tasks
⃝ 1(Strongly disagree) ⃝ 2(Disagree) ⃝ 3 (Neither) ⃝ 4 (Agree) ⃝ 5 (Strongly agree) 10a. Having the COIN Checklist during the interoperability analysis made the task easier
⃝ 1(Strongly disagree) ⃝ 2(Disagree) ⃝ 3 (Neither) ⃝ 4 (Agree) ⃝ 5 (Strongly agree) 10b. Using the Interoperability Analysis Tool during the interoperability analysis made the task easier ⃝ 1(Strongly disagree) ⃝ 2(Disagree) ⃝ 3 (Neither) ⃝ 4 (Agree) ⃝ 5 (Strongly agree)
11a. Having the COIN Checklist during the interoperability analysis helped me produce a more complete list of COINs
⃝ 1(Strongly disagree) ⃝ 2(Disagree) ⃝ 3 (Neither) ⃝ 4 (Agree) ⃝ 5 (Strongly agree)
11b. Using the Interoperability Analysis Tool during the interoperability analysis helped me produce a more
complete list of COINs
⃝ 1(Strongly disagree) ⃝ 2(Disagree) ⃝ 3 (Neither) ⃝ 4 (Agree) ⃝ 5 (Strongly agree)
12a. Having the COIN Checklist during the interoperability analysis helped me produce a more correct list of
relevant COINs
⃝ 1(Strongly disagree) ⃝ 2(Disagree) ⃝ 3 (Neither) ⃝ 4 (Agree) ⃝ 5 (Strongly agree)
12b. Having Interoperability Analysis Tool during the interoperability analysis helped me produce a more
correct list of relevant COINs
⃝ 1(Strongly disagree) ⃝ 2(Disagree) ⃝ 3 (Neither) ⃝ 4 (Agree) ⃝ 5 (Strongly agree)
13a. Having the COIN Checklist during the interoperability analysis helped me produce con-sistent/comparable lists and consequently detect moremismatches
⃝ 1(Strongly disagree) ⃝ 2(Disagree) ⃝ 3 (Neither) ⃝ 4 (Agree) ⃝ 5 (Strongly agree)
13b. Having the Interoperability Analysis Tool during the interoperability analysis helped me produce con-sistent/comparable lists and consequently detect moremismatches
⃝ 1(Strongly disagree) ⃝ 2(Disagree) ⃝ 3 (Neither) ⃝ 4 (Agree) ⃝ 5 (Strongly agree)
14a. Having the COIN Checklist during the interoperability analysis helped me save time in producing the results
⃝ 1(Strongly disagree) ⃝ 2(Disagree) ⃝ 3 (Neither) ⃝ 4 (Agree) ⃝ 5 (Strongly agree)
14b. Using the Interoperability Analysis Tool during the interoperability analysis helped me save time in pro-ducing the results
⃝ 1(Strongly disagree) ⃝ 2(Disagree) ⃝ 3 (Neither) ⃝ 4 (Agree) ⃝ 5 (Strongly agree) 15. Do you have further comments about the experiment or the used approach?
___________________________________________________________ ___________________________________________________________
ID: ______________ Material 1: UML Artifacts for SX
On the desktop of your computer station, you are provided with three UML diagrams for Sx that
you will analyze in order to find out its COIN list. Note that, the produced COIN list will be com-pared with the COIN list of Sy.
Figure 1. Excerpt from Sx class diagram
ID: ______________
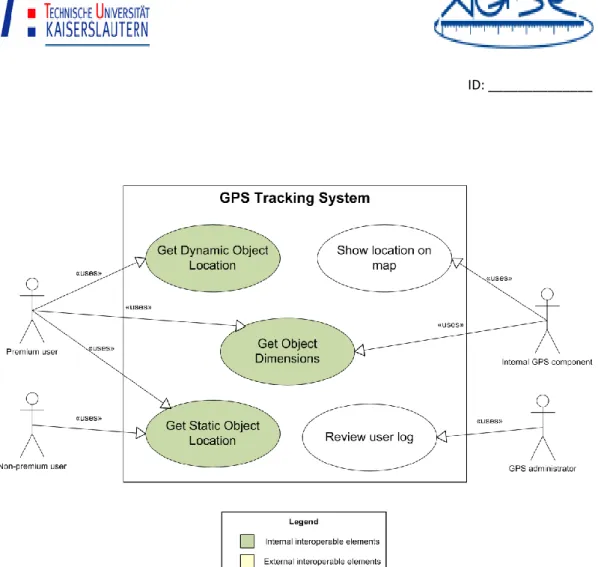
Figure 2. Excerpt from Sx use case diagram
ID: ______________ Material 2: UML Artifacts for SY
On the desktop of your computer station, you are provided with three UML diagrams for Sy that
you will analyze in order to find out its COIN list. Note that, the produced COIN list will be com-pared with the COIN list of Sx.
Figure 3. Excerpt from Sy class diagram 10– Hadil Abukwaik
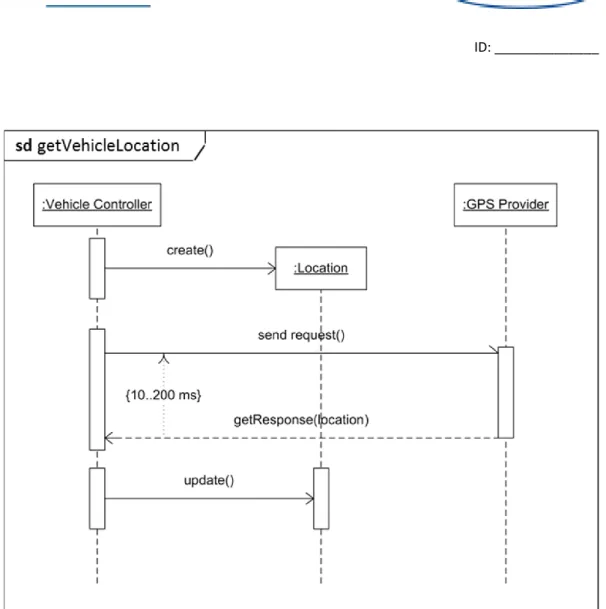
ID: ______________
Figure 4. Excerpt from Sy sequence diagram
s
ID: ______________ Material 3: COIN Checklist
This is a structured checklist for the possible types of conceptual interoperability concerns (COIN types). Review the COIN lists of Sx and Sy by, that have been automatically developed by the
In-teroperability Analysis Tool, against the checklist points. Based on you judgment and understand-ing for the interoperability need between Sx and Sy,, refine their COIN lists if needed according to
the checklist structure:
Edit: the existing COINs in the list
Add: missing and important COINs to the lists
Delete: incorrect or unnecessary COINs from the lists
ID: ______________ Material 4: Interoperability Analysis Tool
On the desktop of your computer station, you are provided with an Interoperability Analysis Tool which takes the UML artifacts for each software unit and automatically produces a list of their COIN candidates. The tool also automatically produces a list of mismatch candidates between the two software units. You decide whether to approve the suggested COINs and mismatches by the tool or to reject them.
ID: ______________ Material 5: COIN and Mismatch List Templates
Here you are provided with a template for the COIN list and another template for the Mismatch list. The templates have illustrating examples to help you in your task. Please, document your results using these templates.
Table A shows the COIN template documenting the concern example of S1 which we explained in the
introduction.
Table A. COIN List for S1
COIN ID COIN title COIN element COIN aspect
COIN value Concequent
issue(s)
More comments General Qualitative Quantitative
C1 Func-tion “Pro-vide Loca-tion” quality
Function Quality Perfor-mance <= 5 sec Interoperat-ing units unaware of this concern and request-ing higher performance may get unsatisfied. Technically the function will not have prob-lems in receiving requests.
Table B shows the COIN template documenting the concern example of S2 which we explained in the
introduction.
Table B. COIN List for S2
COIN ID COIN title COIN element COIN aspect
COIN value Concequent
issue(s)
More comments General Qualitative Quantitative
C1 Func-tion “Get Loca-tion” quality
Function Quality Perfor-mance >= 2 and <= 4 sec Using a ser-vice that provide loca-tion, but does not reach this desired per-formance can cause un-wanted de-lays. -
Table C shows the Mismatch template documenting the concern example between S1 and S2 which we
explained in the introduction.
Table C. Mismatch List between S1 and S2
Mismatch ID
Description Details
S1.S2.m1 Function Quality mismatch between S1.Provide Location and S2.Get Location
Based on S1.C1 and S2.C1, S1 has a performance value of <=5, while S2 has a quality performance value of >= 2 and <= 4 sec
Appendix B – Observation protocol template for the controlled experiment study
Possible disturbing factors’ codes Emotions
E1. Un-concentrated / Unfocused E2. Unconfident/doubtful
E3. Bothered/ frustrated E4. Tired
Events
E5. Participant(s) is (are) inactive E6. Participant arrives late E7. Participant leave early E8. Cell-phone call E9. Noise
E10. Interruption
Controlled experiment study information Study date
Study time Study location
Group (A,B)
Controlled experiment observations Participant
ID
Appendix C – Observation protocol template for the pilot study
Pilot study participant information Study date
Study time Participant name Group (A,B)
Pilot study observations
Procedures Time spent Participant questions
and comments
Experimenter notes Introduction From: to: Textual notes: e.g., slide
4 ……, slide 5 ……. Visual notes: mark the unclear information the slides themselves. Filling briefing
ques-tionnaire From: to: E x ec utio n
Read task From: to:
Build COIN list for Sx
From: to:
Build COIN list for Sy From: to: Build mismatch list between Sx and Sy From: to:
Filling debriefing ques-tionnaire
From: to:
References
1. Basili, V., Caldiera, G., Rombach, D.: Goal quation metric paradigm. In Marciniak, J., ed. : Encyclopedia of Software Engineering. John Wiley & Sons. Inc., New York (1994) 528-532 2. Davis, F. D.: Perceived usefulness, perceived ease of use, and user acceptance of information
technology. MIS quarterly, 319--340 (1989)
3. Likert, R.: A technique for the measurement of attitudes. Archives of psychology(140), 1-55 (1932)
4. Box, G. E. P., Hunter, J. S., Hunter, W. G.: Statistics for Experimenters: Design, Innovation, and Discovery 2nd edn. WILEY (2005)
5. Fraunhofer IESE auf der CeBIT 2013. In: Fraunhofer IESE. Available at: http://www.iese.fraunhofer.de/de/veranstaltungen_messen/cebit2013.html